AudJpy formed rising wedge pattern!Looking for Impulse Down.
AudJpy formed rising wedge pattern as continuation pattern and AJ should continue fall to the deep. Make sure you have your own rules on RR and follow them. This is just a trading idea to help you gain better knowledge. If you have any question ask me in comments.
Learn & Earn!
Wave Trader Pro
Audjpyshort

audjpy analysis elliot. Don't forget about stop-loss.
Write in the comments all your questions and instruments analysis of which you want to see.
Friends, push the like button, write a comment, and share with your mates - that would be the best THANK YOU.
P.S. I personally will open entry if the price will show it according to my strategy.
Always make your analysis before a trade

AUDJPY SELL Market is still bearish on 4hour 15 min double top break and retrace to continue potentially down

audjpy analysis elliot. Don't forget about stop-loss.
Write in the comments all your questions and instruments analysis of which you want to see.
Friends, push the like button, write a comment, and share with your mates - that would be the best THANK YOU.
P.S. I personally will open entry if the price will show it according to my strategy.
Always make your analysis before a trade

audjpy buy signal. Don't forget about stop-loss.
Write in the comments all your questions and instruments analysis of which you want to see.
Friends, push the like button, write a comment, and share with your mates - that would be the best THANK YOU.
P.S. I personally will open entry if the price will show it according to my strategy.
Always make your analysis before a trade

AUDJPY - Idea for a sell !!Hello traders!
‼️ This is my perspective on AUDJPY.
Technical analysis: Here we are in a bearish market structure from 4H timeframe perspective, so I look for a short. My point of interest is imbalance filled + rejection from bearish OB and level 96.000.
Like, comment and subscribe to be in touch with my content!

AUDJPY to continue in the downward move?AUDJPY - 24h expiry
There is no clear indication that the downward move is coming to an end.
Although we remain bearish overall, a correction is possible without impacting the trend lower.
Risk/Reward would be poor to call a sell from current levels.
A move through 95.25 will confirm the bearish momentum.
The measured move target is 94.50.
We look to Sell at 95.70 (stop at 96.05)
Our profit targets will be 94.70 and 94.50
Resistance: 95.50 / 95.70 / 96.00
Support: 95.25 / 95.00 / 94.50
Risk Disclaimer
The trade ideas beyond this page are for informational purposes only and do not constitute investment advice or a solicitation to trade. This information is provided by Signal Centre, a third-party unaffiliated with OANDA, and is intended for general circulation only. OANDA does not guarantee the accuracy of this information and assumes no responsibilities for the information provided by the third party. The information does not take into account the specific investment objectives, financial situation, or particular needs of any particular person. You should take into account your specific investment objectives, financial situation, and particular needs before making a commitment to trade, including seeking advice from an independent financial adviser regarding the suitability of the investment, under a separate engagement, as you deem fit.
You accept that you assume all risks in independently viewing the contents and selecting a chosen strategy.
Where the research is distributed in Singapore to a person who is not an Accredited Investor, Expert Investor or an Institutional Investor, Oanda Asia Pacific Pte Ltd (“OAP“) accepts legal responsibility for the contents of the report to such persons only to the extent required by law. Singapore customers should contact OAP at 6579 8289 for matters arising from, or in connection with, the information/research distributed.

AUDJPY SHORT: Caixin Services PMI lower than estimatedChina's January Caixin Services PMI was 51.0 vs. 52.2 in December. This shows a slowing service sector in China. As a result of this economic news release, the Australian dollar is expected to potentially weaken against the Japanese yen. We must remember that China is one of Australia's biggest trading partners, so anything that happens in China will almost always affect the Australian dollar.

AUD/JPY: Bearish Reversal in Play, A Long Downtrend Awaits?Hey Realistic Traders, OANDA:AUDJPY has no chance for a Bullish Outlook? Let's dive into the analysis...
After a prolonged consolidation phase, the Aussie Yen has once again traded below the EMA-200 line, forming a new lower high along the way. This bearish signal marked the beginning of a continued downward movement, which was further confirmed by a breakout from a rising wedge pattern. Such breakouts typically indicate strong bearish momentum, especially when accompanied by multiple bearish marubozu candlesticks.
Further strengthening this outlook, a falling wedge breakout occurred on the JPYBASKET, signaling a continuation of its prevailing bullish trend. This divergence between Aussie Yen and JPYBASKET adds weight to our bearish analysis.
Considering these strong technical signals, the price is likely to move downward toward the first target at 94.651 or potentially the second target at 93.716.
However, this bearish scenario depends on the price staying below the critical stop-loss level at 98.478.
Support the channel by engaging with the content, using the rocket button, and sharing your opinions in the comments below.
"Disclaimer: "Please note that this analysis is solely for educational purposes and should not be considered a recommendation to take a long or short position on Aussie Yen".

audjpy buy signal. Don't forget about stop-loss.
Write in the comments all your questions and instruments analysis of which you want to see.
Friends, push the like button, write a comment, and share with your mates - that would be the best THANK YOU.
P.S. I personally will open entry if the price will show it according to my strategy.
Always make your analysis before a trade

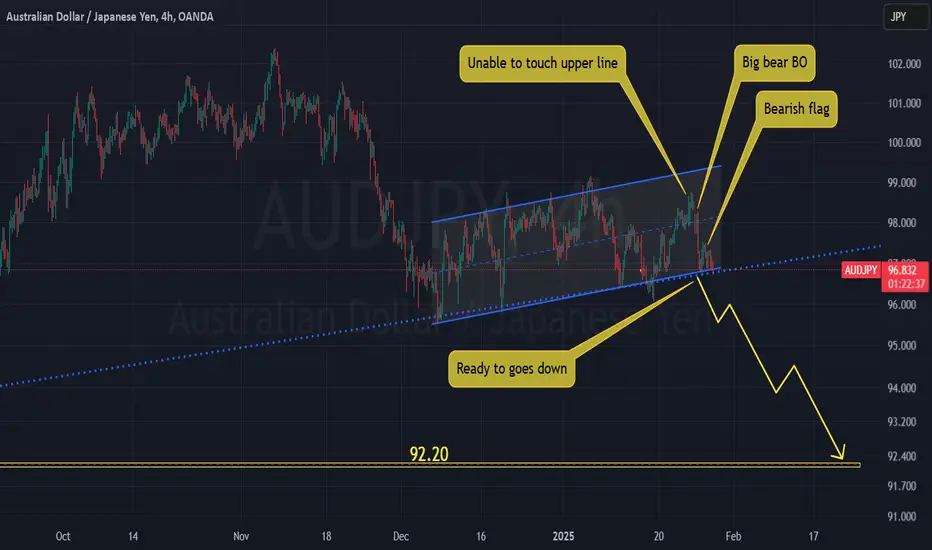
Aussie yen will weak again...After last week fake bear break out, Aussie is ready now to goes down.
Big bearish move after Aussie unable to touch upper line of the channel is good sign of bear control in Aussie yen pair.
trade safe
good luck.
Key Resistance Level for AUDJPY: Towards 98.000?OANDA:AUDJPY is approaching a critical resistance level that has previously seen bearish reversals. The ongoing bullish momentum could provide an opportunity for sellers to step in and take control.
Key point: If we observe bearish signals such as rejection wicks at this resistance, the price could potentially drop towards 98.000. However, a breakout above this level would invalidate the bearish setup and shift the bias to a more bullish outlook.
It’s important to wait for clear rejection signals before considering any short positions. I'd love to hear your thoughts or different perspectives in the comments!

AUDJPY buy signal. Don't forget about stop-loss.
Write in the comments all your questions and instruments analysis of which you want to see.
Friends, push the like button, write a comment, and share with your mates - that would be the best THANK YOU.
P.S. I personally will open entry if the price will show it according to my strategy.
Always make your analysis before a trade

AUDJPY ShortPrice is respecting the higher timeframe fib and made it first push away from the area. Looking for price to pull back into the resistance zone for a second test for an entry. Will wait for lower timeframe confirmation and momentum before entering

AUDJPY - Short from bearish OB !!Hello traders!
‼️ This is my perspective on AUDJPY.
Technical analysis: Here we are in a bearish market structure from 4H timeframe perspective, so I look for a short. I expect price to continue the retracement to fill the imbalance higher and then to reject from bearish OB.
Like, comment and subscribe to be in touch with my content!

audjpy buy signal. Don't forget about stop-loss.
Write in the comments all your questions and instruments analysis of which you want to see.
Friends, push the like button, write a comment, and share with your mates - that would be the best THANK YOU.
P.S. I personally will open entry if the price will show it according to my strategy.
Always make your analysis before a trade

AUDJPY is Holding After Channel BreakoutHello Traders
In This Chart AUDJPY HOURLY Forex Forecast By FOREX PLANET
today AUDJPY analysis 👆
🟢This Chart includes_ (AUDJPY market update)
🟢What is The Next Opportunity on AUDJPY Market
🟢how to Enter to the Valid Entry With Assurance Profit
This CHART is For Trader's that Want to Improve Their Technical Analysis Skills and Their Trading By Understanding How To Analyze The Market Using Multiple Timeframes and Understanding The Bigger Picture on the Charts

audjpy buy signal. Don't forget about stop-loss.
Write in the comments all your questions and instruments analysis of which you want to see.
Friends, push the like button, write a comment, and share with your mates - that would be the best THANK YOU.
P.S. I personally will open entry if the price will show it according to my strategy.
Always make your analysis before a trade

AUDJPY ALERT!AUDJPY ALERT!
AMD pattern confirmed on the Weekly chart!
GET READY FOR A BIG DROP!
Stay alert and prepared for a potential sharp decline!
Follow our updates for timely analysis and trade signals!

My plan SHORT for AUDJPT and LONG for JPYUSDI saw A strong DownTrend structure on OANDA:AUDJPY
I saw A Break Sell follow trend on M15 chart of AUDJPY
Also I Saw a strong Break buy follow trend on M15 chart of PEPPERSTONE:JPYX JPYUSD currency index.
So I make a plan SHORT for AUDJPY and also a plan LONG for JAPAN YEN
Target with RR= 3

JPY currency index and JPY pairs ideas📊🇯🇵Since JPYX (JPY Currency Index), Daily chart rebounded from the Demand zone after the Jibun Bank Japan Manufacturing PMI yesterday.
Here we spotted some JPY pairs changed direction in Daily Chart as well. They are in BOS(Break of structure) stage, we are waiting a retest back to the Sell Zone and drop again.

AUDJPY Short Term Sell IdeaH4 - Bearish trend pattern followed by a pullback
Until the two strong resistance zones hold my short term view remains bearish here

16-12-2024 - AUDJPY Short16/12/2024 - AUDJPY - Short Trade Plan
Trade Details:
Entry: 98.454
Stop Loss: 98.789
Take Profit 1: 98.110
Final Target: 97.117
Reason for Trade:
Price is rejecting a strong supply zone and trendline resistance.
Potential bearish reversal setup is forming after a retest of the resistance zone.
RSI shows a potential bearish divergence, further supporting the short bias.
Disclaimer : This trade plan is for educational purposes only and not financial advice. Always perform your own analysis and risk management before executing any trades.
