AUDNZD Local Long!
HI,Traders !
#AUDNZD made a bullish
Breakout of the key horizontal
Level of 1.09105 which is now a
Support and the pair is going down
To retest the level from where
We will be expecting a
Further bullish move up !
Comment and subscribe to help us grow !
AUDNZD

Australian job numbers and AUDWe are keeping a close eye on the Australian job numbers tonight. If you are trading AUD, then that's the data to watch. Let's dig in.
FX_IDC:AUDUSD
FX_IDC:AUDJPY
FX_IDC:AUDNZD
Let us know what you think in the comments below.
Thank you.
75.2% of retail investor accounts lose money when trading CFDs with this provider. You should consider whether you understand how CFDs work and whether you can afford to take the high risk of losing your money. Past performance is not necessarily indicative of future results. The value of investments may fall as well as rise and the investor may not get back the amount initially invested. This content is not intended for nor applicable to residents of the UK. Cryptocurrency CFDs and spread bets are restricted in the UK for all retail clients.

AUDNZD Under Pressure! SELL!
My dear followers,
This is my opinion on the AUDNZD next move:
The asset is approaching an important pivot point 1.0975
Bias - Bearish
Technical Indicators: Supper Trend generates a clear short signal while Pivot Point HL is currently determining the overall Bearish trend of the market.
Goal - 1.0966
About Used Indicators:
For more efficient signals, super-trend is used in combination with other indicators like Pivot Points.
Disclosure: I am part of Trade Nation's Influencer program and receive a monthly fee for using their TradingView charts in my analysis.
———————————
WISH YOU ALL LUCK
Stealing Pips Like a Pro – AUD/NZD Long Heist, MA Breakout Setup🎯 AUD/NZD Heist: Bullish Bank Robbery 🚀💰 (Thief Trading Style)
🌟 Hi! Hola! Ola! Bonjour! Hallo! Marhaba! 🌟
Dear Money Makers & Robbers, 🤑💸✈️
Based on 🔥Thief Trading Style🔥 (technical + fundamental analysis), here’s our master plan to loot the AUD/NZD "Aussie vs Kiwi" Forex Bank!
🔎 The Heist Setup (Long Entry Focus)
🐂 Bullish Breakout Strategy:
Entry: Wait for MA breakout (1.08150) then strike!
Alternative Entry: Place Buy Stop above MA OR Buy Limit near pullback zones (15-30min timeframe).
Pro Tip: Set an ALERT for breakout confirmation!
🛑 Stop Loss (Thief’s Safety Net):
"Yo, listen up! 🗣️ If you're entering via Buy Stop, don’t set SL until after breakout!
Thief’s SL Zone: Nearest swing low (1.07500 – 3H timeframe).
Adjust SL based on your risk, lot size, and trade plan.
🎯 Profit Targets:
1st Target: 1.08600 (or escape earlier if cops lurk!).
Scalpers: Only scalp LONG! Use trailing SL to protect gains.
⚠️ Critical Heist Rules:
Avoid news chaos! 🚨 No new trades during high-impact news.
Lock profits with trailing stops.
Cops (Bears) are strong near resistance – don’t get caught!
💥 Boost the Heist!
💖 Hit the "Boost" button to strengthen our robbery squad! More likes = more 💰easy money heists!
Stay tuned for the next big steal! 🏆🚀🐱👤

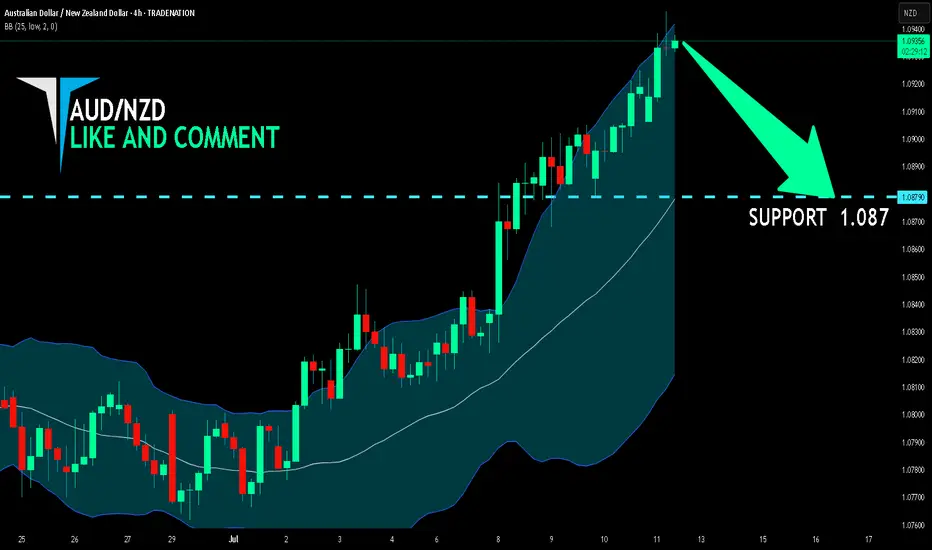
AUD/NZD SHORT FROM RESISTANCE
Hello, Friends!
AUD/NZD pair is in the downtrend because previous week’s candle is red, while the price is clearly rising on the 4H timeframe. And after the retest of the resistance line above I believe we will see a move down towards the target below at 1.087 because the pair is overbought due to its proximity to the upper BB band and a bearish correction is likely.
Disclosure: I am part of Trade Nation's Influencer program and receive a monthly fee for using their TradingView charts in my analysis.
✅LIKE AND COMMENT MY IDEAS✅
AUD-NZD Short From Resistance! Sell!
Hello,Traders!
AUD-NZD keeps growing
And the pair is overbought
So after it hits the horizontal
Resistance of 1.0921 from
Where we will be expecting
A local bearish correction
Sell!
Comment and subscribe to help us grow!
Check out other forecasts below too!
Disclosure: I am part of Trade Nation's Influencer program and receive a monthly fee for using their TradingView charts in my analysis.

AUD_NZD SWING SHORT|
✅AUD_NZD has been growing recently
And the pair seems locally overbought
So as the pair is approaching a horizontal resistance of 1.0920
Price decline is to be expected
SHORT🔥
✅Like and subscribe to never miss a new idea!✅
Disclosure: I am part of Trade Nation's Influencer program and receive a monthly fee for using their TradingView charts in my analysis.

AUDNZD; Heikin Ashi Trade IdeaOANDA:AUDNZD
In this video, I’ll be sharing my analysis of AUDNZD, using FXAN's proprietary algo indicators with my unique Heikin Ashi strategy. I’ll walk you through the reasoning behind my trade setup and highlight key areas where I’m anticipating potential opportunities.
I’m always happy to receive any feedback.
Like, share and comment! ❤️
Thank you for watching my videos! 🙏

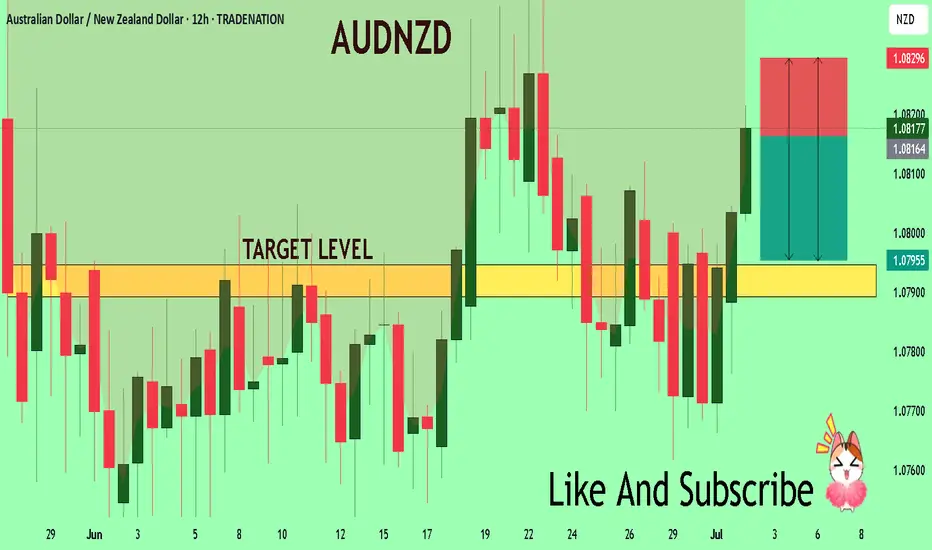
AUDNZD Breakout Retest – Ready for the Next Bullish Leg?
AUDNZD has broken out of a prolonged consolidation box, supported by a demand zone below. Price is currently retesting the breakout level, which often acts as a launchpad for the next move.
🧠 Key Observations:
🔷 Consolidation Breakout – Price cleanly broke above the consolidation range.
🔁 Retest in Progress – A potential bullish retest is unfolding at 1.0800 area.
🟦 Demand Zone below offers strong support around 1.0730–1.0750.
🎯 Target: 1.08750 (pre-identified resistance zone)
----------
📌 Trade Plan:
🎯 Take Profit (TP): 1.0875
🛑 Stop Loss (SL): Below 1.0750 demand zone
🧭 Bias: Bullish
📊 Strategy: Breakout–Retest–Rally

AUDNZD: Short Trade Explained
AUDNZD
- Classic bearish formation
- Our team expects pullback
SUGGESTED TRADE:
Swing Trade
Short AUDNZD
Entry - 1.0834
Sl - 1.0850
Tp - 1.0801
Our Risk - 1%
Start protection of your profits from lower levels
Disclosure: I am part of Trade Nation's Influencer program and receive a monthly fee for using their TradingView charts in my analysis.
❤️ Please, support our work with like & comment! ❤️

AUD-NZD Local Long! Buy!
Hello,Traders!
AUD-NZD is already making
A bullish rebound from the
Horizontal support of 1.0810
So we are locally bullish biased
And we will be expecting a
Further bullish move up
Buy!
Comment and subscribe to help us grow!
Check out other forecasts below too!
Disclosure: I am part of Trade Nation's Influencer program and receive a monthly fee for using their TradingView charts in my analysis.

AUD_NZD WILL GROW|LONG|
✅AUD_NZD made a bullish
Rebound so we are bullish
Biased and we will be expecting
A further bullish move up
LONG🚀
✅Like and subscribe to never miss a new idea!✅
Disclosure: I am part of Trade Nation's Influencer program and receive a monthly fee for using their TradingView charts in my analysis.

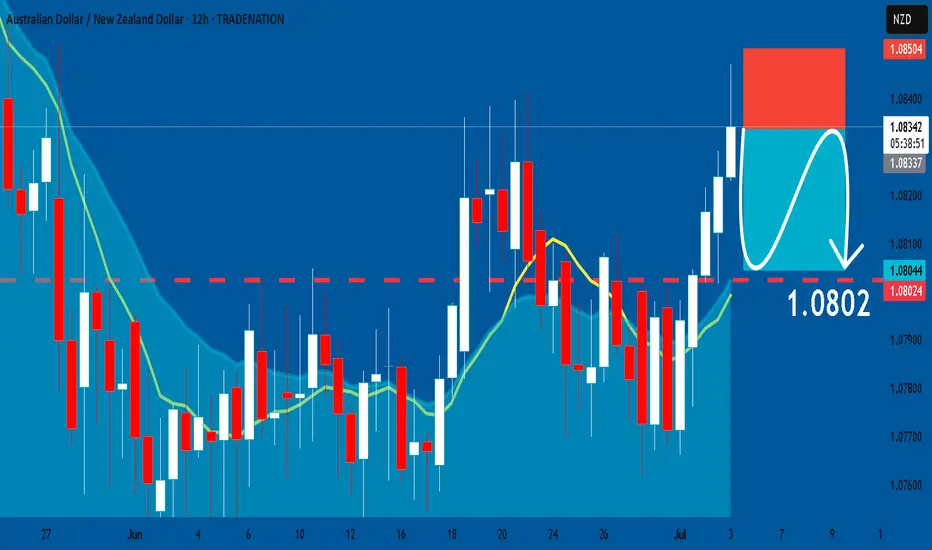
AUDNZD: Short Trading Opportunity
AUDNZD
- Classic bearish setup
- Our team expects bearish continuation
SUGGESTED TRADE:
Swing Trade
Short AUDNZD
Entry Point - 1.0834
Stop Loss - 1.0850
Take Profit - 1.0802
Our Risk - 1%
Start protection of your profits from lower levels
Disclosure: I am part of Trade Nation's Influencer program and receive a monthly fee for using their TradingView charts in my analysis.
❤️ Please, support our work with like & comment! ❤️
AUD_NZD LOCAL LONG|
✅AUD_NZD made a retest
And a bullish rebound from
The horizontal support level
Around 1.0805 so we are
Locally bullish biased and we
Will be expecting a further
Bullish move up
LONG🚀
✅Like and subscribe to never miss a new idea!✅
Disclosure: I am part of Trade Nation's Influencer program and receive a monthly fee for using their TradingView charts in my analysis.

AUDNZD Will Collapse! SELL!
My dear friends,
Please, find my technical outlook for AUDNZD below:
The price is coiling around a solid key level - 1.0816
Bias - Bearish
Technical Indicators: Pivot Points Low anticipates a potential price reversal.
Super trend shows a clear sell, giving a perfect indicators' convergence.
Goal - 1.0794
Safe Stop Loss - 1.0829
About Used Indicators:
The pivot point itself is simply the average of the high, low and closing prices from the previous trading day.
Disclosure: I am part of Trade Nation's Influencer program and receive a monthly fee for using their TradingView charts in my analysis.
———————————
WISH YOU ALL LUCK
AUDNZD The Target Is DOWN! SELL!
My dear subscribers,
AUDNZD looks like it will make a good move, and here are the details:
The market is trading on 1.0817 pivot level.
Bias - Bearish
Technical Indicators: Both Super Trend & Pivot HL indicate a highly probable Bearish continuation.
Target - 1.0798
About Used Indicators:
The average true range (ATR) plays an important role in 'Supertrend' as the indicator uses ATR to calculate its value. The ATR indicator signals the degree of price volatility.
Disclosure: I am part of Trade Nation's Influencer program and receive a monthly fee for using their TradingView charts in my analysis.
———————————
WISH YOU ALL LUCK

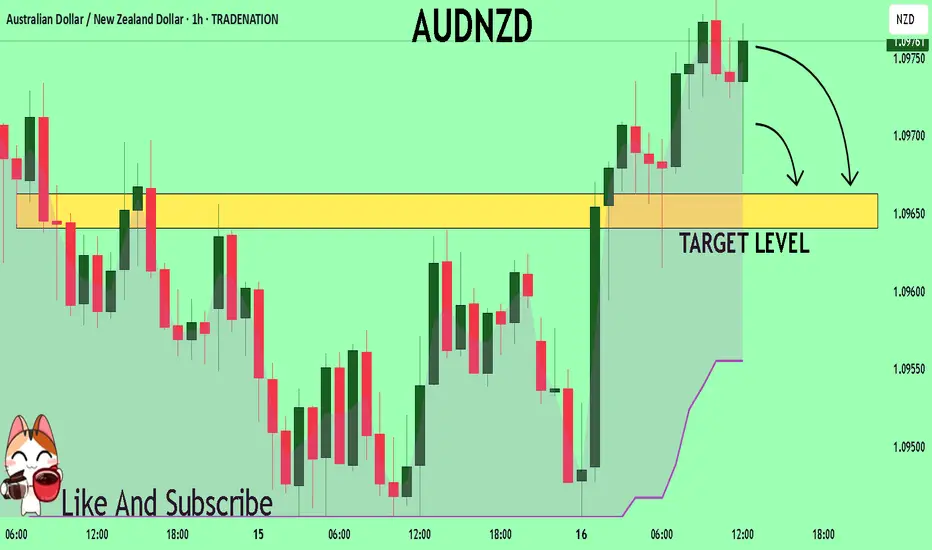
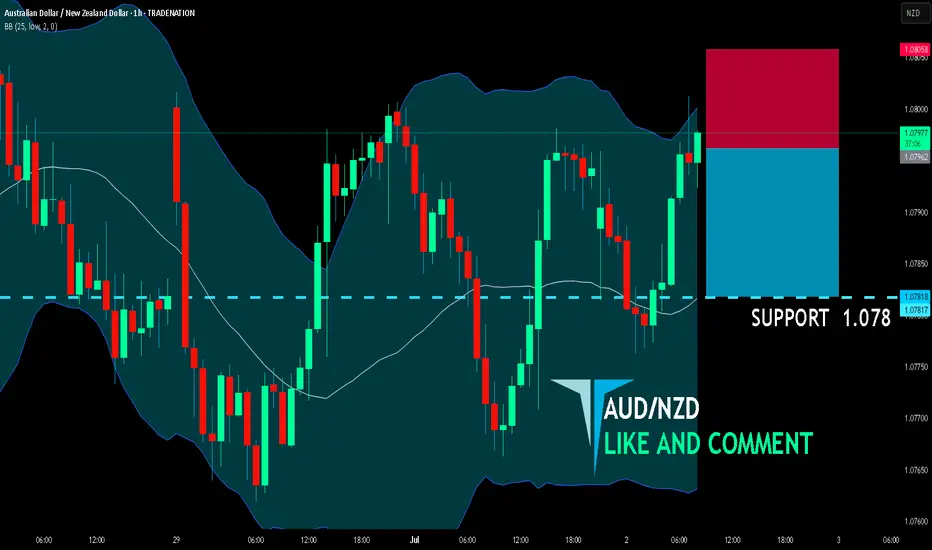
AUD/NZD SHORT FROM RESISTANCE
AUD/NZD SIGNAL
Trade Direction: short
Entry Level: 1.079
Target Level: 1.078
Stop Loss: 1.080
RISK PROFILE
Risk level: medium
Suggested risk: 1%
Timeframe: 1h
Disclosure: I am part of Trade Nation's Influencer program and receive a monthly fee for using their TradingView charts in my analysis.
✅LIKE AND COMMENT MY IDEAS✅
AUD_NZD LOCAL LONG|
✅AUD_NZD is trading along the rising support line
And as the pair is going up now
After the retest of the line
I am expecting the price to keep growing
To retest the supply levels above at 1.0789
LONG🚀
✅Like and subscribe to never miss a new idea!✅
Disclosure: I am part of Trade Nation's Influencer program and receive a monthly fee for using their TradingView charts in my analysis.

AUDNZD The Target Is DOWN! SELL!
My dear followers,
I analysed this chart on AUDNZD and concluded the following:
The market is trading on 1.0803 pivot level.
Bias - Bearish
Technical Indicators: Both Super Trend & Pivot HL indicate a highly probable Bearish continuation.
Target - 1.0792
About Used Indicators:
A super-trend indicator is plotted on either above or below the closing price to signal a buy or sell. The indicator changes color, based on whether or not you should be buying. If the super-trend indicator moves below the closing price, the indicator turns green, and it signals an entry point or points to buy.
Disclosure: I am part of Trade Nation's Influencer program and receive a monthly fee for using their TradingView charts in my analysis.
———————————
WISH YOU ALL LUCK

AUDNZD On The Rise! BUY!
My dear followers,
This is my opinion on the AUDNZD next move:
The asset is approaching an important pivot point 1.0782
Bias - Bullish
Technical Indicators: Supper Trend generates a clear long signal while Pivot Point HL is currently determining the overall Bullish trend of the market.
Goal - 1.0797
About Used Indicators:
For more efficient signals, super-trend is used in combination with other indicators like Pivot Points.
Disclosure: I am part of Trade Nation's Influencer program and receive a monthly fee for using their TradingView charts in my analysis.
———————————
WISH YOU ALL LUCK

AUD-NZD Long From Rising Support! Buy!
Hello,Traders!
AUD-NZD went down but
Will soon retest a rising
Support line from where
We will be expecting a
Bullish rebound and a move up
Buy!
Comment and subscribe to help us grow!
Check out other forecasts below too!
Disclosure: I am part of Trade Nation's Influencer program and receive a monthly fee for using their TradingView charts in my analysis.

AUD_NZD LOCAL LONG|
✅AUD_NZD has retested a key support level of 1.0800
And as the pair is already making a bullish rebound
A move up to retest the supply level above at 1.0820 is likely
LONG🚀
✅Like and subscribe to never miss a new idea!✅
Disclosure: I am part of Trade Nation's Influencer program and receive a monthly fee for using their TradingView charts in my analysis.

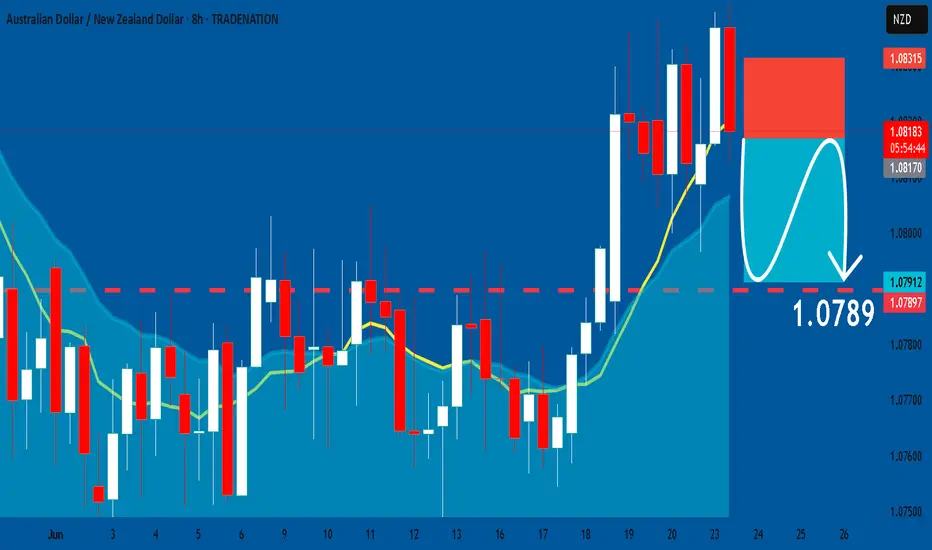
AUDNZD: Short Trading Opportunity
AUDNZD
- Classic bearish formation
- Our team expects pullback
SUGGESTED TRADE:
Swing Trade
Short AUDNZD
Entry - 1.0817
Sl - 1.0831
Tp - 1.0789
Our Risk - 1%
Start protection of your profits from lower levels
Disclosure: I am part of Trade Nation's Influencer program and receive a monthly fee for using their TradingView charts in my analysis.
❤️ Please, support our work with like & comment! ❤️