SonTrader - BUY AUDNZDEntry : 1.08675
SL : 1.08510
TP : 1.095
RRR : 1/5
Every trade has risk!! So please set SL with your own caution and always follow my orders at Tradingview !!
Support Broker with me in the Bio section
AUDNZD

AUDNZD Just made its turn off the bottom.AUDNZD need to reload with some stronger hands to continue going up. This move is already finished its bottom turn. I have a path copied from back in the past that mimics not only the candles but the placement of the lines and the intent or set up used to get it to look and move the way it does.
ESVO is the indicator that I use I made it with ChatGPT using my own formula and it shows all the interest of all the different timeframes and also identifies oppurtunities where price is in agreeance across all timeframes and launches for a profit run. It also has signals that let you know when the move is over as much as 24 hours prior to the event.
by iCantw84it
08.30.23

AUDNZD Round Two.... FIGHT!Its that time, AUDNZD took a long kiss good night over the weekend and woke up to prince charming this sunday. If you see the price action on the 4 hour in riding in between the interest of all the timeframes. This is something new I have seen but Its mostly on forex.... It seems that who ever is the main mover of the market likes to use all the timeframes to buy and sell shares at. pretty interesting and actually kind of smart. Its different from traditional markets so its pretty intriguing to me. Use the interest of the buyers and sellers to dump your shares and resupply which would make the move a lot faster as your are using each area of interests to move you to the destination.
Anyways. Should be a decent move to the upside...not saying it can't run down a few more times.... I added a path from a previous move which it should align with.
by iCantw84it
09.03.23

AUDNZD: Bearish Continuation & Short Signal
AUDNZD
- Classic bearish formation
- Our team expects pullback
SUGGESTED TRADE:
Swing Trade
Short AUDNZD
Entry - 1.0893
Sl - 1.0919
Tp - 1.0833
Our Risk - 1%
Start protection of your profits from lower levels
❤️ Please, support our work with like & comment! ❤️

AUDNZD Bearish Wedge!AUD-NZD has formed
A bearish wedge pattern
So IF we see a bearish
Breakout then the pair
Will go further down !


AUDNZD The closing of the 1D candle is important.The AUDNZD pair is testing the top (dotted trend-line) of the Triangle pattern that started on the July 24 High that was a rejection on the 1.093250 Symmetrical Resistance. Friday's candle broke but closed below it. If any manages to close above it, we will buy and target 1.09350 on a potential emergence of a Channel Up. If on the contrary its rejected, we will be bearish, targeting the Triangle's bottom at 1.07600.
A 1D candle closing above the Symmetrical Resistance or below Support 1 (1.073350) will be a bullish and bearish break-out targeting 1.010530 (Resistance 1) and 1.063250 (Higher Lows) respectively.
-------------------------------------------------------------------------------
** Please LIKE 👍, FOLLOW ✅, SHARE 🙌 and COMMENT ✍ if you enjoy this idea! Also share your ideas and charts in the comments section below! **
-------------------------------------------------------------------------------
💸💸💸💸💸💸
👇 👇 👇 👇 👇 👇

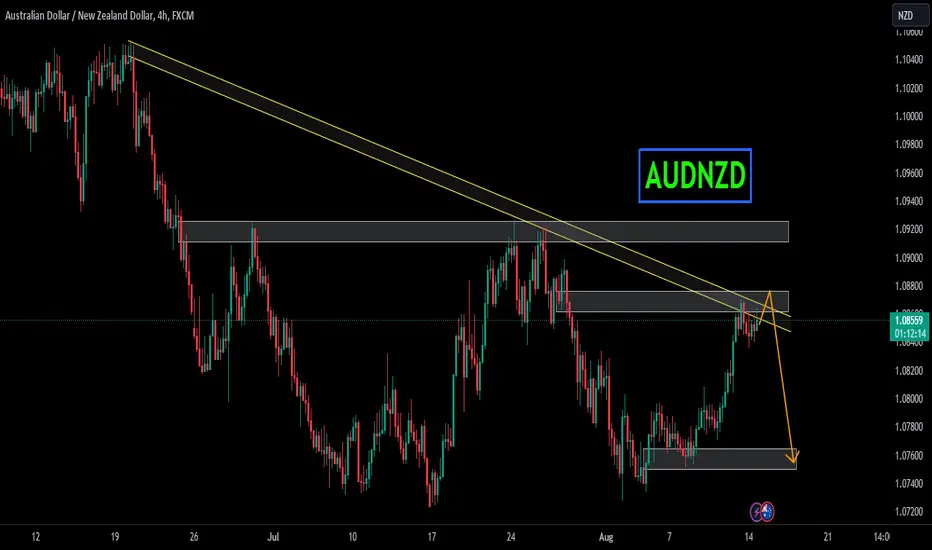
AUDNZD H4 | Bearish reversal off multi-swing-high?AUDNZD could rise towards the sell entry at 1.08677 which is a multiple swing-high resistance and could potentially reverse from this level to drop lower.
Stop loss is at 1.09263 which is an overlap resistance level that aligns above the 127.2% Fibonacci extension level.
Take profit is between 1.07950 and 1.07885 which is a pullback support level.
High Risk Investment Warning
Trading Forex/CFDs on margin carries a high level of risk and may not be suitable for all investors. Leverage can work against you.
Forex Capital Markets Limited (www.fxcm.com):
CFDs are complex instruments and come with a high risk of losing money rapidly due to leverage. 70% of retail investor accounts lose money when trading CFDs with this provider. You should consider whether you understand how CFDs work and whether you can afford to take the high risk of losing your money.
Stratos Europe Ltd, previously FXCM EU Ltd (www.fxcm.com):
CFDs are complex instruments and come with a high risk of losing money rapidly due to leverage. 74% of retail investor accounts lose money when trading CFDs with this provider. You should consider whether you understand how CFDs work and whether you can afford to take the high risk of losing your money.
FXCM Australia Pty. Limited (www.fxcm.com): **
Trading FX/CFDs carries significant risks. FXCM AU (AFSL 309763), please read the Financial Services Guide, Product Disclosure Statement, Target Market Determination and Terms of Business at www.fxcm.com
FXCM Markets LLC (www.fxcm.com):
Losses can exceed deposits.
Please be advised that the information presented on TradingView is provided to FXCM (‘Company’, ‘we’) by a third-party provider (‘Name of third party provider). Please be reminded that you are solely responsible for the trading decisions on your account. There is a very high degree of risk involved in trading. Any information and/or content is intended entirely for research, educational and informational purposes only and does not constitute investment or consultation advice or investment strategy. The information is not tailored to the investment needs of any specific person and therefore does not involve a consideration of any of the investment objectives, financial situation or needs of any viewer that may receive it. Kindly also note that past performance is not a reliable indicator of future results. Actual results may differ materially from those anticipated in forward-looking or past performance statements. We assume no liability as to the accuracy or completeness of any of the information and/or content provided herein and the Company cannot be held responsible for any omission, mistake nor for any loss or damage including without limitation to any loss of profit which may arise from reliance on any information supplied by Name of third party provider.
The speaker(s) is neither an employee, agent nor representative of FXCM and is therefore acting independently. The opinions given are their own, constitute general market commentary, and do not constitute the opinion or advice of FXCM or any form of personal or investment advice. FXCM neither endorses nor guarantees offerings of third party speakers, nor is FXCM responsible for the content, veracity or opinions of third-party speakers, presenters or participants.

AUDNZD investment entry set and forget setupaudnzd is ready to fall recently its break of its structure as i mentioned in the chart on little retracement youcan get in and wait for the given entry area for better risk to reward ratio good luck

Long AUDNZDAUDNZD daily Heiken Ashi candle closed green after a red daily Heiken Ashi candle. This in addition to a previous green weekly Heiken Ashi candle suggests to me that this week may be bullish.
I entered with a market order and placed my stop loss just below the local low on the daily chart.

AUDNZD LONGhello traders. in this setup we have CHOCH in 4hr and also in 1.so we can wait for confirmation around FVG area for our long entry.
r:r 1.82
“”your follows and boosts encourage me to publish more analysis””

AUDNZD - ABCD PatternAUDNZD forming ABCD Pattern, If it breaks point B which is recent LL, we can take the trade, Keeping stoploss above recent HH and Risk Reward, 1:1, 1:2. Stoploss at Entry when TP1 Hits.

AUDNZDAUDNZD is trading in symmetrical triangle pattern. The price is reacting well the support and resistance of triangle.
Currently the price is at the support of triangle where it is also forming a local support zone and seems like the price may break through the triangle.
If the breakout sustain to upside the optimum target could be 1.0842 followed by 1.0880.

✨ NEW: AUDNZD ✨ SWING ✨SLO @ 1.0800 ⏳
SSO @ 1.0780 ⏳
TP1 @ 1.0750
TP2 @ 1.0710
TP3 @ 1.0670
BLO @ 1.0600 ⏳
— I'm anticipating the possibility of a DT
— Let's see if we can catch it

BUY AUDNZDAUDNZD flirting with crucial support. Bearish movement is weak, we anticipate bullish movement from here. Inverse h&s confirming bullish movement.

Strifor || AUDUSD-08/21/2023Preferred direction: SELL
Comment: The US dollar continues to put pressure on the Australian dollar, namely, the squeeze to the level of 0.63750 most likely indicates the seller's intention to continue falling prices. The downside potential is located at the levels of 0.63500 and 0.63000.
Thank you for like and share your views!

AUDNZD Potential DownsidesHey Traders, in today's trading session we are monitoring AUDNZD for a selling opportunity around 1.08 zone, AUDNZD was trading in an uptrend and successfully managed to break it out. Currently is in a correction phase in which it is approaching the trend at 1.08 support and resistance area.
Trade safe, Joe.

AUDNZD Analysis H1Here is my analysis for AUDNZD on H1 using Order Block. The price could go bearish, you can put a pending order on the Order block or find an entry on LTF within OB Zone. Trade Safe!

AUD NZD LONGRisk 0.5%
TP1 = 1:1 RR
Disclaimer:
The contents in this Idea are intended for information purpose only and do not constitute investment recommendation or advice. Nor are they used to promote any specific products or services. They serve as an integral part of a case study to demonstrate fundamental concepts in risk management under given market scenarios. A full version of the disclaimer is available in our profile description.

Strifor || AUDUSD-08/15/2023Preferred direction: SELL
Comment: To date, one of the most prone to falling currencies. This pair has broken through significant daily supports and now the downside potential for the pair lies at the level of 0.62000. The current deal is more conservative and the target is seen at the level of 0.64000.
Thank you for like and share your views!

AUDNZDAUDNZD is trading at strong sellers area.
sellers are having multiple selling confluences in this area as there is rejection from long term bearish trendline as well as there is horizontal resistance level.
Will the bears attack these area and push the price to even lower?
AUDNZD Potential UpsidesHey Traders, in tomorrow's trading session we are monitoring AUDNZD for a buying opportunity around 1.07900 zone, AUDNZD is trading in an uptrend and currently is in a correction phase in which it is approaching the trend at 1.07900 support and resistance zone.
Trade safe, Joe.

AUDNZD I Pullback and tendency to riseWelcome back! Let me know your thoughts in the comments!
** AUDNZD Analysis - Listen to video!
We recommend that you keep this pair on your watchlist and enter when the entry criteria of your strategy is met.
Please support this idea with a LIKE and COMMENT if you find it useful and Click "Follow" on our profile if you'd like these trade ideas delivered straight to your email in the future.
Thanks for your continued support!
