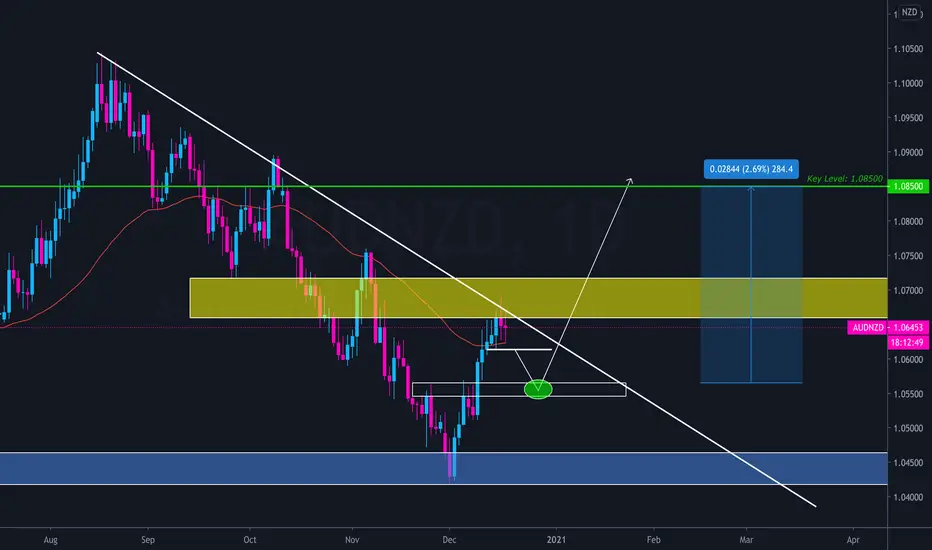
Audnzdanalysis

AUDNZD - two scenarios 1: correction
2: grown
I think we're in for a correction.
After such a growth, to continue we need a correction.
From the long position went out completely.
Push like if you think this is a useful idea!
Before to trade my ideas make your own analysis.
Write your comments and questions here!
Thanks for your support!

AUDNZD Downward Momentum Slowing DownAs we can see, BEARISH momentum have slowed down for now as we start seeing movement at the upper side of the ichimoku cloud. There was great consolidation in the cloud before yesterday's candle close. This give us a BULLISH opportunity to the resistance zone (red zone). That is also where I will expect a price rejection followed by BEARISH movement.
Kindly hit the LIKE Button if you agree with my analysis and feel free to COMMENT your idea below. As for those who are keen to get daily updates and analysis from me feel free to FOLLOW me. Cheers and Happy Trading!!


AUDNZD Long Setup Trend: Uptrend
Key Level: 1.05500
Waiting for this market to pullback from 1.07000 to retest recently broken key level 1.05500 as support.
AUDNZD Potential Sell Setup Trend - Overall Uptrend (HTF), Break of uptrend structure (LTF)
Key level - 1.06500
Entry Signal - Waiting for entry signal in key level zone after the pullback

AUDNZD it could be starting of a new up trend !We will go Long on the breakout of the consolidation zone. Thank You Trade safe.

AUDNZD Buy SetupTrend - Uptrend
Key Level - 1.06600 (Resistance), 1.05800 - 1.05600 (Support)
Signal - Waiting for the signal at golden zone or key level zone

AUDNZD downtrend setupprice direction: DOWNTREND
potential target price: 1.0568
**Disclaimer** the content on this analysis is subject to change at any time without notice, and is provided for the sole purpose of assisting traders to make independent investment decisions.
Traders!! if you like my ideas and do take the same trade as I do, please write it in a comment so we can manage the trade together.
_____________________________________________________________________________________________________________________
Thank you for your support ;)
GWBFX

AUDNZD - Daily and 4H - Descending ChannleDescending Channel visible on both 4H and Daily. Market has respected this pattern since mid August.
Daily is still on a downtrend and forming a LH. rejection could lead to our bearish setup.
BUT
4H is just forming its first HH. Heavy buyers volume at the moment, if sellers don't enter the market soon we could see the breakout of this descending channel.
Right now personally will be patient on this Pair and keep a lookout for next week.
Follow us for more ideas and setups
Sam

AUDNZD - Buy opportunity seems almost readyThe market hasn't over so many opportunities at the moment a that is worth to trade in my opinion. Lately, .. the market has just gone very corrective that has last for several weeks startingin early Novermber. Nevertheless, AUDNZD pair is still something to keep our eyes on, in my opinion.
This pair has reach the daily double bottom area (inflection point) while forming a corrective descending structure (Falling Wedge like). The price even pierced through that area..
What interesting is, when the price pierced through it, it quickly gone back up in a impulsive manner. Its usually a signal from the market that the bearish move is just a fake move to catch people on the wrong side of the market.
In addition, after this rejection the market has now forming what appear to like a bullish continuation flag pattern on H4 TF. This is enough sign for me that the market want to continue to the upside if it breaks this bullish flag.
I set a stop order entry on the break of this bullish flag structure, with sl below the flag. 1st target is 1.06800 with the break above that opening the potential of the price go to 1.07500 and even 1.10500.
Lets see how will this pair develop. Good Luck..
__________________________________________________________________________________________________________________________________________________________________
Here is the MOA FX technical analysis, please comment below if you have any question.
The ENTRY in the market will be taken only if the condition of the MOA Fx strategy will trigger.
__________________________________________________________________________________________________________________________________________________________________

AUDNZD - Falling wedgeWhen a security's price has been falling over time, a wedge pattern can occur just as the trend makes its final downward move. The trend lines drawn above the highs and below the lows on the price chart pattern can converge as the price slide loses momentum and buyers step in to slow the rate of decline. Before the lines converge, price may breakout above the upper trend line.
When price breaks the upper trend line the security is expected to reverse and trend higher.
Dear traders are looking for an entry point into the long


AUD/NZD Technical Analysis
The counter has been on a selling spree for the last 3 months.
Now, it has broken down a critical support level of 1.05620 and retested it, validating the breakdown.
Hence, we expect the pair to weaken further from here.


AUD/NZD BUY SIGNALHey tradomaniacs,
welcome to another free setup!
AUD/NZD: Daytrade-Execution
Market-Buy-Order: 1,05420
Stop-Loss: 1,05140
Target 1: 1,05690
Target 2: 1,05900
Target 3: 1,06260
Stop-Loss: 27 pips
Risk: 0,5%
Risk-Reward: 3,13
LEAVE A LIKE AND A COMMENT - I appreciate every support! =)
Peace and good trades
Irasor
Wanna see more? Don`t forget to follow me.
Any questions? PM me. :-)
