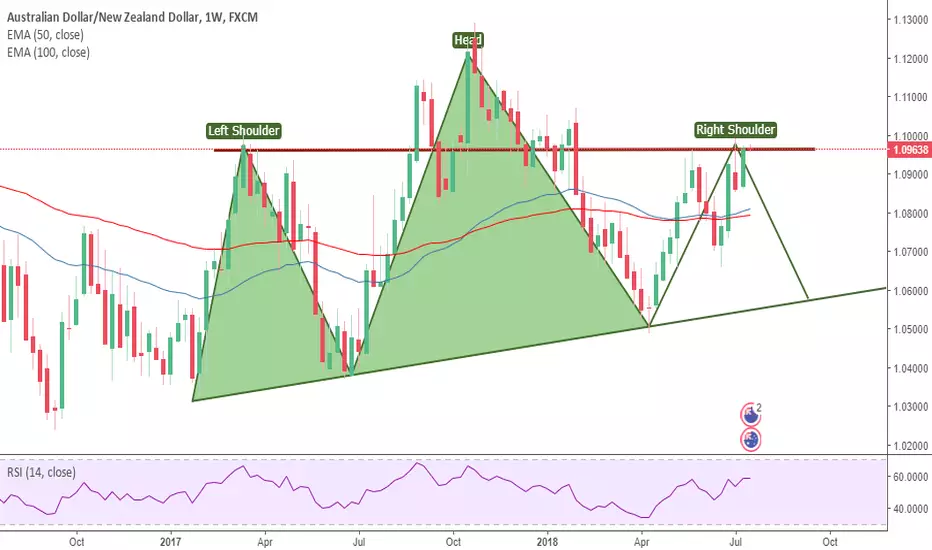
Possible Head & Shoulders Pattern on WEEKLYPossible formation of a head and shoulders pattern on the AUDNZD on weekly chart. Buying momentum decrease in lower time frames confirming resistance. Wait for proper sell signal on weekly to enter trade.
Audnzdforecast
AUDNZD bearish ideaIchimoku, SSRC, & heiken ashi all bearish, target 90 level from 45 level on Gann sqr9. Modest target 1.07132. Wait for one more bearish heiken ashi bar before entering.


AUD/NZD is looking for breakout on daily chart!!!I see bullish divergence(@macd) on daily chart and falling wedge.
Watch for breakout or buy in when we are on general support of AUD/NZD.
If we see bullish breakout from falling wedge in future days, this can be very profitable trade so please watch AUD/NZD carefully.
Have a nice day
Berk
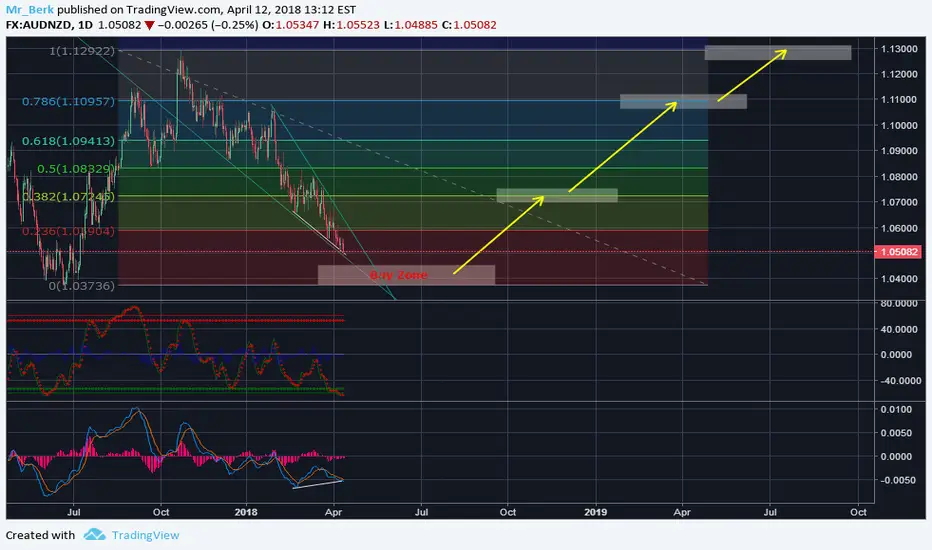
AUDNZD Continued DownTrend and Then Huge Possible BounceGetting close to major buy zone. Short term down trend followed by large move upwards.


AUDNZD Right On Major Resistance, Time To SellAUDNZD is at a good selling opportunity.
Sell below 1.0635. Stop loss at 1.0656. Take profit at 1.0562.
Reason for the trading strategy (technically):
Price is now testing major resistance at 1.0635 (Fibonacci retracement, Fibonacci extension, horizontal overlap resistance) and a strong reaction could occur at this level to push prices down to major support at 1.0595 (Fibonacci retracement, horizontal swing low support). We do have to be cautious of intermediate support at 1.0595 (Fibonacci retracement, horizontal overlap support) as price might bounce off there and only a break of that support would open a further drop.
Stochastic (34,5,3) is seeing strong resistance below 95% where a corresponding reaction could occur.

AUDNZD Testing Key Support, Prepare For A BounceAUDNZD is now testing a major support level which is a good buying opportunity.
Buy above 1.0551. Stop loss at 1.0474. Take profit at 1.0823.
Reason for the trading strategy (technically):
Price is now testing major support at 1.0551 (Fibonacci retracement, horizontal overlap support, Fibonacci extension, bullish harmonic formation) and a strong bounce could occur at this level to push prices up to at least 1.0823 resistance (Fibonacci retracement, horizontal overlap resistance).
Stochastic (34,5,3) is seeing major support above 2.5% where a corresponding bounce could occur.

AUDNZD, Return of the bulls ?In my view there is a possibility for reversal in price. Lets see how this will be behave. Please trade with care.

AUDNZD Is Right On Resistance, Time To SellAUDNZD is testing major resistance and presents us with a good opportunity to sell.
Sell below 1.0711. Stop loss at 1.0734. Take profit at 1.0656.
Reason for the trading strategy (technically):
Price is testing major resistance at 1.0711 (Fibonacci retracement, Fibonacci extension, horizontal overlap resistance) and a strong reaction could occur at this level to push prices down to 1.0656 support (Fibonacci extension, Fibonacci retracement, horizontal overlap support).
Stochastic (89,5,3) is seeing major resistance at 95% and a corresponding reaction could occur at this level.

AUDNZD testing strong resistance, prepare to sellAUDNZD is testing strong harmonic resistance and looks poised to drop from here.
Sell below 1.0797. Stop loss at 1.0833. Take profit at 1.0706.
Reason for the trading strategy (technically):
Price is testing major resistance at 1.0797 (Fibonacci extension, bearish harmonic formation) and a strong reaction could occur at this level to push price down towards 1.0706 support (Fibonacci retracement, horizontal swing low support). Our stop loss is at 1.0833 which is just above a major swing high and Fibonacci retracement to give our trading setup ample breathing space.
Stochastic (34,5,3) is seeing nice resistance at 93% where a corresponding drop could occur.

AUDNZD WedgePrice is forming a wedge on the 4 hour timeframe and I expect price to make another leg down before it breaks to the upside. The reversal is also supported by bullish divergence on the Awesome Oscillator.


AUDNZD Unexpected Bollinger Band SpikeHi traders,
A long wick has been left outside of the Bollinger Band, wonderful spike with the Bollinger Bands having the perfect angle. I entered the trade as soon as the candle closed with my profit target set at the 50% Fibonacci level. If the next candle goes against me, I will be closing the trade, otherwise I will put it to break-even. We have a slight divergence as well.
(This is not a trade recommendation!)


CORRECTIVE STRUCTURE IN AUDNZD - DAILYHey Traders,
Looking at this expanding corrective structure and thinking about selling it from this current flag or sell it from the top if market brakes it again.
-
Hey Traders,
Monitorizando esta estructura correctiva y pensando en vender desde a actual bandera o desde el tope si el mercado lo vuelve a romper.
Carlos

AUD/NZD 1H Chart: Breakout from symmetrical triangleAUD/NZD 1H Chart: Breakout from symmetrical triangle
In early hours of this trading session the currency exchange rate made a breakout from symmetrical triangle pattern amid the pressure from 55-, 100- and 200-hour SMAs. In result of this downfall the pair has formed a minor descending channel, which is should guide movement of the pair at least until release of data on the New Zealand Retail Sales. But publication of worse than expected figures is unlikely to change the overall trend, according to which the pair is expected to ultimately reach the lower support line of the dominant rising wedge formation. In case the pair bypasses the above moving averages, the subsequent surge should be neutralized by the upper trend-line of a medium-term descending channel.


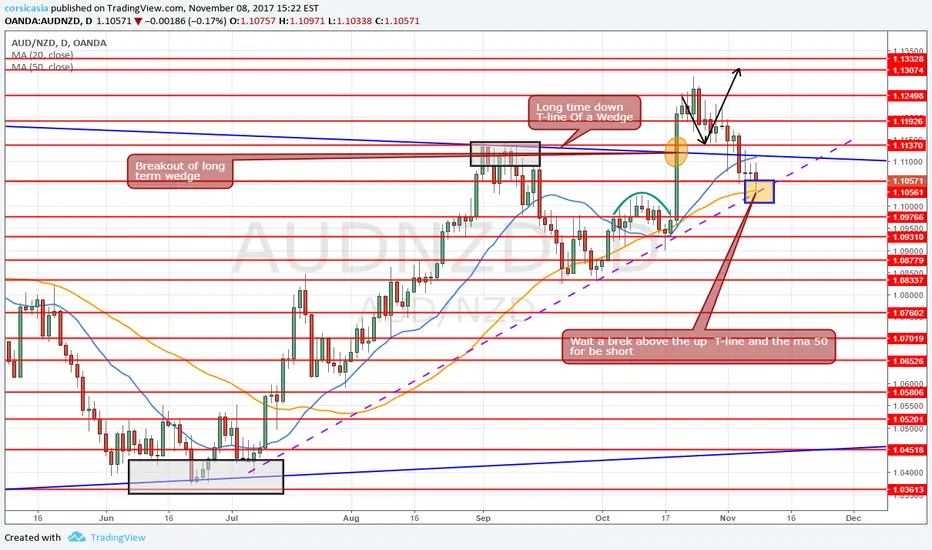
Daily setup idea swing tradingWait a brake above the 50me daimy and the up T-line in place since july 2017 for be short*
as the RBNZ become hawkish at her meeting and see rate hike in Q2 2019 vc previous Q3 2019 and uo in cpi forecast view