Forex Trading, AudNzd Analysis Don't Forget to Like and Subscribe our Youtube Channel
..................................
Forex Trade
AudNzd
Analysis Number 3
12 October 2020
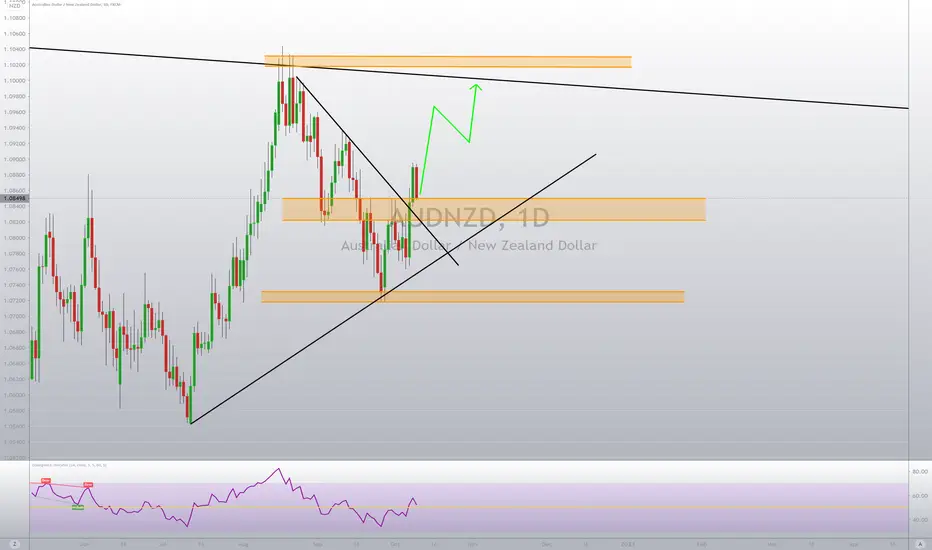
Bullish setups possible at the marked zones, price might make another move to the upside.
Audnzdlong

AUDNZD BULLISH ANALYSISHello Traders, here is the full analysis for this pair, let me know in the comment section below if you have any questions, the entry will be taken only if all rules of the strategies will be satisfied. I suggest you keep this pair on your watchlist and see if the rules of your strategy are satisfied

AUDNZD- BUY- OCTOBER 11
AUDNZD is looking good for a buy. Hoping we can get a rejection between 1.08300 - 1.08400.
Our first target will be 1.09300 which coincides with the -27 fib ratio.
PLEASE LIKE THIS IDEA
***
Here is the full analysis for this pair, let me know in the comment section below if you have any questions, the entry will be taken only if all rules of the strategies will be satisfied. I suggest you keep this pair on your watchlist and see if the rules of your strategy are satisfied.
Remember this analysis is not 100% accurate No single analysis is To make a decision follow your own thoughts.
***
The information given is not a Financial Advice.

AUDNZD Inverted Head & Shoulder Pattern Favor BullsThe AUDNZD 4hr chart above shows a classic inverted H&S pattern. Price also broke out of the long-term parallel channel and support & resistance level.
Price has the potential to retest the broken neckline as support and resumes a strong impulse move in wave (3) of iii.
Entry Criteria:
Buy from or below the current market price and put stop loss at the red level.
Wait for the breakout of the green line for conservative entry!
Regards,
Veejahbee.

Break of Major Trendline of AUDNZDMy AUDNZD analysis
1:3 RR
Currently waiting for retracement to finish
Please comment what you think! :)

AUDNZD Long Trade PlanHey traders, here is the analysis for the AUDNZD. NOTE - Please do your own analysis before taking the trade. Let me know if you guys have any questions in the comment section. If you guys like my analysis please hit like. Thanks.

AUDNZD , DAILY LONG TERM BUYIn the related idea analyst, I was expecting the price to follow its channel down to the support zone and bounce of it back to resistance.
We can see that the channel was broken and we see the trend breakout.
Looking at the chart on a bigger scale, we can see a new channel formating from 2 x higher heigh and 2 x lower lows.
The price is just about to break the resistance zone, once it does its a strong buy signal.

AUDNZD : Insane Analysis, don't loose 400 pips profit!Chart Description :
1. a major ascending channel which price is in the lower part of it.
2. a very strong resistance which price touched it recently and tried for breakout and failed till now.
3. a minor descending channel which you can have a better view of it in H4 time frame. Price recently reached the upper trend line of this channel.
4. 150 EMA which acts as support for the price base on history of price. We can use 100 MA too but EMA looks better.
5. RSI shows us a Trend line breakout , as you know RSI actually signal this event before it’s happening.
6. Most interesting thing in this chart is a Formed Bullish Flag which recently reached almost to 61.8% Fibbonacci retracement level of the flag pole. I did not include that retracement level in the chart.
7. a Fibonacci extension level of flag pole , flags usually reach 100% extension of the pole.
So as you can see situation is not that easy to analyze but most of our insights signaling us a bullish move to upside of the Major ascending channel.
This move confirms in one condition:
Price breaks the resistance with a strong candle and after a pullback we can be sure its gonna go that high.
If price broke the support below it we can consider another moves but it’s not that possible to happen.
**Trading Plan**
Entry point : long position confirms only if the price break the resistance and minor descending channel and close above them with a strong move , in this case we could wait for a pullback or not and just enter long.
You could also enter after the price retests the support one more time , it has a less probability and better R/R ratio.
Take Profit : bullish flag’s target is 100% extension of it’s pole but we have three key prices in our way to there. First we have 1.0000 which is a important psychological level, then we have last swing high which i prefer to call it our second tp and third one is a swing high in 2018.
TP#1 : 1.0000
TP#2 : 1.1000
TP#3 : 1.11600
TP#4 : 1.12000
Stop Loss : stop level is determined based on your trading strategy and entry point but if everything goes well as I predict our stop should be below strong resistance level.
Wait for further updates on this pair.
This was Full analysis of AUDNZD , please like if you found this idea interesting and let me know if you have any questions , comments or observations.
Let’s go and visit my last ideas, follow me for further ideas like this.
Thank you.

AUDNZD buyBuy opportunity after inverted H and S formation and nice reversal, wait for a correction and bounce


AUDNZD Possible Head And Shoulders Setupprice at right shoulder and now also bounced off right shoulder
will enter above breakout only.
Just watch the game and enjoy yourself in quarantine babe

Aud/Nzd (Waiting To Buy)Im waiting for the 8 hour entry on my new mechanical system I told you about weeks ago.
1. Im watching hour 8 on Oanda Charts. If you dont have Hour 8 , try watching the daily chart and using the 5 and 10 WMA instead of EMA.
2. Im using the 5 and 10 EMA on H8 and Heiken Ashi Green Candles. When I see green candles on H8 , im looking for the 5 and 10 EMA crossover.
3. When I get this, im opening the buy. I will open it very small because I know that price could just keep ranging over and over and over again before finally making its move!
Im expecting a wave up from here... my stop loss will be 75 to 100 pips and im trading at 0.01.

AUDNZD RoadmapAUDNZD potentially to go up by +150 pips if the buyer manages to push the price to the 1.0930 resistance level, unconfirmed inverted H&S was formed and we need for the price to breakout the resistance level 1 before placing any buy order.
**Disclaimer** the content on this analysis is subject to change at any time without notice, and is provided for the sole purpose of assisting traders to make independent investment decisions.
Traders!! if you like my ideas and do take the same trade as I do, please write it in a comment so we can manage the trade together.
_____________________________________________________________________________________________________________________
Thank you for your support ;)
GWBFX

AUDNZD finally to shift out of descending TL?AUDNZD has been a weird pair. Ultimate trend down, but stuck in a range for 7 years already, and no breakout in view. For now, I do see it go long, and potentially trap buyers, but we remain neutral on that for now.
Currently, I am eyeing an entry on H1, with the Corrective Pattern broken and potentially getting a retest now. Further confluences are as following:
-H1 Structure
-50%/61% fib retracement
-Breakout of H1 Corrective Pattern
-H4 bullish engulfing
-Seasonal Prime iextremely Bullish
Enter at your own risk and use proper risk management.

AUDNZD Trend prediction.
The price has created the trend channel heading towards the support zone where is expected to bounce back towards resistance.


Model Signal- AUD/NZD Buy: 1.0787The Ingenuity Trading Model is a Geometric Hidden Markov Model with specific inputs related to Price, Time, Volume, and Volatility.
Our Algorithmic Trading Model offers real-time buy or sell signals with specific entry and exit prices.


WE COULD HAVE A SELL ON AUD/NZD!!Price failed to respect the 4hr trendline after hitter a major resistance level at 1.10000. Price is continuing downward in the counter-trendline. We see that price broke the 1.08250 level and is now in the process of retesting it. We are waiting for a pattern or candlestick formation to form to place our trade. Tp set at 1.07500 because there are a lot of buy orders sitting within that zone due to a 50% Fibonacci line-up.


AUDNZD path and direction Possible breakout for AUDNZD wait for confirmation on lower time frame
Wait for monthly candle close above trend line
Possible divergence in making
