Audnzdsell
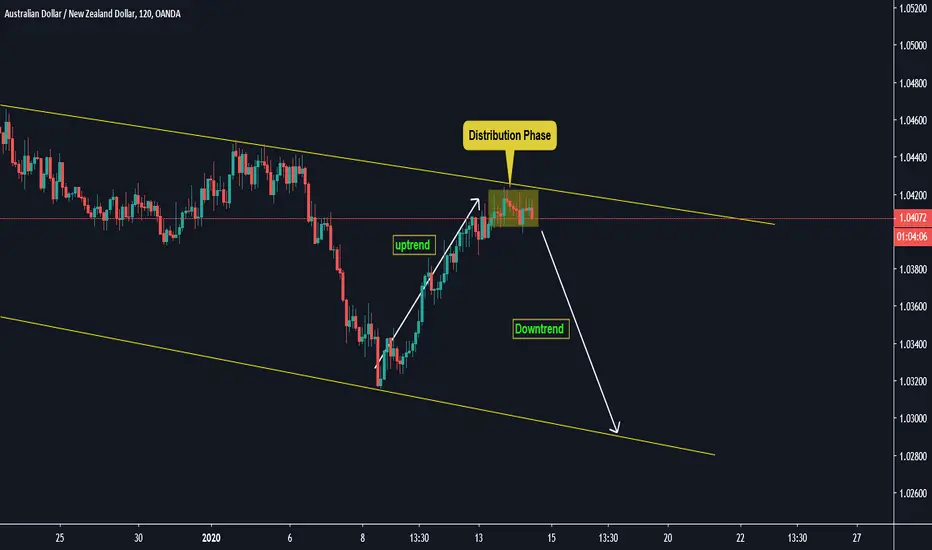
AUDNZD Complete Analysis: Both Long and Short OpportunitiesAUDNZD is trading in a bearish move for more than two months now after hitting multi-week high back in November.
Lately, AUDNZD has gained some strength and consolidating at the bottom of the structure.
From this area, two things are likely:
1) A strong impulse to the upside.
2) A final bearish move and strong upside.
Either way, swing traders should look for buys when price hits the bottom.
However, day traders can still sell as price is facing strong resistance in the 4H chart.
Based on this analysis, my recommendation is to:
1) Sell AUDNZD@1.0408-1.0420.
TP:1.0320
SL:1.0436
2) Buy AUDNZD@1.0280-1.0350
TP:1.0672
SL:1.0250


AUD/NZD correction outlookWe have a setup for AUD/NZD that could take about 2 weeks to be successful. Unless AUD looks for deeper bottoms, we have a high chance for the correction.
Entry: 1.043
Stop-Loss: 1.035
Target: 1.055

AUDNZD bounced from support, potential for a further rise!
AUDNZD bounced off 1.03930 where it could potentially rise further to 1.04828.
Trading CFDs on margin carries high risk.
Losses can exceed the initial investment so please ensure you fully
understand the risks.

AUDNZD potential reversal!
AUDNZD expected to rise up to 1st resistance at 1.04828 where it could potentially react off and drop down to 1st support at 1.03930.
Trading CFDs on margin carries high risk.
Losses can exceed the initial investment so please ensure you fully
understand the risks.


AUDNZD bounced from support, potential for a further rise!
AUDNZD bounced off 1.03930 where it could potentially rise further to 1.04828.
Trading CFDs on margin carries high risk.
Losses can exceed the initial investment so please ensure you fully
understand the risks.


AUDNZD: Next Move Possible.AUDNZD: Next Move Possible.
Note: This is only for Educational Purpose this is not Investment advice.


AUDNZD Potential shorts!Hey Guys, hope everyone doing Good,
I have a potential short setup on AUDNZD

AUDNZD - SELL NowAN is going down and if you see the chart and coming from upwards to downwards price has reached the 0.236 fibo level and retrace to upwards.
Price has crossed the 200 EMA as well and middle bollinger band is crossing the 50 EMA and moving top of the candles is confirming that price is moving down.
Once its crossed the 200 EMA price goes down till 0.236 fibo level
Note: Trade at your own risk.
twitter.com
www.facebook.com
www.instagram.com


AUDNZD Possibility of next MoveIn the name of Allah, the Most Gracious, the Most Merciful
AUDNZD Possibility of next Move.
Note: This is only for Educational purposes; this is not investment advice.
Thanks
Adil Khan.

AUDNZD Possibility of Next Move. In the name of Allah, the Most Gracious, the Most Merciful
AUDNZD Possibility of Next Move.
Note: This is only for Educational Purpose this is not Investment advice.
Thanks
Adil Khan.
