Audnzdsetup

AUDNZD Long Setup - Confluence on Multiple TimeframesThis research is for informational purposes and should not be construed as personal advice. Trading any financial market involves risk. Trading on leverage involves risk of losses greater than deposits.
Please comment below and Like if you agree with my analysis.

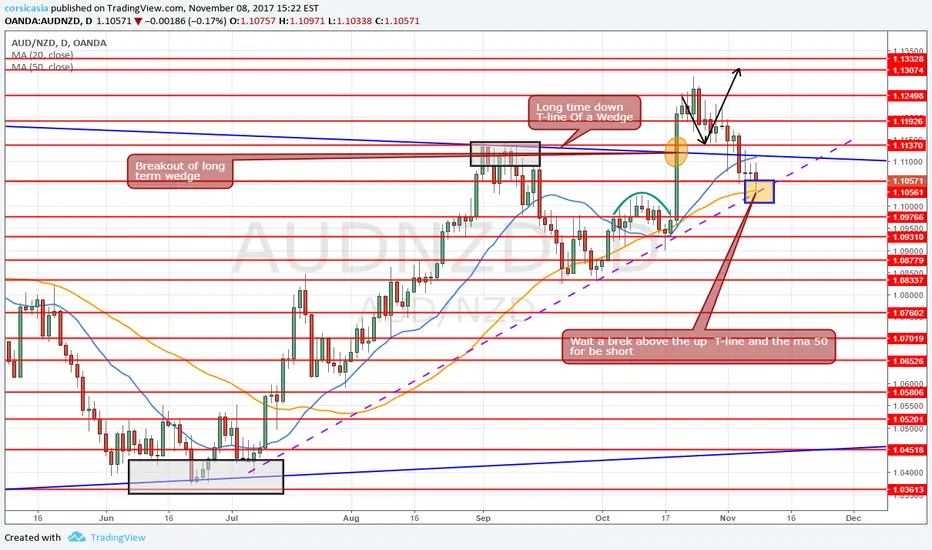
Daily setup idea swing tradingWait a brake above the 50me daimy and the up T-line in place since july 2017 for be short*
as the RBNZ become hawkish at her meeting and see rate hike in Q2 2019 vc previous Q3 2019 and uo in cpi forecast view
AUDNZD - Short Term Selling SetupHI everyone, Sell AUDNZD now to get a short term selling setup. It's currently roaming around the upper trend line of the channel after strong impulsive move. Correction now yet to come to better is to sell the pair now thanks

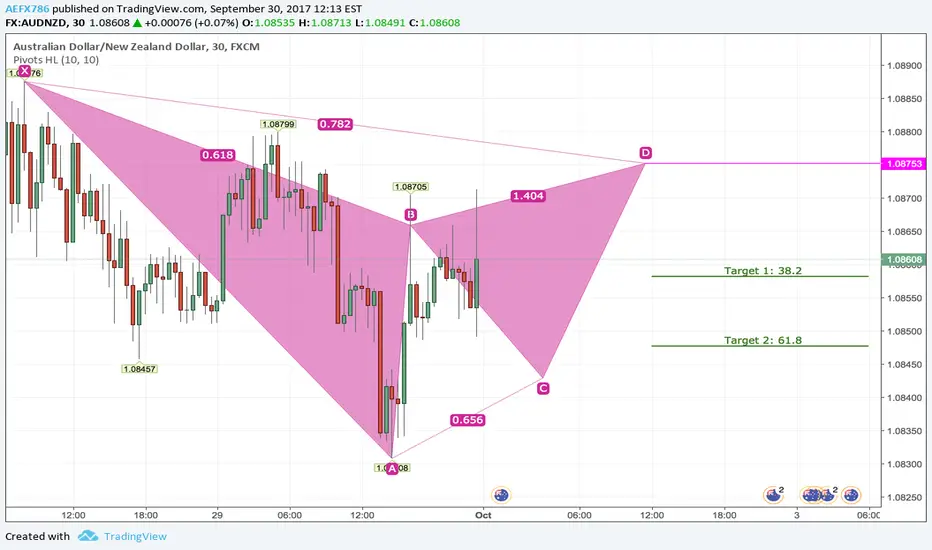
Sell AUDNZD Based on Bearish Harmonic GartleyThis research is for informational purposes and should not be construed as personal advice. Trading any financial market involves risk. Trading on leverage involves risk of losses greater than deposits.
Please comment below and Like if you agree with my analysis.
Quick Profit AUDNZDAUDNZD Looking for a bounce from here to the 108 levels if the line holds. Quick profit here!!

AUDNZD short (depends on NZD rate decision)i see this possible trade but we need to wait till wednesday... maybe NZD rate decision can give us this movement... tradesafe

short AUDNZDWith RBA tomorrow Audnzd seems to have retraced all of its earlier losses from Asian trading. Selling here AT 1.0657 with a 30 pip stop makes a good RR before RBA tomorrow.They are definitely not going to be pleased with aussie strength tomorrow.

AUDNZD Buy OpportunityBullish Bat Pattern completion with Reverse Head & Shoulders Pattern Completion on Bat Pattern's D Point.
Price already broke above 50EMA and we enter positions upon break above 100EMA.

Long AUDNZD Longterm Based on Weekly + 1D Charts for 400+ Pips!!In an ideal world, the AUDNZD would continue another wave of the uptrend and close above 1.10198.
Excuse my purple arrows lol they are for my reference of some S+R that I want to keep an eye on...
On the Weekly, we've been making lower lows since the 6th of April 2015.
More recently on the Daily chart, we've been making Higher Highs and Lower Lows since the 14th of September 2016
We can see clearly on the Weekly chart that price has found + respected resistance on the EMA200 line.
The EMA200 has now dropped below the last higher high, which was recorded on the 13th of March 2017 at 1.10027.
We can see the EMA200, on it's current course is set to be around 1.09170 when we approach our target and so that's our TP.
Stochs has just come out of oversold and our MACD indicator is preparing to complete a bullish crossover on the Daily chart.
We enter low, close to the trend line to minimise risk.
This research is for informational purposes and should not be construed as personal advice. Trading any financial market involves risk. Trading on leverage involves risk of losses greater than deposits.
Please comment below and Like if you agree with my analysis.

A pair not ideal to trade, but in a channel nonethelessAs what the Idea title states, this pair is actually not an ideal pair to enter a trade. As you can see the current level this pair is at, the market is messy thus making it risky to enter.

AUDNZD trend has been changed at 1h time frame.AUDNZD short. This is my view on the market not a signal for you. Do your own analysis before entry.

Is AUDNZD possible??!Hi traders,
AUD is currently known at a very high area and it is resistance area too! However, I am going to do a long trade due to my setup. It formed a pinbar at support and trendline.
If the price broke below 1.0920 (SL), we may do a short position on this pairing.
Long:
SL: 1.0920
TP: 1.1040
Short: Follow blue arrow
If you like my idea, please follow my account to get more ideas in future!
Thank you and feel free to exchange your idea with me.
**Trade with care**
