Potential 100 pip Grab on AUDNZDBearish Wall Run YUp Pattern on AUDNZD. I wanted confirmation to take a short position here, I got one. SO in I go. My last call on GBPUSD made 232 pips. I love it! OANDA:AUDNZD
Audnzdshort

Fri 15th Oct 2021 Daily Forex Charts : 3x New Trade SetupsLooking at the Daily Forex charts and using the High Probability & Divergence methods from my books, there were 3x new trade setups identified today. Just be careful of correlation though as the NZD is involved in all 3x trades. Enjoy the weekend all. Cheers.

FOREX ANALYSIS : AUDNZDFX:AUDNZD
The blue and red lines mean: I think prices can return in these areas.
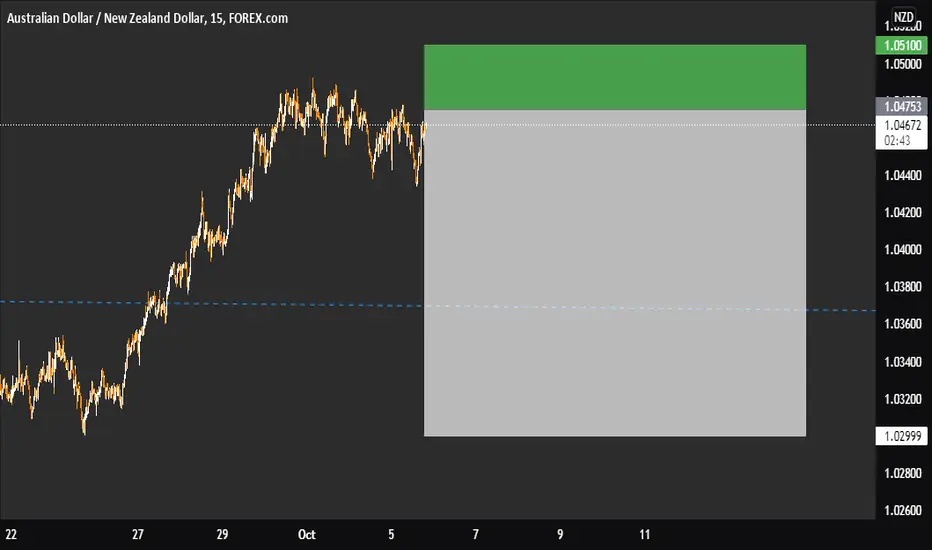
Green lines mean: I think the price can reach these areas. They are therefore known as transaction targets.
If you want to use this deal, please risk only one percent of your account balance.

audnzd.....1h# Inside a major bearish price channel _ blue
# Inside an ascending sub-green channel
# A second descending sub-channel_orange has been broken
# Currently targeting = 1.04823,,,, breaking 1.04686 = touching the green trend at the bottom

AUDNZD has brokebn the support on 4H ChartAUDNZD got rejected from weekly resistance, also broke the uptrend line and now the support short on retest with good risk reward ratio

AUDNZDBullish Indicators:
1) HH HL
2) Support zone at 1.05491 Fib level 50.00%
3) Uptrend/Ascending channel
Bearish Indicators:
1) Resistance zone at 1.06132 Fib level 61.80%
2) Breaking of lower trendline
Plan A: One can take a long position on the bounce from the support level 1.05491 Fib level 50.00%.
Plan B: One can take a short position on the breaking of lower trendline for the target of 1.04854.

AUDNZD Symmetry Swing Set UpAUDNZD has seen an impressive bounce from our 1.0330 reversal zone. Focus now shifts to descending trend line resistance, the current equality objective and monthly projected range resistance. Look for bearish reversal patterns at 1.0640/1.07 to set Shortt positions initially targeting a retest of 1.05 and then 1.04 in extension

H1-H4 AUDNZD SHORT BASED on H1-H4 chart AUDNZD at resistance level. Possible correction to 1.0510 zone.
Trade wisely.

AUD/NZD: PRICE ACTION | SELL LIMIT SETUP..Welcome back Traders, Investors, and Community!
Check the Links on BIO and If you LIKE this analysis, Please support our Idea by hitting the LIKE 👍 button
Traders, if you like this idea or have your own opinion about it, please write your own in the comment box . We will be glad for this.
Feel free to request any pair/instrument analysis or ask any questions in the comment section below.
Have a Good Day Trading !

In my opinion, this currency pair has the potential to declineGiven the index of these currencies as well as the important levels of resistance, I have a sales attitude in two areas

AUDNZD 15MIN TIMEFRAME ANALYSIS SELLWe consider selling this AUDNZD pair because of a strong resistance above. We know what we are doing and we do what the market is doing. This is more than an institutional analysis. Invest wisely. Thank you for following me on tradingview .
AUDNZD SellThis is my idea on AUDNZD pair.
Pattern: Bearish Crab
What do you guys think?
Good Luck Everyone.

AUDNZD top-down analysisHello traders, this is the full breakdown of this pair. We will take this trade if all the conditions are satisfied as discussed in the analysis. Smash the like button if you find value in this analysis and drop a comment if you have any questions or let me know which pair to cover in my next analysis.

Looking for Short TradeHi Everyone,
After the rotation in the channel we arrive to the resistence level & Top of the Bearish Channel with the indicator in the area of overbuy.
1) First I look a Breakout of the bullish Channel.
2) I want to see any signal, in the indicators to get in.
Then I trade as usual 1% Risk. 0.5% for the entry and another 0.5% with a Stoploss ATR Daily.
Goodbye & Good Trading!!!

H1-H4 AUDNZD SHORT BASED on H1-H4 chart AUD/NZD has reached resistance and we have an upcoming correction to 1.04-1.042 price range. After the correction price will continue uptrend .
Not a trading advice.
Trade wisely.

Short AUDNZD AUDNZD has approached Weekly resistance level , Short on Break of TL and re test of Support

Butterfly CompletedButterfly completed, has broken all previous highs (Monthly, weekly etc) Possible short near the 0.04000 level, strong resistance and imbalance.

AUDNZD Trade Idea in small time frameAs expected AUNZD is broken down to bear flag and retesting broke out level and forming a bearish pattern. It would be a good entry after a break down to bearish pattern in the small time frame.


AUDNZD MORE BLOOD INCOMING4 factors of taking a short trade:
1. Price is on a downward trend
2. pull back correction which creates a channel (bearish flag)
3. Price is at the top of the channel which has a 90% rule of going to the bottom of structure after breaking out
4. Price is at an area of resistance on the 4hr charts

Trade idea - AUDNZD Sell opportunityAUDNZD looks really beaten amidst all the volatility in the last 2 weeks. Its sharp rise to 1.0500 was quickly punctured with the strong NZD demand.
Currently at 1.0350, we prefer not to find the trend and sell with TP below 1.0300 upto 1.0250.

AUDNZD SELL- BAT PATTERNAUDNZD is expected to sell to complete the Bat pattern at point D
WE SELL ALL BUY RETRACEMENTS on lower time frame
FOLLOW US FOR MORE UPDATES

audnzdaudnzd to test 1.04049 zone, audznd has been moving slowly recently, i expect it to go low and test 1.04049 zone.
