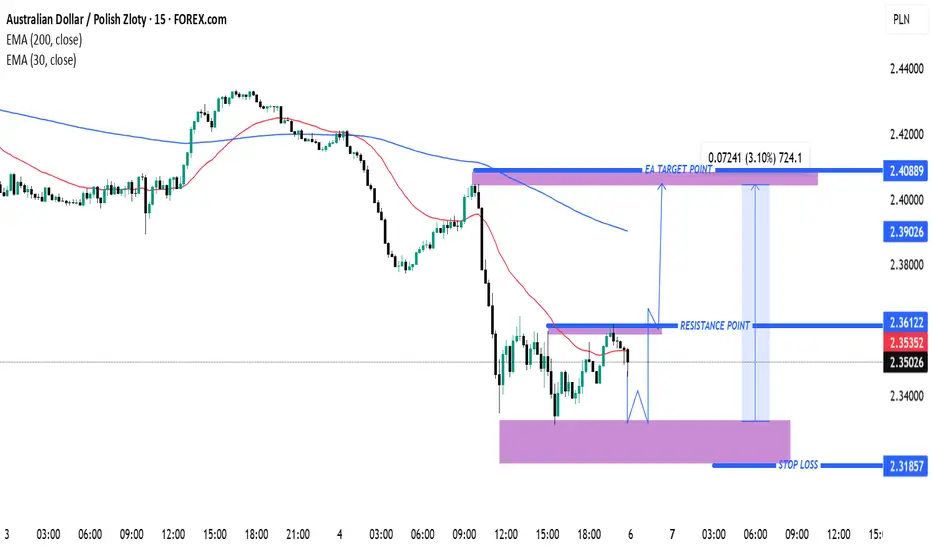
AUD/PLN Bullish Reversal Setup – Buy from Demand Zone Toward 200EMA 30 (Red): 2.35352
EMA 200 (Blue): 2.39026
🧠 Trade Setup: Potential Long Opportunity
📍 Current Price: 2.35026
📌 Key Levels:
Entry Zone (Demand Zone): Around 2.31857 – 2.34500
Strong historical support (highlighted in purple).
Market is expected to pull back here before bouncing.
Stop Loss: 2.31857
Placed below the demand zone to avoid false breakouts.
Resistance Point (Initial Obstacle): 2.36122
Short-term resistance where price previously rejected.
EA Target Point (Main Take Profit): 2.40889
Aligned with a major resistance + 200 EMA.
Also the top of a prior consolidation zone.
⚖️ Risk-to-Reward Breakdown:
Risk: ~317 pips
Reward: ~724 pips
R:R Ratio: ~2.3:1 — Favorable for intraday-to-short-term swing setups.
🔍 Market Insights:
Price has dropped sharply and is consolidating near a support area.
The 200 EMA overhead is sloping downward — signifying overall bearish pressure, but short-term correction is possible.
A bounce from the demand zone could lead to a bullish retracement.
Audplnanalysis
AUD/PLN Technical Analysis: Potential Reversal from Resistance ZThis is a technical analysis chart of the Australian Dollar (AUD) against the Polish Zloty (PLN) on a 30-minute timeframe from TradingView. Here are the key observations:
1. Resistance Zone (Purple Box at the Top):
The price is approaching a key resistance area around 2.4350 - 2.4450.
This zone has previously acted as resistance, suggesting a potential price reversal.
2. Exponential Moving Averages (EMA):
The 200 EMA (Blue Line) at 2.42878 and the 30 EMA (Red Line) at 2.42619 indicate trend direction.
Price is currently testing the 200 EMA, which can act as a dynamic resistance.
3. Projected Price Action (Blue Path):
The analyst expects the price to reject the resistance zone and move downward.
A possible bearish movement is indicated towards the targ

AUD/PLN Technical Analysis – Reversal Opportunity AUD/PLN Chart Analysis (1H) on TradingView 📊 🔴 Overall Trend: ➡️ The price is following a bearish trend 📉, trading below the 200 EMA (🔵 2.45308) and the 30 EMA (🔴 2.43309). ➡️ The market is showing selling pressure, but the price has reached a key support zone 🟣. 🟣 Support Zone (Possible Reversal) 🔵 Potential Entry: 📍 2.41633 (inside the support zone) 🔵 Stop Loss: ❌ 2.40157 (below support) 🔵 Take Profit: ✅ 2.46072 (near resistance and the 200 EMA) 📈 Movement Projection: 🔹 An upward movement of 1.82% 🚀 (0.04389 points) is expected. 🔹 To confirm the uptrend, the price must break above the 30 EMA 🔴 and the 200 EMA 🔵. 💡 Conclusion: 🔸 The chart suggests a buy strategy in the support zone with a target at the resistance. 🔸 If the price breaks the support, it could continue its decline 🚨.
