AUDUSD bullish sideways consolidation supported at 0.6355AUDUSD maintains a bullish bias, supported by the prevailing upward trend. Recent intraday movement indicates a corrective pullback toward a key consolidation zone, offering a potential setup for trend continuation.
Key Support Level: 0.6355 – previous consolidation range and pivotal support
Upside Targets:
0.6470 – initial resistance
0.6500 and 0.6550 – extended bullish targets on higher timeframes
A bullish breakout from 0.6355 would suggest continuation of the uptrend, confirming buying momentum.
However, a decisive reversal and daily close below 0.6355 would invalidate the bullish structure, opening the door for further retracement toward 0.6310, with additional support at 0.6235 and 0.6195.
Conclusion
AUDUSD remains bullish above 0.6355. A bounce from this level supports further gains. Traders should watch for confirmation signals before positioning for the next move.
This communication is for informational purposes only and should not be viewed as any form of recommendation as to a particular course of action or as investment advice. It is not intended as an offer or solicitation for the purchase or sale of any financial instrument or as an official confirmation of any transaction. Opinions, estimates and assumptions expressed herein are made as of the date of this communication and are subject to change without notice. This communication has been prepared based upon information, including market prices, data and other information, believed to be reliable; however, Trade Nation does not warrant its completeness or accuracy. All market prices and market data contained in or attached to this communication are indicative and subject to change without notice.
AUDUSD

AUDUSD Massive Short! SELL!
My dear friends,
My technical analysis for AUDUSD is below:
The market is trading on 0.6454 pivot level.
Bias - Bearish
Technical Indicators: Both Super Trend & Pivot HL indicate a highly probable Bearish continuation.
Target - 0.6420
About Used Indicators:
A pivot point is a technical analysis indicator, or calculations, used to determine the overall trend of the market over different time frames.
Disclosure: I am part of Trade Nation's Influencer program and receive a monthly fee for using their TradingView charts in my analysis.
———————————
WISH YOU ALL LUCK

Could the Aussie bounce from here?The price is falling towards the support level which is a pullback support that lines up with the 71% Fibonacci retracement and the 78.6% Fibonacci projection and could bounce from this level to our take profit.
Entry: 0.6386
Why we like it:
There is a pullback support level that lines up with the 71% Fibonacci retracement and the 78.6% Fibonacci projection.
Stop loss: 0.6356
Why we like it:
There is a pullback support level.
Take profit: 0.6436
Why we like it:
There is a pullback resistance level.
Enjoying your TradingView experience? Review us!
Please be advised that the information presented on TradingView is provided to Vantage (‘Vantage Global Limited’, ‘we’) by a third-party provider (‘Everest Fortune Group’). Please be reminded that you are solely responsible for the trading decisions on your account. There is a very high degree of risk involved in trading. Any information and/or content is intended entirely for research, educational and informational purposes only and does not constitute investment or consultation advice or investment strategy. The information is not tailored to the investment needs of any specific person and therefore does not involve a consideration of any of the investment objectives, financial situation or needs of any viewer that may receive it. Kindly also note that past performance is not a reliable indicator of future results. Actual results may differ materially from those anticipated in forward-looking or past performance statements. We assume no liability as to the accuracy or completeness of any of the information and/or content provided herein and the Company cannot be held responsible for any omission, mistake nor for any loss or damage including without limitation to any loss of profit which may arise from reliance on any information supplied by Everest Fortune Group.

AUD/USD 4H | Wave 2 Pullback in MotionAUD/USD is currently completing a corrective Wave (2) within a larger impulsive structure. After the peak of Wave (1) at 0.65145, price has been in a healthy retracement phase, now nearing key fib confluence zones.
🟣 EMA Confluence:
Price is reacting near the 100 & 200 EMA (0.6373–0.6394), which has acted as dynamic support throughout this structure.
We are currently holding above the 0.382 level, with the golden zone (0.618–0.705) sitting just below.
🔄 Bullish Continuation Scenario:
If the pair holds above 0.6285 and we see bullish confirmation candles, we may begin the next leg higher — Wave (3) — targeting 0.66250–0.66766 as initial projection zones.
📊 RSI:
The RSI is hovering just below the 50 level, showing temporary bearish pressure, but has room to recover if structure holds.
🧠 Plan:
📍 Watching 0.6285–0.6214 for final support
📍 Wave (3) target zone: 0.66500+
📍 Invalidation: Clean break and close below 0.6015
🔔 Wave (2) entries are where the patient traders shine. Eyes on structure, and let price do the heavy lifting.
@WrightWayInvestments
@WrightWayInvestments
@WrightWayInvestments

AUDUSD Is Very Bullish! Buy!
Take a look at our analysis for AUDUSD.
Time Frame: 1D
Current Trend: Bullish
Sentiment: Oversold (based on 7-period RSI)
Forecast: Bullish
The market is testing a major horizontal structure 0.641.
Taking into consideration the structure & trend analysis, I believe that the market will reach 0.655 level soon.
P.S
Overbought describes a period of time where there has been a significant and consistent upward move in price over a period of time without much pullback.
Disclosure: I am part of Trade Nation's Influencer program and receive a monthly fee for using their TradingView charts in my analysis.
Like and subscribe and comment my ideas if you enjoy them!

USD/JPY : More Bullish Move Ahead ? (READ THE CAPTION)By analyzing the USD/JPY chart on the daily timeframe, we can see that the price moved exactly as expected — first correcting down to the 142.5 area, and then rallying strongly to hit the 146.2 target. Currently, this pair is trading around 145.2, and if the price can hold above 145, we can still expect further upside movement on USDJPY. The next potential targets are 148.7 and 150 respectively. This analysis will be updated. The total return of this analysis so far has been over 720 pips!
Please support me with your likes and comments to motivate me to share more analysis with you and share your opinion about the possible trend of this chart with me !
Best Regards , Arman Shaban

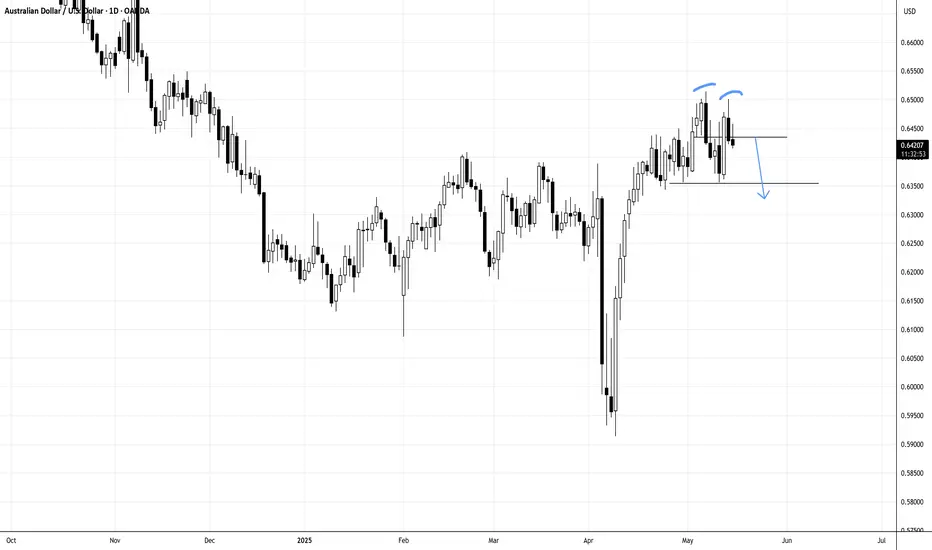
AUDUSD IN DOUBLE TOP, MAY REVERT TO ITS MEAN...AUDUSD
N.B!
- AUDUSD price might not follow the drawn lines . Actual price movements may likely differ from the forecast.
- Let emotions and sentiments work for you
- ALWAYS Use Proper Risk Management In Your Trades
#audusd
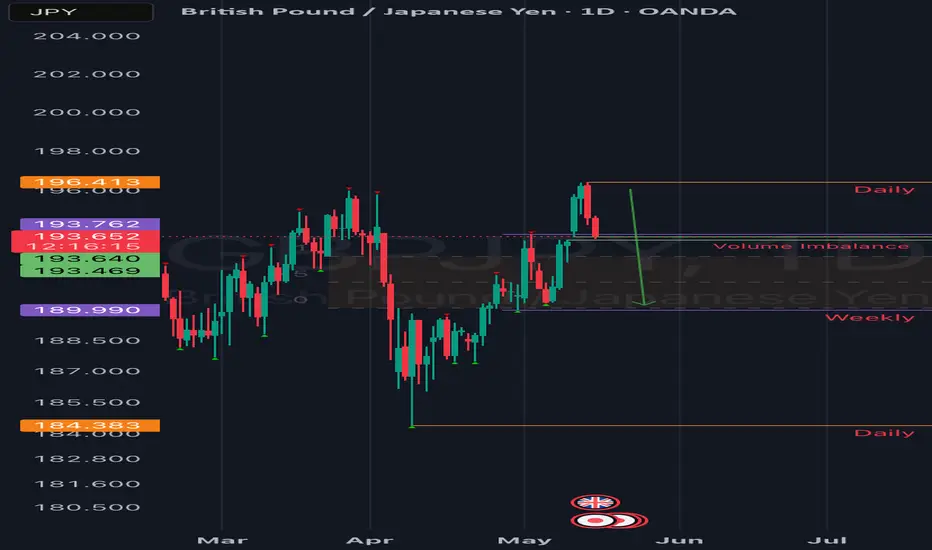
GBPJPY( British pound my banker!)Good day traders, I’m back with another idea on GbPJPY but this one is based on the strength and weakness of the pound itself. Before you ask what I mean…on this respective TF we had a break of structure higher(strength) but we saw price immediately move lower showing some weakness in price.
For the rest of the London session we can expect price to move higher on that volume imbalance to start the New York session. The rectangle is a balanced price range.
GBPUSD inverted FVG update!!Good day traders, we back again we an update on the setup on GBpUSD that I posted.
Coming into this week on Monday we show a very strong push lower and it was anticipated for Thursday and Friday that move but because the narrative still holds and we saw price fail to close about the midpoint of the inverted FVG. Price did not only reject that level once but multiple times, price than moved away from the Inverted FVG.
The green arrow shows a balanced price range that we wanna see price revisit and break past, but remember price do not move in a straight line so monitor minor reversals that can really do damage. On the 4H TF we saw break structure lower and that leg has a lot of imbalances in them!! But overall bias we bearish on GBPUsD

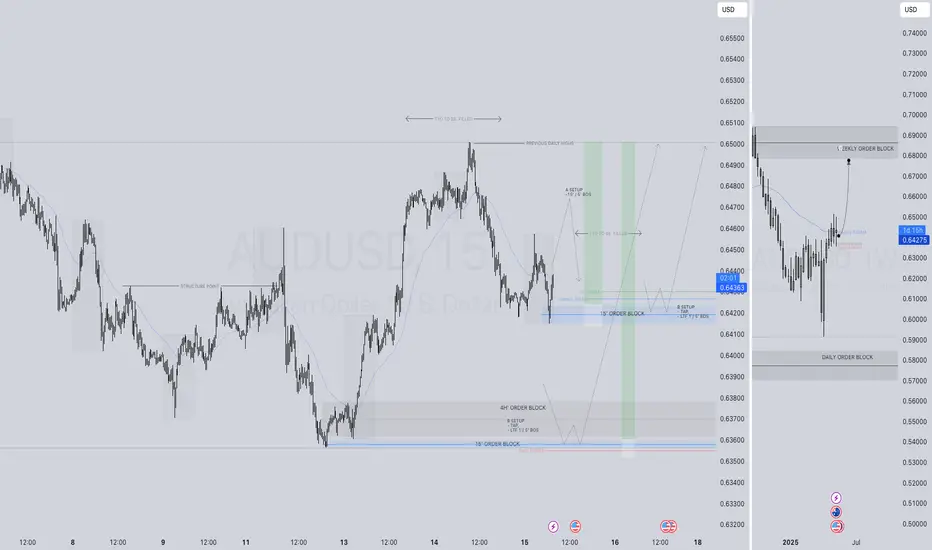
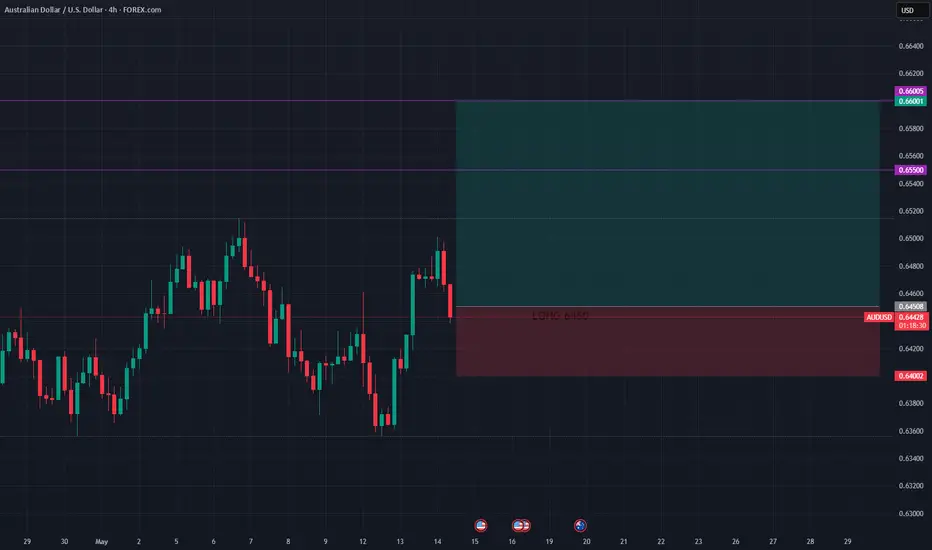
AUDUSD LONG FORECAST Q2 W20 D15 Y25AUDUSD LONG FORECAST Q2 W20 D15 Y25
Professional Risk Managers👋
Welcome back to another FRGNT chart update📈
Diving into some Forex setups using predominantly higher time frame order blocks alongside confirmation breaks of structure.
Let’s see what price action is telling us today!
💡Here are some trade confluences📝
✅Daily order block rejection
✅15’ order block identified
✅Tokyo ranges to be filled
✅Intraday bullish breaks of structure to be confirmed
🔑 Remember, to participate in trading comes always with a degree of risk, therefore as professional risk managers it remains vital that we stick to our risk management plan as well as our trading strategies.
📈The rest, we leave to the balance of probabilities.
💡Fail to plan. Plan to fail.
🏆It has always been that simple.
❤️Good luck with your trading journey, I shall see you at the very top.
🎯Trade consistent, FRGNT X
Bearish drop off pullback resistance?The Aussie (AUD/USD) is rising towards the pivot, which aligns with the 50% Fibonacci retracement, and could reverse to the 1st support.
Pivot: 0.6460
1st Support: 0.6399
1st Resistance: 0.6491
Risk Warning:
Trading Forex and CFDs carries a high level of risk to your capital and you should only trade with money you can afford to lose. Trading Forex and CFDs may not be suitable for all investors, so please ensure that you fully understand the risks involved and seek independent advice if necessary.
Disclaimer:
The above opinions given constitute general market commentary, and do not constitute the opinion or advice of IC Markets or any form of personal or investment advice.
Any opinions, news, research, analyses, prices, other information, or links to third-party sites contained on this website are provided on an "as-is" basis, are intended only to be informative, is not an advice nor a recommendation, nor research, or a record of our trading prices, or an offer of, or solicitation for a transaction in any financial instrument and thus should not be treated as such. The information provided does not involve any specific investment objectives, financial situation and needs of any specific person who may receive it. Please be aware, that past performance is not a reliable indicator of future performance and/or results. Past Performance or Forward-looking scenarios based upon the reasonable beliefs of the third-party provider are not a guarantee of future performance. Actual results may differ materially from those anticipated in forward-looking or past performance statements. IC Markets makes no representation or warranty and assumes no liability as to the accuracy or completeness of the information provided, nor any loss arising from any investment based on a recommendation, forecast or any information supplied by any third-party.

Australian dollar loses ground, jobs report nextThe Australian dollar has declined on Wednesday. In the North American session, AUD/USD is trading at 0.6441, down 0.45% on the day. This follows the Australian dollar's massive gains of 1.5% a day earlier.
Australia's wage growth accelerated in the first quarter. Annually, the Wage Price index gained 3.4%, up from 3.2% in Q4 2024 and above the market estimate of 3.2%. The gain was driven by stronger wage growth in the public sector. On a quarterly basis, wage growth rose 0.9% q/q, up from 0.7% and above the market estimate of 0.8%. This is the first time since Q2 2024 that annual wage growth has accelerated.
The higher-than-expected wage report comes before next week's Reserve Bank of Australia's rate decision. Currently, it looks like a coin toss as to whether the Reserve Bank will maintain or lower rates.
Australia releases employment data on Thursday. Employment change is expected to ease to 20 thousand in April, down from 32.2 thousand in March. The unemployment rate is expected to remain at 4.1%. The labor market has been cooling and if it continues to deteriorate, there will be pressure on the Reserve Bank to lower rates.
At last week's Federal Reserve meeting, Fed Chair Powell said that he would take a wait-and-see attitude in its rate policy. Trump's erratic tariff policy must be frustrating for the Fed, as it makes it difficult to make reliable growth and inflation forecasts.
This week's surprise announcement of a tariff deal between the US and China is a case in point at Trump's zig-zag trade policy. The two sides have been engaged in a bruising trade war and slapped massive tariffs on each other's products. Suddenly, the tariffs were slashed, leading to a sigh of relief in the financial markets. The deal is only for 90 days, and what happens then is very much up in the air.
AUDUSD Still on the Bullish Leg of its 3-year Channel Down.The AUDUSD pair has been trading within a Channel Down since the August 08 2022 High and is currently testing the 1W MA50 (blue trend-line) as a Resistance. This is a big Resistance cluster as it also made contact with the Pivot trend-line from the pattern's first Low.
However, all Lower Highs of the Channel Down have been priced above its 1W MA50, with three Tops forming on the 1W MA200 (orange trend-line). As a result, we expect a few more months of uptrend on this Bullish Leg until it approaches the 1W MA200. Our Target is 0.67000.
-------------------------------------------------------------------------------
** Please LIKE 👍, FOLLOW ✅, SHARE 🙌 and COMMENT ✍ if you enjoy this idea! Also share your ideas and charts in the comments section below! This is best way to keep it relevant, support us, keep the content here free and allow the idea to reach as many people as possible. **
-------------------------------------------------------------------------------
💸💸💸💸💸💸
👇 👇 👇 👇 👇 👇

AUDUSD..LONG
Analysis complete — scenarios outlined. The zone could be a decision point
for [ OANDA:AUDUSD ]. Price reaction here may define the next move.
**** If price breaks and pulls back to retest, a reversal setup might emerge.
Smart Forex Analysis | Weekly Setups
Clean charts. No noise. Just levels.

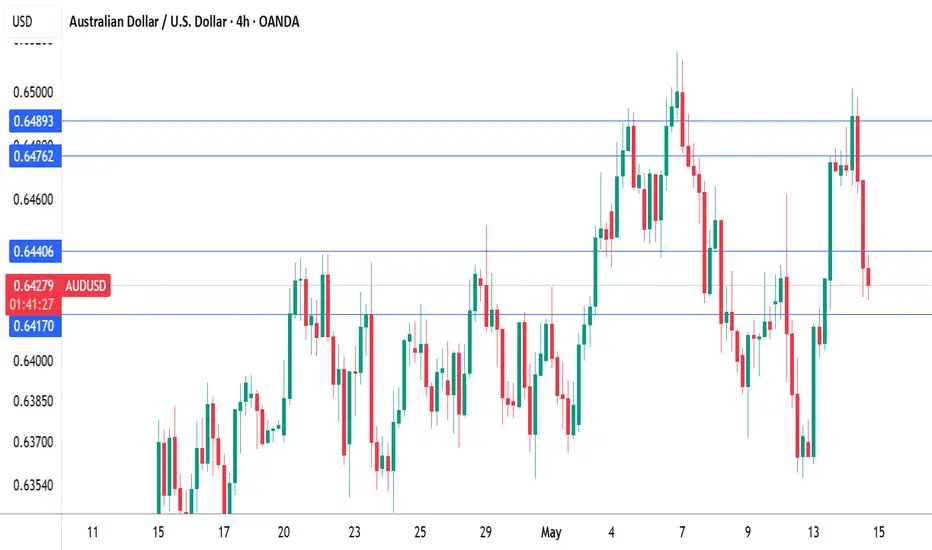
AUDUSD H4 I Bullish ContinuationBased on the H4 chart analysis, the price could fall toward our buy entry level at 0.6433 a pullback support.
Our take profit is set at 0.6515, a swing high resistance.
The stop loss is placed at 0.6354, below a swing low support.
High Risk Investment Warning
Trading Forex/CFDs on margin carries a high level of risk and may not be suitable for all investors. Leverage can work against you.
Stratos Markets Limited (tradu.com):
CFDs are complex instruments and come with a high risk of losing money rapidly due to leverage. 63% of retail investor accounts lose money when trading CFDs with this provider. You should consider whether you understand how CFDs work and whether you can afford to take the high risk of losing your money.
Stratos Europe Ltd (tradu.com):
CFDs are complex instruments and come with a high risk of losing money rapidly due to leverage. 63% of retail investor accounts lose money when trading CFDs with this provider. You should consider whether you understand how CFDs work and whether you can afford to take the high risk of losing your money.
Stratos Global LLC (tradu.com):
Losses can exceed deposits.
Please be advised that the information presented on TradingView is provided to Tradu (‘Company’, ‘we’) by a third-party provider (‘TFA Global Pte Ltd’). Please be reminded that you are solely responsible for the trading decisions on your account. There is a very high degree of risk involved in trading. Any information and/or content is intended entirely for research, educational and informational purposes only and does not constitute investment or consultation advice or investment strategy. The information is not tailored to the investment needs of any specific person and therefore does not involve a consideration of any of the investment objectives, financial situation or needs of any viewer that may receive it. Kindly also note that past performance is not a reliable indicator of future results. Actual results may differ materially from those anticipated in forward-looking or past performance statements. We assume no liability as to the accuracy or completeness of any of the information and/or content provided herein and the Company cannot be held responsible for any omission, mistake nor for any loss or damage including without limitation to any loss of profit which may arise from reliance on any information supplied by TFA Global Pte Ltd.
The speaker(s) is neither an employee, agent nor representative of Tradu and is therefore acting independently. The opinions given are their own, constitute general market commentary, and do not constitute the opinion or advice of Tradu or any form of personal or investment advice. Tradu neither endorses nor guarantees offerings of third-party speakers, nor is Tradu responsible for the content, veracity or opinions of third-party speakers, presenters or participants.

Nasdaq 100 set for 25k?The Nasdaq 100 is in a technical bull market, having rebounded 20% from its cycle low. While the risk remains that this is simply a 'bear market bounce' that could sucker punch bulls, I believe bulls have got this and we could be headed for 25k.
Matt Simpson, Market Analyst at City Index and Forex.com

AUDUSD(20250514)Today's AnalysisMarket news:
The U.S. unadjusted CPI annual rate unexpectedly dropped to 2.3% in April, the lowest since February 2021.
Technical analysis:
Today's buying and selling boundaries:
0.6435
Support and resistance levels:
0.6552
0.6508
0.6480
0.6390
0.6362
0.6318
Trading strategy:
If the price breaks through 0.6480, consider buying, the first target price is 0.6508
If the price breaks through 0.6435, consider selling, the first target price is 0.6390

Bullish momentum to extend?The Aussie (AUD/USD) is falling towards the pivot, which has been identified as a pullback support and could bounce to the 1st resistance, which aligns with the 145% Fibonacci extension.
Pivot: 0.6445
1st Support: 0.6408z
1st Resistance: 0.6514
Risk Warning:
Trading Forex and CFDs carries a high level of risk to your capital and you should only trade with money you can afford to lose. Trading Forex and CFDs may not be suitable for all investors, so please ensure that you fully understand the risks involved and seek independent advice if necessary.
Disclaimer:
The above opinions given constitute general market commentary, and do not constitute the opinion or advice of IC Markets or any form of personal or investment advice.
Any opinions, news, research, analyses, prices, other information, or links to third-party sites contained on this website are provided on an "as-is" basis, are intended only to be informative, is not an advice nor a recommendation, nor research, or a record of our trading prices, or an offer of, or solicitation for a transaction in any financial instrument and thus should not be treated as such. The information provided does not involve any specific investment objectives, financial situation and needs of any specific person who may receive it. Please be aware, that past performance is not a reliable indicator of future performance and/or results. Past Performance or Forward-looking scenarios based upon the reasonable beliefs of the third-party provider are not a guarantee of future performance. Actual results may differ materially from those anticipated in forward-looking or past performance statements. IC Markets makes no representation or warranty and assumes no liability as to the accuracy or completeness of the information provided, nor any loss arising from any investment based on a recommendation, forecast or any information supplied by any third-party.

AUD/USD) Technical Analysis Read The ChaptianSMC-Trading Point update
Technical analysis of the AUD/USD currency pair on the 1-hour timeframe. Here's the idea behind the analysis:
Key Elements:
1. Support and Resistance Levels:
Resistance zone: Around 0.64350–0.64450
Support zone: Around 0.63450–0.63550
2. EMA (200):
The price is currently below the 200 EMA (0.64259), indicating bearish momentum.
3. RSI (Relative Strength Index):
RSI is around 50, indicating neutral momentum, but recently crossed down, hinting potential bearish continuation.
4. Two Scenarios Proposed:
Bullish Scenario:
If the price breaks above the resistance zone (~0.64400), a bullish rally toward the upper target at 0.65139 is expected.
Bearish Scenario:
If the price gets rejected from the resistance and breaks below the current support zone, a bearish move toward 0.63461 is expected.
5. Current Bias:
Slight bearish bias as the price is below both the resistance zone and the 200 EMA, with a possible setup for a breakdown.
Mr SMC Trading point
Conclusion:
This is a classic breakout or breakdown setup. The price is near a decision point, and the next move will likely depend on whether it breaks above the resistance or below the support zone.
Pales support boost 🚀 analysis follow

AUDUSD Will Move Lower! Sell!
Take a look at our analysis for AUDUSD.
Time Frame: 7h
Current Trend: Bearish
Sentiment: Overbought (based on 7-period RSI)
Forecast: Bearish
The market is testing a major horizontal structure 0.642.
Taking into consideration the structure & trend analysis, I believe that the market will reach 0.635 level soon.
P.S
The term oversold refers to a condition where an asset has traded lower in price and has the potential for a price bounce.
Overbought refers to market scenarios where the instrument is traded considerably higher than its fair value. Overvaluation is caused by market sentiments when there is positive news.
Disclosure: I am part of Trade Nation's Influencer program and receive a monthly fee for using their TradingView charts in my analysis.
Like and subscribe and comment my ideas if you enjoy them!

AUD/USD BEARS WILL DOMINATE THE MARKET|SHORT
Hello, Friends!
It makes sense for us to go short on AUD/USD right now from the resistance line above with the target of 0.638 because of the confluence of the two strong factors which are the general downtrend on the previous 1W candle and the overbought situation on the lower TF determined by it’s proximity to the upper BB band.
Disclosure: I am part of Trade Nation's Influencer program and receive a monthly fee for using their TradingView charts in my analysis.
✅LIKE AND COMMENT MY IDEAS✅

CADCHF watch the drop!!Good day traders, I recently share an Idea on CADCHF and if you go back and see what was outlined and how I ended the description. I highlighted that price might manipulate higher but as long as the overall bias remains we still on!!
How I look at the markets is I like to cross reference different pairs and GBPCAD confirmed my bearish outlook and so did AUDCAD. Study this setup till Sellside liquidity 🙏🏽
