CadChf daily bias confirmedGood day traders, I’m back with CadChf but this one is special cause it provides us a clean setup where I will get an opportunity to explain some of ICT concepts that I look for and have made me the trader I am today but I’m not here to talk about Michael!! Just his thoughts behind this type of setup.
Well my excitement is that this setup is happening on the daily timeframe so hopefully it’ll be much more understandable. First let’s start with some tape reading on the left hand side we can see that price has been bearish and have reason to believe that price has bottomed as we can see that price left a low only to later take out creating a new one than made a run higher shifting structure on the lower TF’s but here on the daily what price did was leave the first presented FVG which you can see on the chart I have marked it. Back to the tape, if you take a closer look at that F.PFVG you’ll see that price only touch the upper quarter of the level and price made a move higher. Here why I said this one was special👂 ICT teaches how to look at price from a naked eye just by dividing gaps, FVG and OB’s and more.. by 4 quarters and FIB retrace works wonders here 0,25,50,75,100. 50 being the midpoint. Price from experience since paying attention to details always comes for the F.PFVG midpoint ATLEAST!🔊
If you look at the chart again you’ll see a red arrow pointing to that wick’cosidered a gap’, now if we consider that wick a gap than we gonna treat it as one. If you take you FIB and get the levels you’ll see price was a few pips shy of the midpoint of that gap!!👂
Our narrative than becomes…we wanna see price reach the midpoint of that wick considered a gap. Than we gonna shoot down if we can just get to that midpoint 🤞🏾
Because we cannot I repeat we cannot trust price, we can expect it to disrespect that buyside but not close higher 🛑✋, our draw on liquidity is the one below.
Please study this setup carefully 🙏🏽🙏🏽
AUDUSD

AUD/USD Looks Set for a PullbackThe V-bottom on AUD/USD certainly delivered for bulls, considering its low was printed amid a flurry of panicked headlines with the Aussie was on the brink of falling below 59c. But we're yet to see a pullback, even though it has been teasing one for a few weeks.
But given AUD/USD formed its most bearish day since April 4 on Wednesday, with a bearish engulfing candle which saw a false break of 65c before closing beneath its 200-day SMA, perhaps a pullback is imminent.
Also note the bearish divergence on the RSI (2).
Bears could seek to fade into moves towards the 200-day SMA, and retain a bearish bias while prices remain beneath Wednesday's high. A retest of the April VPOC at 0.6371 seems feasible, and a break beneath the 0.6344 low assumes a much larger correction is underway.
Matt Simpson, Market Analyst at City Index and Forex.com

Potential bearish drop?The Aussie (AUD/USD0 is rising towards the pivot which is a pullback resistance and could reverse to the 1st support that aligns with the 161.8% Fibonacci extension.
Pivot: 0.6446
1st Support: 0.6393
1st Resistance: 0.6468
Risk Warning:
Trading Forex and CFDs carries a high level of risk to your capital and you should only trade with money you can afford to lose. Trading Forex and CFDs may not be suitable for all investors, so please ensure that you fully understand the risks involved and seek independent advice if necessary.
Disclaimer:
The above opinions given constitute general market commentary, and do not constitute the opinion or advice of IC Markets or any form of personal or investment advice.
Any opinions, news, research, analyses, prices, other information, or links to third-party sites contained on this website are provided on an "as-is" basis, are intended only to be informative, is not an advice nor a recommendation, nor research, or a record of our trading prices, or an offer of, or solicitation for a transaction in any financial instrument and thus should not be treated as such. The information provided does not involve any specific investment objectives, financial situation and needs of any specific person who may receive it. Please be aware, that past performance is not a reliable indicator of future performance and/or results. Past Performance or Forward-looking scenarios based upon the reasonable beliefs of the third-party provider are not a guarantee of future performance. Actual results may differ materially from those anticipated in forward-looking or past performance statements. IC Markets makes no representation or warranty and assumes no liability as to the accuracy or completeness of the information provided, nor any loss arising from any investment based on a recommendation, forecast or any information supplied by any third-party.

Bearish drop for the Aussie?The price is rising towards the resistance level which is a pullback resistance that is slightly above the 23.6% Fibonacci retracement and could drop from this level to our take profit.
Entry: 0.6468
Why we like it:
There is a pullback resistance level that is slightly above the 23.6% Fibonacci retracement.
Stop loss: 0.6487
Why we like it:
There is a pullback resistance level that lines up with the 61.8% Fibonacci retracement.
Take profit: 0.6433
Why we like it:
There is an overlap support level that is slightly below the 50% Fibonacci retracement.
Enjoying your TradingView experience? Review us!
Please be advised that the information presented on TradingView is provided to Vantage (‘Vantage Global Limited’, ‘we’) by a third-party provider (‘Everest Fortune Group’). Please be reminded that you are solely responsible for the trading decisions on your account. There is a very high degree of risk involved in trading. Any information and/or content is intended entirely for research, educational and informational purposes only and does not constitute investment or consultation advice or investment strategy. The information is not tailored to the investment needs of any specific person and therefore does not involve a consideration of any of the investment objectives, financial situation or needs of any viewer that may receive it. Kindly also note that past performance is not a reliable indicator of future results. Actual results may differ materially from those anticipated in forward-looking or past performance statements. We assume no liability as to the accuracy or completeness of any of the information and/or content provided herein and the Company cannot be held responsible for any omission, mistake nor for any loss or damage including without limitation to any loss of profit which may arise from reliance on any information supplied by Everest Fortune Group.

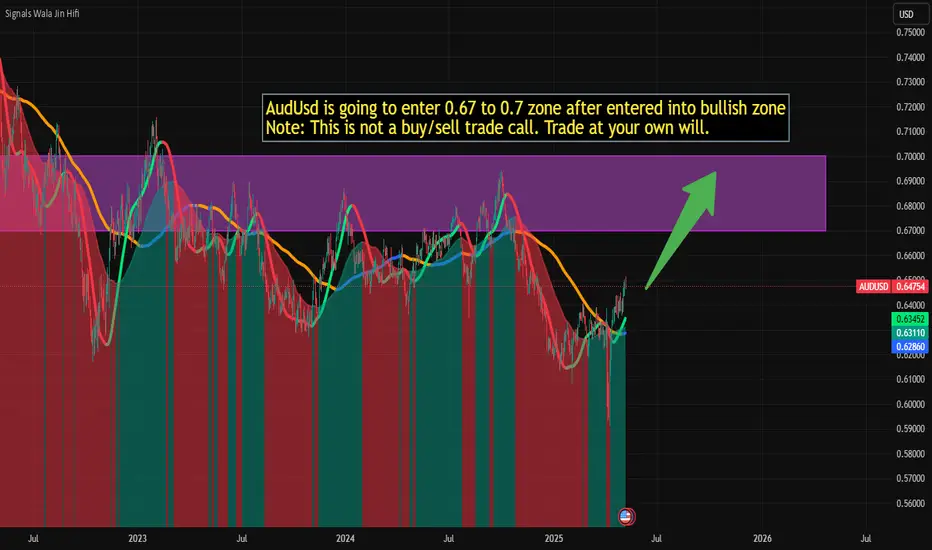
AudUsd is going to 0.67 to 0.7 zoneAudUsd is going to enter 0.67 to 0.7 zone after entered into bullish zone
Note: This is not a buy/sell trade call. Trade at your own will.
Aussie H1 | Approaching a pullback supportThe Aussie (AUD/USD) is falling towards a pullback support and could potentially bounce off this level to climb higher.
Buy entry is at 0.6469 which is a pullback support that aligns close to the 23.6% Fibonacci retracement.
Stop loss is at 0.6430 which is a level that lies underneath an overlap support and the 50.0% Fibonacci retracement.
Take profit is at 0.6507 which is a swing-high resistance.
High Risk Investment Warning
Trading Forex/CFDs on margin carries a high level of risk and may not be suitable for all investors. Leverage can work against you.
Stratos Markets Limited (tradu.com):
CFDs are complex instruments and come with a high risk of losing money rapidly due to leverage. 63% of retail investor accounts lose money when trading CFDs with this provider. You should consider whether you understand how CFDs work and whether you can afford to take the high risk of losing your money.
Stratos Europe Ltd (tradu.com):
CFDs are complex instruments and come with a high risk of losing money rapidly due to leverage. 63% of retail investor accounts lose money when trading CFDs with this provider. You should consider whether you understand how CFDs work and whether you can afford to take the high risk of losing your money.
Stratos Global LLC (tradu.com):
Losses can exceed deposits.
Please be advised that the information presented on TradingView is provided to Tradu (‘Company’, ‘we’) by a third-party provider (‘TFA Global Pte Ltd’). Please be reminded that you are solely responsible for the trading decisions on your account. There is a very high degree of risk involved in trading. Any information and/or content is intended entirely for research, educational and informational purposes only and does not constitute investment or consultation advice or investment strategy. The information is not tailored to the investment needs of any specific person and therefore does not involve a consideration of any of the investment objectives, financial situation or needs of any viewer that may receive it. Kindly also note that past performance is not a reliable indicator of future results. Actual results may differ materially from those anticipated in forward-looking or past performance statements. We assume no liability as to the accuracy or completeness of any of the information and/or content provided herein and the Company cannot be held responsible for any omission, mistake nor for any loss or damage including without limitation to any loss of profit which may arise from reliance on any information supplied by TFA Global Pte Ltd.
The speaker(s) is neither an employee, agent nor representative of Tradu and is therefore acting independently. The opinions given are their own, constitute general market commentary, and do not constitute the opinion or advice of Tradu or any form of personal or investment advice. Tradu neither endorses nor guarantees offerings of third-party speakers, nor is Tradu responsible for the content, veracity or opinions of third-party speakers, presenters or participants.

AUDUSD LONG FORECAST Q2 W19 D7 Y25AUDUSD LONG FORECAST Q2 W19 D7 Y25
Professional Risk Managers👋
Welcome back to another FRGNT chart update📈
Diving into some Forex setups using predominantly higher time frame order blocks alongside confirmation breaks of structure.
Let’s see what price action is telling us today!
💡Here are some trade confluences📝
✅Weekly 50 EMA
✅Intraday 15' order block
✅Tokyo ranges to be filled
✅Intraday bullish breaks of structure to be confirmed
🔑 Remember, to participate in trading comes always with a degree of risk, therefore as professional risk managers it remains vital that we stick to our risk management plan as well as our trading strategies.
📈The rest, we leave to the balance of probabilities.
💡Fail to plan. Plan to fail.
🏆It has always been that simple.
❤️Good luck with your trading journey, I shall see you at the very top.
🎯Trade consistent, FRGNT X

GbpAud now the “buyers” are within!Good day traders, we back with GBPAUD but before I go into it. Last week I took loss because I was buying GBPAUD but I lately found out I was way too early and my narrative has not changed at all.
1D- Daily TF we have a bearish structure and we know that once price shifts structure we want price to retest Atleast till the 0.705 of the OTE fib level to later continue to the Sellside liquidity.
4H- On this respective TF we are also in a bearish structure but I believe not for long because on the lower TF the shift higher has materialised, giving confirmation that we can start positioning ourselves for the up movement.
1H- ICT has a entry model(F.PFVG), on the hourly we saw prices giving back all of yesterday’s gains till it reach that level of first presented FVG and that’s what we gonna use as the level of interest.

Bearish reversal for the Aussie?The price is rising towards the pivot and could reverse to the 1st support.
Pivot: 0.6536
1st Support: 0.6407
1st Resistance: 0.6619
Risk Warning:
Trading Forex and CFDs carries a high level of risk to your capital and you should only trade with money you can afford to lose. Trading Forex and CFDs may not be suitable for all investors, so please ensure that you fully understand the risks involved and seek independent advice if necessary.
Disclaimer:
The above opinions given constitute general market commentary, and do not constitute the opinion or advice of IC Markets or any form of personal or investment advice.
Any opinions, news, research, analyses, prices, other information, or links to third-party sites contained on this website are provided on an "as-is" basis, are intended only to be informative, is not an advice nor a recommendation, nor research, or a record of our trading prices, or an offer of, or solicitation for a transaction in any financial instrument and thus should not be treated as such. The information provided does not involve any specific investment objectives, financial situation and needs of any specific person who may receive it. Please be aware, that past performance is not a reliable indicator of future performance and/or results. Past Performance or Forward-looking scenarios based upon the reasonable beliefs of the third-party provider are not a guarantee of future performance. Actual results may differ materially from those anticipated in forward-looking or past performance statements. IC Markets makes no representation or warranty and assumes no liability as to the accuracy or completeness of the information provided, nor any loss arising from any investment based on a recommendation, forecast or any information supplied by any third-party.

AUD_USD WILL KEEP GROWING|LONG|
✅AUD_USD is trading in an
Uptrend and the pair made a
Bullish breakout of the key
Horizontal level of 0.6450
And the breakout
Is confirmed so as the pair keeps
Growing we will be expecting a
Further bullish move up
LONG🚀
✅Like and subscribe to never miss a new idea!✅
Disclosure: I am part of Trade Nation's Influencer program and receive a monthly fee for using their TradingView charts in my analysis.

2 out of 2? gBPcAd..iT’s tIMe yET?1D- Daily timeframe we saw price break structure lower but after the break price did not move lower in fact we saw it retracing.
4H- Here price agreed with the daily by breaking structure higher to go take the liquidity(Internal) resting higher, if we take a closer look at the leg that broke structure higher we can than identify imbalances in price and as ICT mentions price looks for two things 1. liquidity and 2. Imbalances. Right now our focus is price balancing before going for the buyside.

AUDUSD READY TO LAUNCH: HTF Bias + OB + FVG + PRIME SETUPBias:
We’re operating within a clear bullish higher time frame bias, confirmed by previous swing structure and continuous displacement to the upside. Price has consistently made higher highs and higher lows on the 4H and Daily chart.
Entry Zone:
✅ 4H Fair Value Gap (FVG) — a clean imbalance from prior bullish displacement. Price has now retraced into this inefficiency, a key area where smart money typically looks to re-accumulate.
✅ 1H Order Block (OB) — precisely overlapping the 4H FVG, strengthening the setup. This is the last bearish candle before the bullish move that created a market structure shift, now acting as a support zone.
This dual confluence—FVG + OB at a retracement level—marks a premium setup.

Usdcad PWL?!Good day traders, we back with USDCAD on the 4h TF. Well for this setup I am looking for price to take out out previous week low, previous week we had a candle stick pattern recognition after we saw price move lower but failing to close lower told a different story that price is not yet ready to start moving higher which honestly speaking was my bias last week. For the rest of the day I believe we can expect lower prices to close the day.

AUDUSD H1 I Bullish Bounce Off 61.8% Fibo Based on the H1 chart analysis, the price is falling toward our buy entry level at 0.6417, a pullback support that aligns with the 61.8% Fibonacci retracement.
Our take profit is set at 0.6488, a swing high resistance.
The stop loss is placed at 0.6355, a swing high resistance.
High Risk Investment Warning
Trading Forex/CFDs on margin carries a high level of risk and may not be suitable for all investors. Leverage can work against you.
Stratos Markets Limited (tradu.com):
CFDs are complex instruments and come with a high risk of losing money rapidly due to leverage. 63% of retail investor accounts lose money when trading CFDs with this provider. You should consider whether you understand how CFDs work and whether you can afford to take the high risk of losing your money.
Stratos Europe Ltd (tradu.com):
CFDs are complex instruments and come with a high risk of losing money rapidly due to leverage. 63% of retail investor accounts lose money when trading CFDs with this provider. You should consider whether you understand how CFDs work and whether you can afford to take the high risk of losing your money.
Stratos Global LLC (tradu.com):
Losses can exceed deposits.
Please be advised that the information presented on TradingView is provided to Tradu (‘Company’, ‘we’) by a third-party provider (‘TFA Global Pte Ltd’). Please be reminded that you are solely responsible for the trading decisions on your account. There is a very high degree of risk involved in trading. Any information and/or content is intended entirely for research, educational and informational purposes only and does not constitute investment or consultation advice or investment strategy. The information is not tailored to the investment needs of any specific person and therefore does not involve a consideration of any of the investment objectives, financial situation or needs of any viewer that may receive it. Kindly also note that past performance is not a reliable indicator of future results. Actual results may differ materially from those anticipated in forward-looking or past performance statements. We assume no liability as to the accuracy or completeness of any of the information and/or content provided herein and the Company cannot be held responsible for any omission, mistake nor for any loss or damage including without limitation to any loss of profit which may arise from reliance on any information supplied by TFA Global Pte Ltd.
The speaker(s) is neither an employee, agent nor representative of Tradu and is therefore acting independently. The opinions given are their own, constitute general market commentary, and do not constitute the opinion or advice of Tradu or any form of personal or investment advice. Tradu neither endorses nor guarantees offerings of third-party speakers, nor is Tradu responsible for the content, veracity or opinions of third-party speakers, presenters or participants.

Australian dollar hits five-month high after Australian electionThe Australian dollar continues to impress and has posted strong gains on Monday. European session, AUD/USD is trading at 0.6491, up 0.72% on the day and its highest level since early December 2025.
Prime Minister Anthony Albanese cruised to a resounding victory in Saturday's national election. Albanese' centre-left Labor Party increased its majority and thumped the Liberal Party opposition. The coalition's defeat was marked by its leader, Peter Dutton losing his own seat.
The long shadow of US President Donald Trump was a factor in the election. Dutton adopted right-wing policies such as promising tougher immigration laws and establishing a platform to reduce the waste of public funds. The similarities between Dutton and Trump hurt the Liberal leader as many voters were upset with Trump's 10% tariffs on Australia.
At the start of the year, Albanese was trailing badly in the opinion polls. However, he struck a receptive chord among voters on domestic issues such as health care and housing, and benefited from the anti-Trump sentiment, which proved to be a winning recipe.
US nonfarm payrolls, a key gauge of the US labor market, dipped slightly to 177 thousand in April, down from a revised 185 thousand in March. This easily beat the market estimate of 130 thousand. The positive unemployment report points to a resilient labor market which remains strong despite the US economy declining in the first quarter.
The markets have responded by lowering the odds of a rate hike in June to 33%, down sharply from 60% a week ago, according to the CME's FedWatch. The Federal Reserve meets on Wednesday and is virtually certain to maintain the benchmark rate of 4.25%-4.5%.

AUDUSD: Short Signal with Entry/SL/TP
AUDUSD
- Classic bearish formation
- Our team expects pullback
SUGGESTED TRADE:
Swing Trade
Short AUDUSD
Entry - 0.6477
Sl - 0.6503
Tp - 0.6429
Our Risk - 1%
Start protection of your profits from lower levels
Disclosure: I am part of Trade Nation's Influencer program and receive a monthly fee for using their TradingView charts in my analysis.
❤️ Please, support our work with like & comment! ❤️

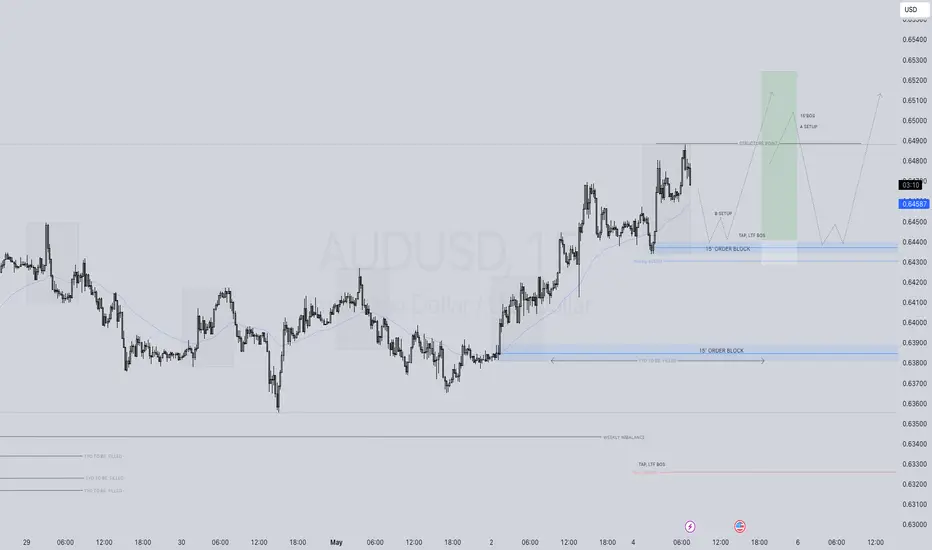
AUDUSD LONG FORECAST Q2 W19 D5 Y25
AUDUSD LONG FORECAST Q2 W19 D5 Y25
Professional Risk Managers👋
Welcome back to another FRGNT chart update📈
Diving into some Forex setups using predominantly higher time frame order blocks alongside confirmation breaks of structure.
Let’s see what price action is telling us today!
💡Here are some trade confluences📝
✅Weekly 50 EMA
✅Intraday 15' order block
✅Tokyo ranges to be filled
✅Intraday bullish breaks of structure to be confirmed
🔑 Remember, to participate in trading comes always with a degree of risk, therefore as professional risk managers it remains vital that we stick to our risk management plan as well as our trading strategies.
📈The rest, we leave to the balance of probabilities.
💡Fail to plan. Plan to fail.
🏆It has always been that simple.
❤️Good luck with your trading journey, I shall see you at the very top.
🎯Trade consistent, FRGNT X
Potential bullish rise?The Aussie (AUD/USD) has bounced off the pivot which is a pullback support and could rise to the 1st resistance which has been identified as an overlap resistance.
Pivot: 0.6391
1st Support: 0.6258
1st Resistance: 0.6647
Risk Warning:
Trading Forex and CFDs carries a high level of risk to your capital and you should only trade with money you can afford to lose. Trading Forex and CFDs may not be suitable for all investors, so please ensure that you fully understand the risks involved and seek independent advice if necessary.
Disclaimer:
The above opinions given constitute general market commentary, and do not constitute the opinion or advice of IC Markets or any form of personal or investment advice.
Any opinions, news, research, analyses, prices, other information, or links to third-party sites contained on this website are provided on an "as-is" basis, are intended only to be informative, is not an advice nor a recommendation, nor research, or a record of our trading prices, or an offer of, or solicitation for a transaction in any financial instrument and thus should not be treated as such. The information provided does not involve any specific investment objectives, financial situation and needs of any specific person who may receive it. Please be aware, that past performance is not a reliable indicator of future performance and/or results. Past Performance or Forward-looking scenarios based upon the reasonable beliefs of the third-party provider are not a guarantee of future performance. Actual results may differ materially from those anticipated in forward-looking or past performance statements. IC Markets makes no representation or warranty and assumes no liability as to the accuracy or completeness of the information provided, nor any loss arising from any investment based on a recommendation, forecast or any information supplied by any third-party.

Week of 5/4/25: AUDUSD AnalysisAfter a hellish week of consolidation, price has made its move higher (finally) and we're back to a trendy chart.
My analysis the beginning of the week shows 2 POIs that I am interested in for longs, and if it breaks the level that I pointed out bearish, I will look for shorts.
Thanks for tuning in!
Major News:
FOMC - Wed
Unemployment - Thurs

Falling towards 50% Fibonacci support?AUD/USD is falling towards a support level, which is a pullback support that aligns with the 50% Fibonacci retracement, and could bounce from this level toward our take-profit target.
Entry: 0.6418
Why we like it:
There is a pullback support level that lines up with the 50% Fibonacci retracement.
Stop loss: 0.6394
Why we like it:
There is a pullback support level that is slightly above the 78.6% Fibonacci retracement.
Take profit: 0.6466
Why we like it:
There is a pullback resistance level.
Enjoying your TradingView experience? Review us!
Please be advised that the information presented on TradingView is provided to Vantage (‘Vantage Global Limited’, ‘we’) by a third-party provider (‘Everest Fortune Group’). Please be reminded that you are solely responsible for the trading decisions on your account. There is a very high degree of risk involved in trading. Any information and/or content is intended entirely for research, educational and informational purposes only and does not constitute investment or consultation advice or investment strategy. The information is not tailored to the investment needs of any specific person and therefore does not involve a consideration of any of the investment objectives, financial situation or needs of any viewer that may receive it. Kindly also note that past performance is not a reliable indicator of future results. Actual results may differ materially from those anticipated in forward-looking or past performance statements. We assume no liability as to the accuracy or completeness of any of the information and/or content provided herein and the Company cannot be held responsible for any omission, mistake nor for any loss or damage including without limitation to any loss of profit which may arise from reliance on any information supplied by Everest Fortune Group.

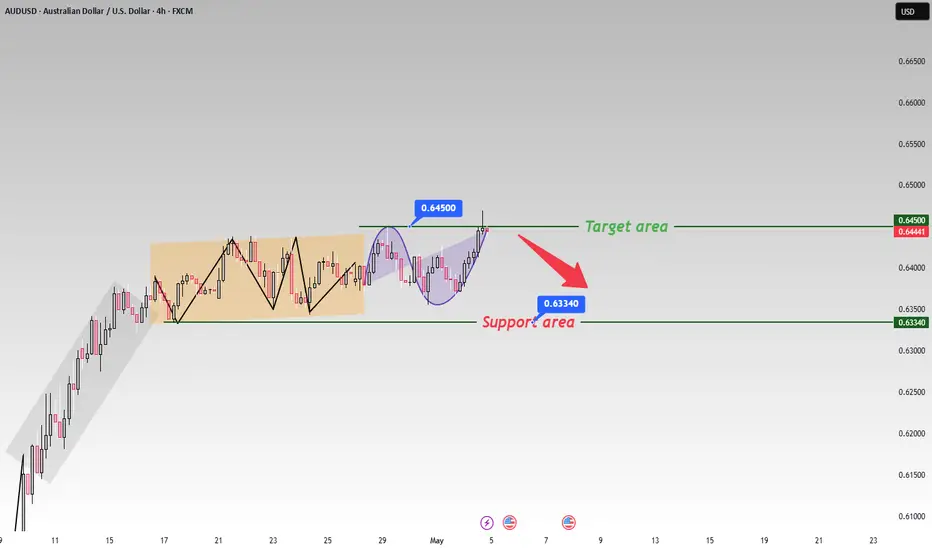
The trend next weekJudging from the price trend presented in the chart, the current market is clearly in a bearish state 📉. Previously, after the price reached the key resistance level of 0.64500, it failed to break through effectively and continue the upward trend. Instead, it entered a consolidation pattern 📊. This indicates that the bullish forces encountered strong resistance near this price level and found it difficult to push the price higher 👎.
It is expected that in the coming period, without significant positive news stimuli, the price is highly likely to continue its downward trend 📉. Investors should closely monitor whether the support level of 0.63340 holds 👀. If this support level is broken, they may consider selling short on rallies ⏬.
⚡⚡⚡ AUDUSD ⚡⚡⚡
🚀 Sell@0.6500 - 0.6450
🚀 TP 0.6350 - 0.6300
Accurate signals are updated every day 📈 If you encounter any problems during trading, these signals can serve as your reliable guide 🧭 Feel free to refer to them! I sincerely hope they'll be of great help to you 🌟
Look To Sell USD and Buy EUR, GBP, NZD and AUD!This is the FOREX outlook for the week of May 5 - 9th.
In this video, we will analyze the following FX markets:
USD Index
EUR
GBP
AUD
NZD
CAD
CHF
JPY
USD Index has tapped the W -FVG. I expect it to sweep the last week's high before heading down. Short term strength for longer term weakness.
Look to buy xxxUSD pairs. Sell USDxxx pairs.
Wait for valid setups. FOMC is Wednesday! Don't just jump into trades without confirming the bias first!
Enjoy!
May profits be upon you.
Leave any questions or comments in the comment section.
I appreciate any feedback from my viewers!
Like and/or subscribe if you want more accurate analysis.
Thank you so much!
Disclaimer:
I do not provide personal investment advice and I am not a qualified licensed investment advisor.
All information found here, including any ideas, opinions, views, predictions, forecasts, commentaries, suggestions, expressed or implied herein, are for informational, entertainment or educational purposes only and should not be construed as personal investment advice. While the information provided is believed to be accurate, it may include errors or inaccuracies.
I will not and cannot be held liable for any actions you take as a result of anything you read here.
Conduct your own due diligence, or consult a licensed financial advisor or broker before making any and all investment decisions. Any investments, trades, speculations, or decisions made on the basis of any information found on this channel, expressed or implied herein, are committed at your own risk, financial or otherwise.

AUD/USD Opening Trends and Trading Strategies Next WeekThe AUD/USD has been in a range - bound fluctuation recently. 📈 In the short term, if the price can stay above the support level of 0.63340 and market risk - appetite sentiment rises, the AUD/USD is expected to challenge the target level of 0.64500. 🎯 However, if it breaks below the support level, it may trigger further downward adjustments. 📉
⚡⚡⚡ AUDUSD ⚡⚡⚡
🚀 Buy@0.6350 - 0.6380
🚀 TP 0.6400 - 0.6450
Accurate signals are updated every day 📈 If you encounter any problems during trading, these signals can serve as your reliable guide 🧭 Feel free to refer to them! I sincerely hope they'll be of great help to you 🌟
