AUDUSD LOOKING FOR A PULLBACK TO 0.62700 AND PUMP TO 0.685AUDUSD looking for a retarcement to the goldbach FVG zone at 0.62700 and then a impulse to the higher order block to complete the return to origin
AUDUSD

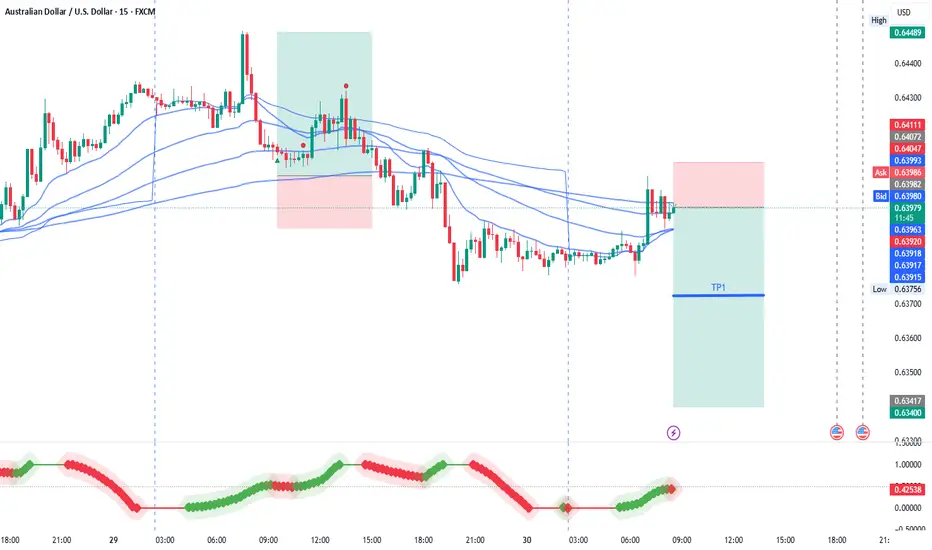
AUDUSD: Neutral View First Buy and Then Sell! Hey everyone!
Our first buy swing entry is going swimmingly! We’ve got over 500 pips running positively, and we reckon price can keep going up and then when it hits our selling zone, you can swing sell too. This is a fantastic opportunity where we can wait for price to do its thing and then when it reaches the sell zone, we can execute our order. But if you’re feeling adventurous and want to take a bit of a risk, you can take a buy entry at the given point and keep it up until it reaches our sell area.
With just one shot, we can make two entries!
Good luck and trade safely!
Thanks a bunch for your unwavering support! 😊
If you’d like to lend a hand, here are a few ways you can contribute:
- Like our ideas
- Comment on our ideas
- Share our ideas
Cheers,
Team Setupsfx_
❤️🚀

AUDUSD(20250502)Today's AnalysisToday's buying and selling boundaries:
0.6391
Support and resistance levels:
0.6452
0.6429
0.6414
0.6367
0.6352
0.6329
Trading strategy:
If the price breaks through 0.6391, consider buying, the first target price is 0.6414
If the price breaks through 0.6367, consider selling, the first target price is 0.6352

AUDUSD SHORT FORECAST Q2 W18 D2 Y25AUDUSD SHORT FORECAST Q2 W18 D2 Y25
Professional Risk Managers👋
Welcome back to another FRGNT chart update📈
Diving into some Forex setups using predominantly higher time frame order blocks alongside confirmation breaks of structure.
Let’s see what price action is telling us today!
💡Here are some trade confluences📝
✅Weekly 50 EMA
✅Intraday 15' order block
✅Tokyo ranges to be filled
✅Intraday 15' order block trading levels
🔑 Remember, to participate in trading comes always with a degree of risk, therefore as professional risk managers it remains vital that we stick to our risk management plan as well as our trading strategies.
📈The Xrest, we leave to the balance of probabilities.
💡Fail to plan. Plan to fail.
🏆It has always been that simple.
❤️Good luck with your trading journey, I shall see you at the very top.
🎯Trade consistent, FRGNT

AUDUSD SELL (USD NFP NEWS FRDAY TOMORROW)As the chart looks its building resistance with many wicks, we can most likely see AUDUSD will drop tomorrow as Non-Farm Payroll from USD. It does not seem it will push up as I thought to expect to break the resistance, but still keep a good watch on it.
Take Profit: 0.634 or below

Yen slides as BoJ cuts growth forecastThe Japanese yen continues to lose ground and is sharply lower on Thursday. In the European session, USD/JPY is trading at 144.36, up 0.92% on the day. Earlier, the yen weakened to 144.74, its weakest level since April 10.
There were no surprises from the Bank of Japan, which maintained its key interest rate at 0.5% in a unanimous vote. The BoJ has signaled that it plans to continue hiking rates and normalize policy, but the turmoil caused by US President Trump's tariff policy may delay the next rate increase until after the summer.
The BoJ board cut its growth and inflation forecasts in its quarterly outlook report. The growth forecast for the fiscal year ending March 2026 was slashed to 0.5% from 1.1% in January and inflation is not expected to remain sustainable at 2% until the second half of 2026, a year later than in the January forecast.
The forecast noted that US tariffs would dampen Japan's economy by weighing on global trade and consumer and businesses confidence would be impacted due to the "heightened uncertainties" over the tariffs.
The markets expected a soft US GDP release for Q1 but the 0.3% q/q decline was well below the market estimate of 0.2%. This followed a strong 2.4% gain in the fourth quarter of 2024. The surprise decline was driven by Trump's tariffs, as imports surged ahead of the tariffs taking effect and consumer spending declined.
The weak GDP figure raised the probability of further rate cuts and the markets are looking for up to four rate cuts before the end of the year. The Fed is in a wait-and-see mode, with little chance of a cut in May, but further economic deterioration could force the Fed to cut in June.

AUD/USD Faces Resistance Rejection – Short Setup in Play!Timeframe: 1-Hour Chart
Analyzing intraday to short-term movement in AUD/USD.
Entry Zone (Supply Area):
Price entered the resistance zone near 0.64160 – 0.64200, indicating a potential short entry.
Bearish Rejection:
Strong wick rejection from resistance suggests sellers are active at that level.
Stop-Loss (Red Box Top):
Placed just above the resistance at 0.64296, guarding against false breakouts.
Target Zone (Demand Area):
Marked near 0.63560 – 0.63600, indicating a potential take profit level.
Risk-Reward Ratio:
The green (reward) area is significantly larger than the red (risk), showing a favorable risk-to-reward setup.
Trend Bias:
Overall bearish structure with lower highs and lower lows, supporting short trade bias.
Trigger Confirmation:
Price rejected resistance and started falling, indicating short trade activation.

AUDUSD - Daily chart, OANDA) - Long; Mid-term research idea.AUDUSD - Australian Dollar / U.S. Dollar (Daily chart, OANDA) - Long Position; Mid-term research idea.
Risk assessment: High {volume & support structure integrity risk}
Risk/Reward ratio ~ 2.5
Entry limit ~ 0.63800 on April 30, 2025
1. Target limit ~ 0.67800 (+6.27%; +0.04000 points)
2. Target limit ~ 0.65715 (+3%; +0.01915 points)
Stop order limit ~ 0.62200 (-2.51%; -0.01600 points)
Disclaimer: Investments in securities markets are subject to market risks. All information presented in this group is strictly for reference and personal study purposes only and is not a recommendation and/or a solicitation to act upon under any interpretation of the letter.
LEGEND:
{curly brackets} = observations
= important updates
(parentheses) = information
~ tilde/approximation = variable value
-hyphen = fixed value

Australian core CPI falls within the RBA target, Aussie shrugsThe Australian dollar has been showing strong movement this week but is calm on Wednesday. In the European session, AUD/USD is trading at 0.6391, up 0.14% on the day.
Australia released the CPI report for the first quarter. The Australian dollar didn't show much reaction, but the data could point to another rate cut from the Reserve Bank of Australia.
Headline CPI remained unchanged at 2.4% y/y, just above the market estimate of 2.3%. The significant news was that RBA Trimmed Mean CPI, the key core inflation indicator, dropped to 2.9% y/y from a revised 3.3% gain in Q4 2024. This is the first time in three years that core CPI is back within the RBA's target band of between 1-3%.
The drop in core inflation is good news for the government, with the national election on Saturday. Australian Treasurer Jim Chalmers jumped on the news, stating that the market expects four or five rate additional rate cuts this year, which would save households with mortgages "hundreds of dollars".
The Reserve Bank is expected to lower rates at its next meeting on May 20, which would mark only the second rate cut this year. After cutting rates in February, the central bank has stayed on the sidelines as US President Trump's tariffs have escalated trade tensions and sent the financial markets on a roller-coaster ride.
In the US, the markets are bracing for some weak data later today. ADP employment is expected to slip to 108 thousand, compared to 155 thousand in the previous release. ADP is not considered a reliable gauge for Friday's nonfarm payrolls, but a weak reading will only increase the anxiety of the nervous markets. US first-estimate GDP for Q1 is expected to slide to just 0.4% q/q, after a 2.4% gain in Q3. If there is a surprise reading from GDP, we could see a strong reaction from the US dollar after the release.
AUD/USD is testing resistance at 0.6403. Above, there is resistance at 0.6431
0.6357 and 0.6329 are the next support levels

Australian CPI Surprise: What It Means for the RBA & AUD/USDMatt Simpson breaks down the latest Australian inflation data and what it could mean for the Reserve Bank of Australia’s next move. Plus, we dive into the AUD/USD, AUD/CAD, GBP/AUD and EUR/AUD charts for key technical setups traders need to watch right now.

AUDUSD(20250430)Today's AnalysisTechnical analysis:
Today's buying and selling boundaries: 0.6402
Support and resistance levels:
0.6475
0.6447
0.6430
0.6374
0.6356
0.6329
Trading strategy:
If the price breaks through 0.6402, consider buying, the first target price is 0.6430
If the price breaks through 0.6374, consider selling, the first target price is 0.6356

Aussie H4 | Falling toward an overlap supportThe Aussie (AUD/USD) is falling towards an overlap support and could potentially bounce off this level to climb higher.
Buy entry is at 0.6336 which is an overlap support that aligns close to the 23.6% Fibonacci retracement.
Stop loss is at 0.6235 which is a level that lies underneath a pullback support and the 38.2% Fibonacci retracement.
Take profit is at 0.6463 which is a swing-high resistance.
High Risk Investment Warning
Trading Forex/CFDs on margin carries a high level of risk and may not be suitable for all investors. Leverage can work against you.
Stratos Markets Limited (tradu.com):
CFDs are complex instruments and come with a high risk of losing money rapidly due to leverage. 63% of retail investor accounts lose money when trading CFDs with this provider. You should consider whether you understand how CFDs work and whether you can afford to take the high risk of losing your money.
Stratos Europe Ltd (tradu.com):
CFDs are complex instruments and come with a high risk of losing money rapidly due to leverage. 63% of retail investor accounts lose money when trading CFDs with this provider. You should consider whether you understand how CFDs work and whether you can afford to take the high risk of losing your money.
Stratos Global LLC (tradu.com):
Losses can exceed deposits.
Please be advised that the information presented on TradingView is provided to Tradu (‘Company’, ‘we’) by a third-party provider (‘TFA Global Pte Ltd’). Please be reminded that you are solely responsible for the trading decisions on your account. There is a very high degree of risk involved in trading. Any information and/or content is intended entirely for research, educational and informational purposes only and does not constitute investment or consultation advice or investment strategy. The information is not tailored to the investment needs of any specific person and therefore does not involve a consideration of any of the investment objectives, financial situation or needs of any viewer that may receive it. Kindly also note that past performance is not a reliable indicator of future results. Actual results may differ materially from those anticipated in forward-looking or past performance statements. We assume no liability as to the accuracy or completeness of any of the information and/or content provided herein and the Company cannot be held responsible for any omission, mistake nor for any loss or damage including without limitation to any loss of profit which may arise from reliance on any information supplied by TFA Global Pte Ltd.
The speaker(s) is neither an employee, agent nor representative of Tradu and is therefore acting independently. The opinions given are their own, constitute general market commentary, and do not constitute the opinion or advice of Tradu or any form of personal or investment advice. Tradu neither endorses nor guarantees offerings of third-party speakers, nor is Tradu responsible for the content, veracity or opinions of third-party speakers, presenters or participants.

AUDUSD SHORT FORECAST Q2 W18 D30 Y25AUDUSD SHORT FORECAST Q2 W18 D30 Y25
Professional Risk Managers👋
Welcome back to another FRGNT chart update📈
Diving into some Forex setups using predominantly higher time frame order blocks alongside confirmation breaks of structure.
Let’s see what price action is telling us today!
💡Here are some trade confluences📝
✅Weekly 50 EMA
✅Intraday 15' order block
✅Tokyo ranges to be filled
✅Intraday 15' order block trading levels
🔑 Remember, to participate in trading comes always with a degree of risk, therefore as professional risk managers it remains vital that we stick to our risk management plan as well as our trading strategies.
📈The Xrest, we leave to the balance of probabilities.
💡Fail to plan. Plan to fail.
🏆It has always been that simple.
❤️Good luck with your trading journey, I shall see you at the very top.
🎯Trade consistent, FRGNT

AUDUSD SHORT IDEAUnder current market conditions, the area near 0.6398 has been identified as a critical resistance zone, where the AI model detects a high-probability trade setup.
From a technical perspective, a clear directional bias based on recent price action patterns. Suppose the market demonstrates increased volume and price stability above key moving averages in the 0.6398 area. In that case, traders are advised to monitor for trend-continuation entry opportunities in alignment with the prevailing momentum.
Profit targets are defined at 0.6372 and 0.6344, corresponding to logical technical support zones. These levels are designed for staged profit-taking across different trade management styles. Stop-loss should be strictly enforced at the designated level; once breached, the strategy is considered invalidated in order to limit potential downside.
AUDUSD Potential DownsidesHey Traders, in tomorrow's trading session we are monitoring AUDUSD for a selling opportunity around 0.64100 zone, AUDUSD is trading in a downtrend and currently is in a correction phase in which it is approaching the trend at 0.64100 support and resistance area.
Trade safe, Joe.

USD/JPY : Bull or Bear? Let's See! (READ THE CAPTION)Upon reviewing the USD/JPY chart on the daily timeframe, we observe that due to the sharp drop in the Dollar Index, the price has reached the 140.850 level. This decline was very strong and impulsive; however, as seen on the chart, the price has now approached a significant demand zone between 139.6 and 141. If the price manages to close and stabilize above this area, we can expect a further bullish move from this pair.
Please support me with your likes and comments to motivate me to share more analysis with you and share your opinion about the possible trend of this chart with me !
Best Regards , Arman Shaban

EUR/USD: Possible Fall Ahead? Let's See! (READ THE CAPTION)Upon reviewing the EUR/USD chart on the 3-day timeframe, we can see that following a sharp decline in the Dollar Index (DXY), the pair experienced a bullish move, reaching the 1.15 supply zone. If the price manages to stabilize and close below the 1.15–1.17 area, we can anticipate a further drop in EUR/USD to fill the created Liquidity Void (LV). This analysis will be updated accordingly.
Please support me with your likes and comments to motivate me to share more analysis with you and share your opinion about the possible trend of this chart with me !
Best Regards , Arman Shaban

AUDUSD Will Move Lower! Short!
Take a look at our analysis for AUDUSD.
Time Frame: 1D
Current Trend: Bearish
Sentiment: Overbought (based on 7-period RSI)
Forecast: Bearish
The market is on a crucial zone of supply 0.641.
The above-mentioned technicals clearly indicate the dominance of sellers on the market. I recommend shorting the instrument, aiming at 0.629 level.
P.S
Please, note that an oversold/overbought condition can last for a long time, and therefore being oversold/overbought doesn't mean a price rally will come soon, or at all.
Disclosure: I am part of Trade Nation's Influencer program and receive a monthly fee for using their TradingView charts in my analysis.
Like and subscribe and comment my ideas if you enjoy them!

Market Analysis: AUD/USD Consolidates GainsMarket Analysis: AUD/USD Consolidates Gains
AUD/USD is consolidating gains near the 0.6420 zone.
Important Takeaways for AUD/USD Analysis Today
- The Aussie Dollar started a downside correction from 0.6450 against the US Dollar.
- There was a break above a key bearish trend line with resistance near 0.6400 on the hourly chart of AUD/USD at FXOpen.
AUD/USD Technical Analysis
On the hourly chart of AUD/USD at FXOpen, the pair started a fresh increase from the 0.6345 support. The Aussie Dollar was able to clear the 0.6375 resistance to move into a positive zone against the US Dollar.
There was also a move above the 0.6400 resistance and the 50-hour simple moving average. There was also a break above a key bearish trend line with resistance near 0.6400. Finally, the pair tested the 0.6450 zone. A high was formed near 0.6450 and the pair is now correcting gains.
There was a move below the 0.6420 level. The pair declined below the 23.6% Fib retracement level of the upward move from the 0.6367 swing low to the 0.6449 high.
On the downside, initial support is near the 0.6400 level. It is close to the 61.8% Fib retracement level of the upward move from the 0.6367 swing low to the 0.6449 high. The next major support is near the 0.6360 level.
If there is a downside break below the 0.6360 support, the pair could extend its decline toward the 0.6345 level. Any more losses might signal a move toward 0.6300.
On the upside, the AUD/USD chart indicates that the pair is now facing resistance near 0.6420. The first major resistance might be 0.6450. An upside break above the 0.6450 resistance might send the pair further higher.
The next major resistance is near the 0.6485 level. Any more gains could clear the path for a move toward the 0.6550 resistance zone.
This article represents the opinion of the Companies operating under the FXOpen brand only. It is not to be construed as an offer, solicitation, or recommendation with respect to products and services provided by the Companies operating under the FXOpen brand, nor is it to be considered financial advice.

AUD/USD Breakout Done , Should We Buy To Get 150 Pips ?Here is my opinion about AUD/USD , If we checked 4H Timeframe , we will see that we have a clear breakout and the price closed above my C.T.L , So i`m looking to buy this pair and targeting 150 pips , but i will enter with small lot size cuz this week is very risky due to monthly closure .

AUDUSD SHORT FORECAST Q2 W18 D29 Y25AUDUSD SHORT FORECAST Q2 W18 D29 Y25
Professional Risk Managers👋
Welcome back to another FRGNT chart update📈
Diving into some Forex setups using predominantly higher time frame order blocks alongside confirmation breaks of structure.
Let’s see what price action is telling us today!
💡Here are some trade confluences📝
✅Weekly 50 EMA
✅Intraday 15' order block
✅Tokyo ranges to be filled
✅Intraday 15' order block trading levels
🔑 Remember, to participate in trading comes always with a degree of risk, therefore as professional risk managers it remains vital that we stick to our risk management plan as well as our trading strategies.
📈The rest, we leave to the balance of probabilities.
💡Fail to plan. Plan to fail.
🏆It has always been that simple.
❤️Good luck with your trading journey, I shall see you at the very top.
🎯Trade consistent, FRGNT X

AUD_USD GROWTH AHEAD|LONG|
✅AUD_USD is trading in an
Uptrend and the pair is
Consolidating above the
Horizontal support level
Around 0.6371 and we are
Already seeing a bullish
Rebound from the level
So we are bullish biased
And we will be expecting
The pair to go further
Up this week
LONG🚀
✅Like and subscribe to never miss a new idea!✅
Disclosure: I am part of Trade Nation's Influencer program and receive a monthly fee for using their TradingView charts in my analysis.

Bullish rise?The Aussie (AUD/USD0 has bounced off the pivot which is an overlap support and could rise to the 1st resistance that lines up with the 127.2% Fibonacci extension.
Pivot: 0.6361
1st Support: 0.6290
1st Resistance: 0.6536
Risk Warning:
Trading Forex and CFDs carries a high level of risk to your capital and you should only trade with money you can afford to lose. Trading Forex and CFDs may not be suitable for all investors, so please ensure that you fully understand the risks involved and seek independent advice if necessary.
Disclaimer:
The above opinions given constitute general market commentary, and do not constitute the opinion or advice of IC Markets or any form of personal or investment advice.
Any opinions, news, research, analyses, prices, other information, or links to third-party sites contained on this website are provided on an "as-is" basis, are intended only to be informative, is not an advice nor a recommendation, nor research, or a record of our trading prices, or an offer of, or solicitation for a transaction in any financial instrument and thus should not be treated as such. The information provided does not involve any specific investment objectives, financial situation and needs of any specific person who may receive it. Please be aware, that past performance is not a reliable indicator of future performance and/or results. Past Performance or Forward-looking scenarios based upon the reasonable beliefs of the third-party provider are not a guarantee of future performance. Actual results may differ materially from those anticipated in forward-looking or past performance statements. IC Markets makes no representation or warranty and assumes no liability as to the accuracy or completeness of the information provided, nor any loss arising from any investment based on a recommendation, forecast or any information supplied by any third-party.
