Week of 3/23/25: AUDUSD AnalysisAnalysis of my main pair AUDUSD, last week resulted in the bears taking over and my analysis explains why my bias is bearish going into the new week.
Not much volatile news except for Unemployment Claims on Thursday.
Let me know what you guys think, your analysis, and if you want to see anything else!
Goodluck this week traders, let's kill it.
AUDUSD

AUDUSD Selling Trading IdeaHello Traders
In This Chart AUDUSD HOURLY Forex Forecast By FOREX PLANET
today AUDUSD analysis 👆
🟢This Chart includes_ (AUDUSD market update)
🟢What is The Next Opportunity on AUDUSD Market
🟢how to Enter to the Valid Entry With Assurance Profit
This CHART is For Trader's that Want to Improve Their Technical Analysis Skills and Their Trading By Understanding How To Analyze The Market Using Multiple Timeframes and Understanding The Bigger Picture on the Chart

Bullish bounce?AUD/USD is falling towards the support level which is an overlap support that line sup with the 71% Fibonacci retracement and could bounce from this level to our take profit.
Entry: 0.6248
Why we like it:
There is an overlap support level that lines up with the 71% Fibonacci retracement.
Stop loss: 0.6203
Why we like it:
There is a pullback support level.
Take profit: 0.6305
Why we like it:
There is a pullback resistance level.
Enjoying your TradingView experience? Review us!
Please be advised that the information presented on TradingView is provided to Vantage (‘Vantage Global Limited’, ‘we’) by a third-party provider (‘Everest Fortune Group’). Please be reminded that you are solely responsible for the trading decisions on your account. There is a very high degree of risk involved in trading. Any information and/or content is intended entirely for research, educational and informational purposes only and does not constitute investment or consultation advice or investment strategy. The information is not tailored to the investment needs of any specific person and therefore does not involve a consideration of any of the investment objectives, financial situation or needs of any viewer that may receive it. Kindly also note that past performance is not a reliable indicator of future results. Actual results may differ materially from those anticipated in forward-looking or past performance statements. We assume no liability as to the accuracy or completeness of any of the information and/or content provided herein and the Company cannot be held responsible for any omission, mistake nor for any loss or damage including without limitation to any loss of profit which may arise from reliance on any information supplied by Everest Fortune Group.

WHY AUDUSD IS BEARISH ?? DETAILED ANALYSIS AUD/USD is currently trading at approximately 0.6290 and is forming a bearish flag pattern—a technical indicator suggesting potential continuation of the prevailing downtrend. This pattern typically emerges after a sharp decline, followed by a brief consolidation phase resembling an upward-sloping channel or flag. A decisive break below the flag's support often signals the resumption of bearish momentum, potentially leading to a significant price drop.
Fundamental factors are reinforcing this bearish outlook. Australia's employment data for February 2025 revealed an unexpected decline of 53,000 jobs, contrary to forecasts predicting an increase of 30,000 positions. Despite this, the unemployment rate remained steady at 4.1%. This unexpected contraction in employment could prompt the Reserve Bank of Australia (RBA) to consider interest rate cuts in upcoming meetings to stimulate economic activity.
Additionally, escalating global trade tensions, particularly due to increased U.S. tariffs under the new administration, are contributing to economic uncertainty. These developments have led to downgraded growth forecasts by organizations like the OECD and Fitch Ratings, further weighing on the Australian dollar.
Given these technical and fundamental factors, the AUD/USD pair appears poised for a bearish breakout from the flag pattern. Traders should monitor key support levels, such as the March low of 0.6186 and the 2025 trough at 0.6087. A sustained break below these levels could pave the way toward the psychologically significant 0.6000 mark, aligning with the anticipated 200-pip decline.
In this context, adopting a short position on AUD/USD may be advantageous. However, it's crucial to implement robust risk management strategies, including setting appropriate stop-loss orders, to mitigate potential market volatility.

AUDUSD a Bear Flag and SHS patternAUDUSD on 1h chart, is most likely going down once the red trendline breaks. That will also be a break of a triangle (RED) A large bearish flag with Head and shoulder pattern almost complete. The centre line and the trendline break frequently meets the centre of the swing range. So if the red trendline breaks we are looking at 130 pips down! which is the height of the shoulder if not the head to the breakpoint.
Also a remote possibility that it will break upwards from the triangle

AUD/USD– Bearish Momentum Unleashed!AUD/USD 🐨💵 – Bearish Momentum Unleashed! 🚨📉
Price rejected from Daily & H4 FVG zones 🔥
Pullback expected… then a potential drop toward 0.61872 💔
Weekly Bias = Bearish ✅
Eyes on liquidity grab below recent lows 👀💣
Are you ready for the move? 💼💸 #ForexTrading #AUDUSD #SmartMoneyConcepts #FVG #PriceAction #LiquidityHunt

Weekly FOREX Forecast Mar 17-21: Buy EUR, GBP, AUD, NZD vs USD!This is an outlook for the week of March 17-21st.
In this video, we will analyze the following FX markets:
USD Index
EUR
GBP
AUD
NZD
The USD Index is entering a Daily +FVG, which is nested in a Weekly +FVG. This is a bearish indication for the USD, which is a potential bullish situation for EURUSD, GBPUSD, AUDUSD and NZDUSD. This will be potentially bearish for the USDCAD, USDCHF, and USDJPY. Wait for the market structure shift going in the direction of your TP, and enter on the pullback.
Enjoy!
May profits be upon you.
Leave any questions or comments in the comment section.
I appreciate any feedback from my viewers!
Like and/or subscribe if you want more accurate analysis.
Thank you so much!
Disclaimer:
I do not provide personal investment advice and I am not a qualified licensed investment advisor.
All information found here, including any ideas, opinions, views, predictions, forecasts, commentaries, suggestions, expressed or implied herein, are for informational, entertainment or educational purposes only and should not be construed as personal investment advice. While the information provided is believed to be accurate, it may include errors or inaccuracies.
I will not and cannot be held liable for any actions you take as a result of anything you read here.
Conduct your own due diligence, or consult a licensed financial advisor or broker before making any and all investment decisions. Any investments, trades, speculations, or decisions made on the basis of any information found on this channel, expressed or implied herein, are committed at your own risk, financial or otherwise.

AUD-USD Free Signal! Buy!
Hello,Traders!
AUD-USD is falling down
And is locally oversold so
After the pair retests the
Horizontal support level
Of 0.6260 from where we
Can enter a long trade
With the Take Profit of 0.6292
And the Stop Loss of 0.6249
Buy!
Comment and subscribe to help us grow!
Check out other forecasts below too!
Disclosure: I am part of Trade Nation's Influencer program and receive a monthly fee for using their TradingView charts in my analysis.

AUD/USD BEARS ARE STRONG HERE|SHORT
Hello, Friends!
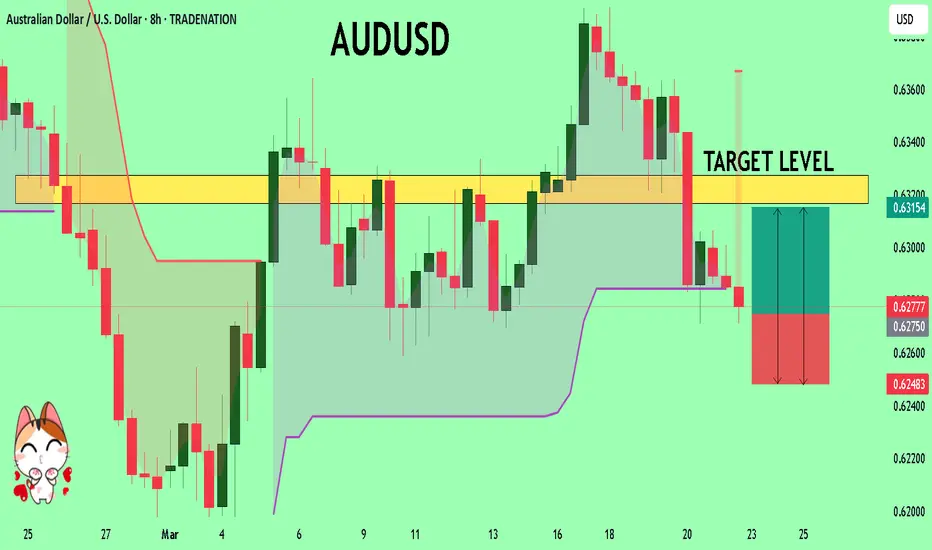
The BB upper band is nearby so AUD-USD is in the overbought territory. Thus, despite the uptrend on the 1W timeframe I think that we will see a bearish reaction from the resistance line above and a move down towards the target at around 0.627.
Disclosure: I am part of Trade Nation's Influencer program and receive a monthly fee for using their TradingView charts in my analysis.
✅LIKE AND COMMENT MY IDEAS✅

AUD_USD RISING SUPPORT AHEAD|LONG|
✅AUD_USD is trading along the rising support
And as the pair will soon retest it
I am expecting the price to go up
To retest the supply levels above at 0.6300
LONG🚀
✅Like and subscribe to never miss a new idea!✅
Disclosure: I am part of Trade Nation's Influencer program and receive a monthly fee for using their TradingView charts in my analysis.

AUDUSD Will Explode! BUY!
My dear friends,
AUDUSD looks like it will make a good move, and here are the details:
The market is trading on 0.6274 pivot level.
Bias - Bullish
Technical Indicators: Supper Trend generates a clear long signal while Pivot Point HL is currently determining the overall Bullish trend of the market.
Goal - 0.6316
Recommended Stop Loss - 0.6248
About Used Indicators:
Pivot points are a great way to identify areas of support and resistance, but they work best when combined with other kinds of technical analysis
Disclosure: I am part of Trade Nation's Influencer program and receive a monthly fee for using their TradingView charts in my analysis.
———————————
WISH YOU ALL LUCK
DXY aka USD suspicious leading diagonalif price confirms it is a leading diagonal, we will see a corrective move down before another spike higher.
Am eagerly waiting for the confirmation to load up positions in eurusd gpb aud etc as DXY will show the way, it moves up mean USD bullish and hence eurusd gbpusd etc moves down.
Good luck.
PS: Give a boost if you like my sharing

AUDUSD SHORT IDEAPossible shorts from highlighted Poi to continue the downtrend that market is currently ,targeting the level 0.60878.. Drop a comment and tell me what you think

Potential bullish rebound?AUD/USD has bounced off the support level which is a pullback support and could rise from this level to our take profit.
Entry: 0.6276
Why we like it:
There is a pullback support level.
Stop loss: 0.6248
Why we like it:
There is a pullback support level.
Take profit: 0.6325
Why we like it:
There is an overlap resistance level that is slightly below the 50% Fibonacci retracement.
Enjoying your TradingView experience? Review us!
Please be advised that the information presented on TradingView is provided to Vantage (‘Vantage Global Limited’, ‘we’) by a third-party provider (‘Everest Fortune Group’). Please be reminded that you are solely responsible for the trading decisions on your account. There is a very high degree of risk involved in trading. Any information and/or content is intended entirely for research, educational and informational purposes only and does not constitute investment or consultation advice or investment strategy. The information is not tailored to the investment needs of any specific person and therefore does not involve a consideration of any of the investment objectives, financial situation or needs of any viewer that may receive it. Kindly also note that past performance is not a reliable indicator of future results. Actual results may differ materially from those anticipated in forward-looking or past performance statements. We assume no liability as to the accuracy or completeness of any of the information and/or content provided herein and the Company cannot be held responsible for any omission, mistake nor for any loss or damage including without limitation to any loss of profit which may arise from reliance on any information supplied by Everest Fortune Group.

AudusdI posted this trade few days ago and this is the outcome lol price is crashing more to de down side

AUDUSDHello Traders! 👋
What are your thoughts on AUDUSD?
The AUDUSD pair is moving within an ascending channel and has recently broken its downtrend line to the upside. This breakout could signal a continuation of the bullish trend.
We expect the price to make a pullback and correction toward the broken trendline before continuing its upward move towards the channel’s upper boundary.
Don’t forget to like and share your thoughts in the comments! ❤️

Why the Weak AU Jobs Report Might Not Force the RBA's HandAustralia's employment report for February delivered a surprising set of weak figures. Understandably, markets reacted by pricing in another RBA cut to arrive sooner than later. But if we dig a little deeper, an April or May cut may still not be a given.
Matt Simpson, Market Analyst at City Index and Forex.com

Setup #006 - AUDUSD - Long (Not the cleanest)Trade entered. I used the 5 min for entry but Tradingview doesn't let me post it on a small time frame.
We should find out if this is a winner or loser during the rest of US/UK overlap. I personally think price wants to drop more, but my strategy says to buy, so I'm listening to the strategy, plus there is a nice risk to reward for this trade.
Confluences:
✅ Bullish overall bias
✅ Bulllish demand zone
✅ Bullish ABCD on 15 min chart, bullish impulse crab on H4
✅ Bullish divergence in price reversal zone
✅ Buillish break of structure
✅ Entering NY open
✅ Break of structure confirmed
✅ Required risk:reward met

Bullish bounce off 50% Fibonacci support?AUD/USD is reacting off the support level which is a pullback support that aligns with the 50% Fibonacci retracement and could bounce from this level to our take profit.
Entry: 0.6333
Why we like it:
There is a pullback support level that aligns with he 50% Fibonacci retracement.
Stop loss: 0.6298
Why we like it:
There is a pullback support level that line sup with the 78.6% Fibonacci retracement.
Take profit: 0.6387
Why we like it:
There is a pullback resistance level.
Enjoying your TradingView experience? Review us!
Please be advised that the information presented on TradingView is provided to Vantage (‘Vantage Global Limited’, ‘we’) by a third-party provider (‘Everest Fortune Group’). Please be reminded that you are solely responsible for the trading decisions on your account. There is a very high degree of risk involved in trading. Any information and/or content is intended entirely for research, educational and informational purposes only and does not constitute investment or consultation advice or investment strategy. The information is not tailored to the investment needs of any specific person and therefore does not involve a consideration of any of the investment objectives, financial situation or needs of any viewer that may receive it. Kindly also note that past performance is not a reliable indicator of future results. Actual results may differ materially from those anticipated in forward-looking or past performance statements. We assume no liability as to the accuracy or completeness of any of the information and/or content provided herein and the Company cannot be held responsible for any omission, mistake nor for any loss or damage including without limitation to any loss of profit which may arise from reliance on any information supplied by Everest Fortune Group.

AUDUSD: Growth & Bullish Continuation
The price of AUDUSD will most likely increase soon enough, due to the demand beginning to exceed supply which we can see by looking at the chart of the pair.
Disclosure: I am part of Trade Nation's Influencer program and receive a monthly fee for using their TradingView charts in my analysis.
❤️ Please, support our work with like & comment! ❤️

WILL AUDUSD STRUCTURE LEADS TO A LONG TRADE?With AUDUSD making HH and HL with this bullish trend results into a long trade for the pair?
N.B!
- AUDUSD price might not follow the drawn lines . Actual price movements may likely differ from the forecast.
- Let emotions and sentiments work for you
- ALWAYS Use Proper Risk Management In Your Trades
#audusd

AUDUSD Will Go Up! Buy!
Please, check our technical outlook for AUDUSD.
Time Frame: 1D
Current Trend: Bullish
Sentiment: Oversold (based on 7-period RSI)
Forecast: Bullish
The market is approaching a key horizontal level 0.632.
Considering the today's price action, probabilities will be high to see a movement to 0.643.
P.S
We determine oversold/overbought condition with RSI indicator.
When it drops below 30 - the market is considered to be oversold.
When it bounces above 70 - the market is considered to be overbought.
Disclosure: I am part of Trade Nation's Influencer program and receive a monthly fee for using their TradingView charts in my analysis.
Like and subscribe and comment my ideas if you enjoy them!

falling towards 50% Fibonacci support?The Aussie (AUD/USD) is falling towards the pivot and could bounce to the 1st resistance which acts as a pullback resistance.
Pivot: 0.6326
1st Support: 0.6274
1st Resistance: 0.6382
Risk Warning:
Trading Forex and CFDs carries a high level of risk to your capital and you should only trade with money you can afford to lose. Trading Forex and CFDs may not be suitable for all investors, so please ensure that you fully understand the risks involved and seek independent advice if necessary.
Disclaimer:
The above opinions given constitute general market commentary, and do not constitute the opinion or advice of IC Markets or any form of personal or investment advice.
Any opinions, news, research, analyses, prices, other information, or links to third-party sites contained on this website are provided on an "as-is" basis, are intended only to be informative, is not an advice nor a recommendation, nor research, or a record of our trading prices, or an offer of, or solicitation for a transaction in any financial instrument and thus should not be treated as such. The information provided does not involve any specific investment objectives, financial situation and needs of any specific person who may receive it. Please be aware, that past performance is not a reliable indicator of future performance and/or results. Past Performance or Forward-looking scenarios based upon the reasonable beliefs of the third-party provider are not a guarantee of future performance. Actual results may differ materially from those anticipated in forward-looking or past performance statements. IC Markets makes no representation or warranty and assumes no liability as to the accuracy or completeness of the information provided, nor any loss arising from any investment based on a recommendation, forecast or any information supplied by any third-party.
