AUDUSD Intra Day SetupAUDUSD has confirmed bullish momentum on the higher timeframes, with an intraday setup targeting the next 4-hour high.
AUDUSD

AUDUSD Will Move Higher! Long!
Take a look at our analysis for AUDUSD.
Time Frame: 12h
Current Trend: Bullish
Sentiment: Oversold (based on 7-period RSI)
Forecast: Bullish
The market is testing a major horizontal structure 0.638.
Taking into consideration the structure & trend analysis, I believe that the market will reach 0.645 level soon.
P.S
Please, note that an oversold/overbought condition can last for a long time, and therefore being oversold/overbought doesn't mean a price rally will come soon, or at all.
Like and subscribe and comment my ideas if you enjoy them!

NZDUSD Cup Pattern: Bullish Breakout Targeting 0.60NZDUSD is currently trading at 0.57 and forming a classic cup pattern, signaling a potential bullish continuation toward the 0.60 target. The cup pattern is a well-known technical formation that typically indicates a period of accumulation, followed by a breakout to the upside. If the price breaks above the resistance level at the cup’s rim, it could trigger strong buying momentum, pushing NZDUSD higher.
From a technical standpoint, the cup pattern suggests that the market has undergone a correction and is now regaining strength. A confirmed breakout above the neckline would validate the bullish setup, with 0.60 as the next major resistance level. Traders should watch for increasing volume and bullish candlestick confirmations to strengthen the breakout scenario.
Fundamentally, the New Zealand dollar’s movement depends on risk sentiment, US economic data, and Reserve Bank of New Zealand (RBNZ) policies. If the US dollar weakens due to expectations of Federal Reserve rate cuts or softer economic data, NZDUSD could gain additional upside momentum. Additionally, any hawkish signals from the RBNZ regarding inflation and interest rates could further support the bullish outlook.
In summary, NZDUSD is forming a bullish cup pattern, with a potential breakout targeting 0.60. A strong breakout above the resistance could accelerate the bullish move, supported by both technical patterns and fundamental factors. Traders should monitor global risk sentiment, US dollar trends, and RBNZ statements to confirm the momentum shift.

Bearish reversal?The Fiber (EUR/USD) is rising towards the pivot and could reverse to the pullback support.
Pivot: 0.6421
1st Support: 0.6377
1st Resistance: 0.6465
Risk Warning:
Trading Forex and CFDs carries a high level of risk to your capital and you should only trade with money you can afford to lose. Trading Forex and CFDs may not be suitable for all investors, so please ensure that you fully understand the risks involved and seek independent advice if necessary.
Disclaimer:
The above opinions given constitute general market commentary, and do not constitute the opinion or advice of IC Markets or any form of personal or investment advice.
Any opinions, news, research, analyses, prices, other information, or links to third-party sites contained on this website are provided on an "as-is" basis, are intended only to be informative, is not an advice nor a recommendation, nor research, or a record of our trading prices, or an offer of, or solicitation for a transaction in any financial instrument and thus should not be treated as such. The information provided does not involve any specific investment objectives, financial situation and needs of any specific person who may receive it. Please be aware, that past performance is not a reliable indicator of future performance and/or results. Past Performance or Forward-looking scenarios based upon the reasonable beliefs of the third-party provider are not a guarantee of future performance. Actual results may differ materially from those anticipated in forward-looking or past performance statements. IC Markets makes no representation or warranty and assumes no liability as to the accuracy or completeness of the information provided, nor any loss arising from any investment based on a recommendation, forecast or any information supplied by any third-party.

Bullish continuation?The Aussie (AUD/USD0 is falling towards the pivot which acts as a pullback support and could bounce to the 1st resistance.
Pivot: 0.6376
1st Support: 0.6331
1st Resistance: 0.6449
Risk Warning:
Trading Forex and CFDs carries a high level of risk to your capital and you should only trade with money you can afford to lose. Trading Forex and CFDs may not be suitable for all investors, so please ensure that you fully understand the risks involved and seek independent advice if necessary.
Disclaimer:
The above opinions given constitute general market commentary, and do not constitute the opinion or advice of IC Markets or any form of personal or investment advice.
Any opinions, news, research, analyses, prices, other information, or links to third-party sites contained on this website are provided on an "as-is" basis, are intended only to be informative, is not an advice nor a recommendation, nor research, or a record of our trading prices, or an offer of, or solicitation for a transaction in any financial instrument and thus should not be treated as such. The information provided does not involve any specific investment objectives, financial situation and needs of any specific person who may receive it. Please be aware, that past performance is not a reliable indicator of future performance and/or results. Past Performance or Forward-looking scenarios based upon the reasonable beliefs of the third-party provider are not a guarantee of future performance. Actual results may differ materially from those anticipated in forward-looking or past performance statements. IC Markets makes no representation or warranty and assumes no liability as to the accuracy or completeness of the information provided, nor any loss arising from any investment based on a recommendation, forecast or any information supplied by any third-party.

AUDUSD H4 | Bearish DropBased on the H4 chart analysis, we can see that the price is testing our sell entry at 0.6406, which is an overlap resistance that aligns with the 161.8% Fibo extension and the 61.8% Fibo projection, indicating a strong resistance level.
Our take profit will be at 0.6369, a pullback support level.
The stop loss will be placed at 0.6460, which is an overlap resistance level.
High Risk Investment Warning
Trading Forex/CFDs on margin carries a high level of risk and may not be suitable for all investors. Leverage can work against you.
Stratos Markets Limited (fxcm.com/uk):
CFDs are complex instruments and come with a high risk of losing money rapidly due to leverage. 63% of retail investor accounts lose money when trading CFDs with this provider. You should consider whether you understand how CFDs work and whether you can afford to take the high risk of losing your money.
Stratos Europe Ltd (fxcm.com/eu):
CFDs are complex instruments and come with a high risk of losing money rapidly due to leverage. 63% of retail investor accounts lose money when trading CFDs with this provider. You should consider whether you understand how CFDs work and whether you can afford to take the high risk of losing your money.
Stratos Trading Pty. Limited (fxcm.com/au):
Trading FX/CFDs carries significant risks. FXCM AU (AFSL 309763), please read the Financial Services Guide, Product Disclosure Statement, Target Market Determination and Terms of Business at fxcm.com/au
Stratos Global LLC (fxcm.com/markets):
Losses can exceed deposits.
Please be advised that the information presented on TradingView is provided to FXCM (‘Company’, ‘we’) by a third-party provider (‘TFA Global Pte Ltd’). Please be reminded that you are solely responsible for the trading decisions on your account. There is a very high degree of risk involved in trading. Any information and/or content is intended entirely for research, educational and informational purposes only and does not constitute investment or consultation advice or investment strategy. The information is not tailored to the investment needs of any specific person and therefore does not involve a consideration of any of the investment objectives, financial situation or needs of any viewer that may receive it. Kindly also note that past performance is not a reliable indicator of future results. Actual results may differ materially from those anticipated in forward-looking or past performance statements. We assume no liability as to the accuracy or completeness of any of the information and/or content provided herein and the Company cannot be held responsible for any omission, mistake nor for any loss or damage including without limitation to any loss of profit which may arise from reliance on any information supplied by TFA Global Pte Ltd.
The speaker(s) is neither an employee, agent nor representative of FXCM and is therefore acting independently. The opinions given are their own, constitute general market commentary, and do not constitute the opinion or advice of FXCM or any form of personal or investment advice. FXCM neither endorses nor guarantees offerings of third-party speakers, nor is FXCM responsible for the content, veracity or opinions of third-party speakers, presenters or participants.

AUDUSD - Look for a short !!Hello traders!
‼️ This is my perspective on AUDUSD.
Technical analysis: Here we are in a bearish market structure from 4H timeframe perspective, so I look for a short. As we can see price took buy side liquidity and now it's in bearish OB, I expect to see BOS on lower timeframe to open the trade.
Fundamental news: Upcoming week on Tuesday (GMT+2) we will see results of Cash Rate on AUD and on Thursday (GMT+2) we have Unemployment Rate. News with high impact on currency.
Like, comment and subscribe to be in touch with my content!

AUD/USD Triangle Breakout (19.2.25)The AUD/USD pair on the M30 timeframe presents a Potential Buying Opportunity due to a recent Formation of a Triangle Breakout Pattern. This suggests a shift in momentum towards the upside and a higher likelihood of further advances in the coming hours.
Possible Long Trade:
Entry: Consider Entering A Long Position around Trendline Of The Pattern.
Target Levels:
1st Resistance – 0.6391
2nd Resistance – 0.6404
🎁 Please hit the like button and
🎁 Leave a comment to support for My Post !
Your likes and comments are incredibly motivating and will encourage me to share more analysis with you.
Best Regards, KABHI_TA_TRADING
Thank you.

AUD/USD breaks to a new weekly highFollowing the RBA’s hawkish rate cut supports, we are continuing to see bullish AUD/USD price action.
Earlier this week, the RBA provided no clear easing bias, citing risks on both sides of the inflation outlook. While it acknowledged that the disinflationary process is progressing, a strong labour market has kept policymakers cautious. The central bank’s governor Bullock highlighted risks to inflation, saying we cannot declare victory on inflation yet.
Overnight, we had some strong labour market data that further supported the Aussie dollar, and just now we have seen rates break to a new weekly high.
From a technical standpoint, the trend has been bullish on the AUD/USD ever since forming a hammer candle around the 0.6130 area a couple of weeks ago. Since then, it has consistently printed bullish price action, keeping buyers in control.
Previous resistance at 0.6330 has now turned into support, keeping the path of least resistance to the upside. This has potentially paved the way for a run toward the 0.6500 handle in the next few days.
Ahead of that, the 38.2% Fibo level comes into focus as 0.6415 next.
On the downside, the 21-day exponential moving average at around 0.6280 serves as the next support in the event of a breakdown below the abovementioned 0.6330 level.
By Fawad Razaqzada, market analyst with FOREX.com

AUDUSD Bullish break-out signalThe AUDUSD pair has been trading within a Channel Up pattern for the whole month of February and since yesterday it is making a bounce on the 4H MA50 (blue trend-line).
Today it broke above the previous High and this is a bullish break-out signal. The previous Bullish Leg that rebounded on the 4H MA200 (orange trend-line) and broke above its previous High, targeted the 1.382 Fibonacci extension.
With the presence of an Inner Higher Highs trend-line, we expect the pair to hit the 1.382 Fib at 0.64250.
-------------------------------------------------------------------------------
** Please LIKE 👍, FOLLOW ✅, SHARE 🙌 and COMMENT ✍ if you enjoy this idea! Also share your ideas and charts in the comments section below! This is best way to keep it relevant, support us, keep the content here free and allow the idea to reach as many people as possible. **
-------------------------------------------------------------------------------
Disclosure: I am part of Trade Nation's Influencer program and receive a monthly fee for using their TradingView charts in my analysis.
💸💸💸💸💸💸
👇 👇 👇 👇 👇 👇

AUDUSD Long Setup 2/19/25 (Smart Money)Smart money trading is the method I use.
It utilizes market structure, liquidity, and supply/demand zones. From my image you can see the steps before a long setup possibly in NY session tomorrow.
Liquidity was taken and momentum has went for the upside, looking for a long setup at my 7th step.

#AUDUSD 1DAYAUDUSD (4H Timeframe) Analysis
Market Structure:
The price has been in a downtrend but has now broken above the downtrend resistance, signaling a potential shift in market direction. A breakout from this level suggests that buyers are gaining strength, possibly leading to further bullish movement.
Forecast:
A buy opportunity may arise as the breakout indicates a change in trend. Waiting for a retest of the breakout level for confirmation can provide a stronger entry point.
Key Levels to Watch:
- Entry Zone: A buy position can be considered after a successful breakout and retest of the previous resistance as support.
- Risk Management:
- Stop Loss: Placed below the breakout level to minimize risk.
- Take Profit: Target key resistance zones where price may face selling pressure.
Market Sentiment:
The breakout of the downtrend resistance suggests that bullish momentum is increasing. A confirmed retest with strong price action can provide better confirmation for an upward move.

Falling towards 50% Fibonacci support?AUD/USD is falling towards the support level which is a pullback support that lines up with the 50% Fibonacci retracement and could bounce from this level to our take profit.
Entry: 0.6304
Why we like it:
There is a pullback support level that aligns with the 50% Fibonacci retracement.
Stop loss: 0.6254
Why we like it:
There is a pullback support level that is slightly below the 38.2% Fibonacci retracement.
Take profit: 0.6375
Why we like it:
There is a pullback resistance level.
Enjoying your TradingView experience? Review us!
Please be advised that the information presented on TradingView is provided to Vantage (‘Vantage Global Limited’, ‘we’) by a third-party provider (‘Everest Fortune Group’). Please be reminded that you are solely responsible for the trading decisions on your account. There is a very high degree of risk involved in trading. Any information and/or content is intended entirely for research, educational and informational purposes only and does not constitute investment or consultation advice or investment strategy. The information is not tailored to the investment needs of any specific person and therefore does not involve a consideration of any of the investment objectives, financial situation or needs of any viewer that may receive it. Kindly also note that past performance is not a reliable indicator of future results. Actual results may differ materially from those anticipated in forward-looking or past performance statements. We assume no liability as to the accuracy or completeness of any of the information and/or content provided herein and the Company cannot be held responsible for any omission, mistake nor for any loss or damage including without limitation to any loss of profit which may arise from reliance on any information supplied by Everest Fortune Group.

AUDUSD Potential UpsidesHey Traders, in today's trading session we are monitoring AUDUSD for a buying opportunity around 0.63200 zone, AUDUSD is trading in an uptrend and currently is in a correction phase in which it is approaching the trend at 0.63200 support and resistance area.
Trade safe, Joe.

AUD/USD Trades Near Year’s High After RBA DecisionAUD/USD Trades Near Year’s High After RBA Decision
Today, the Reserve Bank of Australia (RBA) eased monetary policy, cutting the interest rate from 4.35% to 4.10%, according to Forex Factory.
As reported by Reuters:
→ This marks the first easing since the 2020 pandemic;
→ RBA Governor Michele Bullock stated that market expectations for two more cuts this year are “ambitious”;
→ The bank’s leadership remains cautious about further easing prospects.
While analysts had accurately predicted the February rate cut, AUD/USD saw volatility without a significant move, possibly because market participants are more focused on Trump’s tariff plans, which could impact global trade and Forex markets.
Technical Analysis of AUD/USD Today
Since mid-December, the AUD/USD pair has mostly traded within the 0.6200–0.6300 range, except for early February’s sharp drop when Trump’s tariff policies shook currency markets.
However, demand appears resilient:
→ After plunging to around 0.6100, the price quickly rebounded into the range;
→ Arrows highlight rapid recoveries after short-term dips;
→ A blue ascending trend channel is forming on the chart.
These factors suggest growing appeal for the Australian dollar, with the 0.6300 level potentially acting as support going forward.
Trade on TradingView with FXOpen. Consider opening an account and access over 700 markets with tight spreads from 0.0 pips and low commissions from $1.50 per lot.
This article represents the opinion of the Companies operating under the FXOpen brand only. It is not to be construed as an offer, solicitation, or recommendation with respect to products and services provided by the Companies operating under the FXOpen brand, nor is it to be considered financial advice.

AUD/USD BEARS ARE STRONG HERE|SHORT
Hello, Friends!
AUD-USD uptrend evident from the last 1W green candle makes short trades more risky, but the current set-up targeting 0.625 area still presents a good opportunity for us to sell the pair because the resistance line is nearby and the BB upper band is close which indicates the overbought state of the AUD/USD pair.
✅LIKE AND COMMENT MY IDEAS✅

AUDUSD Bullish AUD/USD has successfully broken a strong resistance level, signaling bullish momentum. After the breakout, we may see a retracement to the previous resistance area, which could now act as support before the next leg up. If buyers continue stepping in, further upside movement is expected.
🔹 Key Levels to Watch:
✅ Support: Retesting the previous resistance zone
✅ Bullish Confirmation: Holding above support could fuel further upside
Always follow proper risk management and wait for confirmation before entering trades

The RBA just cut by 25bp: Instant ViewThe RBA have just cut their cash rate for the first time since late 2020. Using their monetary policy statement and updated forecast, I provide my instant high-level view of what this could mean fir future policy - with an update to my AUD/USD outlook thrown in for good measure.
Matt Simpson, Market Analyst at City Index and Forex.com

Falling towards 50% Fibonacci support?The Aussie (AUD/USD) is falling towards the pivot which has been identified as a pullback support and could bounce to the 1st resistance which acts as a pullback resistance.
Pivot: 0.6301
1st Support: 0.6259
1st Resistance: 0.6376
Risk Warning:
Trading Forex and CFDs carries a high level of risk to your capital and you should only trade with money you can afford to lose. Trading Forex and CFDs may not be suitable for all investors, so please ensure that you fully understand the risks involved and seek independent advice if necessary.
Disclaimer:
The above opinions given constitute general market commentary, and do not constitute the opinion or advice of IC Markets or any form of personal or investment advice.
Any opinions, news, research, analyses, prices, other information, or links to third-party sites contained on this website are provided on an "as-is" basis, are intended only to be informative, is not an advice nor a recommendation, nor research, or a record of our trading prices, or an offer of, or solicitation for a transaction in any financial instrument and thus should not be treated as such. The information provided does not involve any specific investment objectives, financial situation and needs of any specific person who may receive it. Please be aware, that past performance is not a reliable indicator of future performance and/or results. Past Performance or Forward-looking scenarios based upon the reasonable beliefs of the third-party provider are not a guarantee of future performance. Actual results may differ materially from those anticipated in forward-looking or past performance statements. IC Markets makes no representation or warranty and assumes no liability as to the accuracy or completeness of the information provided, nor any loss arising from any investment based on a recommendation, forecast or any information supplied by any third-party.

AUD/USD: Australian Dollar Strengthens Ahead of RBA DesicionThe Australian dollar has been rising, gaining around 1.5% over the past three sessions against the U.S. dollar. The current bullish movement continues as the market awaits the Reserve Bank of Australia's (RBA) decision in the coming hours. The RBA is expected to cut interest rates by 25 basis points , bringing the new rate to 4.1%.
However, the market has already priced in this decision, as expectations for a rate cut have been consistent for several days. This has allowed upward momentum to persist, as any bearish reaction to the RBA's move may have already been absorbed into the price.
Additionally, as the trade war between the U.S. and China escalates, Australia's economic ties with China have strengthened, boosting confidence in the region and supporting a bullish outlook for the Australian dollar.
Breakout from Sideways Range
Until recently, AUD/USD had been trading within a key range, with resistance at 0.62923 and support at 0.61929. But the recent bullish move has broken through this resistance, leading to stronger buying pressure in the short term.
As long as price remains above the upper boundary of this range, the Australian dollar could maintain its upward momentum in the near term.
RSI Indicator: Overbought Signals?
Not everything is bullish, as the RSI indicator is now approaching 70, the overbought zone.
If the RSI remains above this level for the next few sessions, it could signal an imbalance between buyers and sellers, as well as the potential for short-term selling corrections.
Key Levels to Watch:
0.61929 – Distant Support: Lower boundary of the previous range.
Frequent price oscillations at this level could revive the previous downtrend seen since September 2024.
0.62923 – Key Support: Aligns with the Ichimoku Cloud barrier and the 50-period Simple Moving Average (SMA).
A tentative level where short-term bearish corrections could occur.
0.64323 – Major Resistance: Corresponds to the 38.2% Fibonacci retracement level.
If the bullish bias pushes price toward this level, it could signal the beginning of a stronger uptrend in the short term.
By Julian Pineda, CFA – Market Analyst

#AUDUSD 4HAUDUSD (4H Timeframe) Analysis
Market Structure:
The price is forming an expanding pattern, indicating increased volatility and uncertainty in market direction. Additionally, a sell engulfing candlestick has appeared, suggesting strong bearish momentum and potential downside movement.
Forecast:
A sell opportunity is anticipated as the expanding pattern, combined with the sell engulfing area, signals increased selling pressure.
Key Levels to Watch:
- Entry Zone: A sell position can be considered near the recent resistance area where the sell engulfing pattern has formed.
- Risk Management:
- Stop Loss: Placed above the recent swing high to manage risk.
- Take Profit: Target lower support levels for potential downside movement.
Market Sentiment:
The formation of an expanding pattern with a sell engulfing candlestick suggests that bearish pressure is increasing. Monitoring price action and confirmation signals before entry will help align with the prevailing trend.

RBA Poised to Reduce Cash Rate by 25 Basis PointsThe Reserve Bank of Australia (RBA) will meet this Tuesday and is widely anticipated to deliver its first rate cut in four years amid easing inflationary pressures. I am ‘reasonably’ convinced that the central bank will reduce the Cash Rate this week, a belief based on inflation and growth data that delivered prints south of the RBA’s recent projections (released on 5 November 2024).
Following nine consecutive meetings on hold, markets are pricing in a 90% probability that the RBA will reduce the Cash Rate by 25 basis points (bps) to 4.10% from 4.35% (per the ASX 30-Day Interbank Cash Rate futures). Markets are also pricing for an additional 50 bps of cuts by the year-end, lowering the Cash Rate to 3.6%.
I am not holding my breath for anything illuminating to come out of the RBA’s accompanying rate statement and press conference. I believe we will see the Board underscore a cautious tone, echoing the ‘data dependent’ approach. The central bank will likely shine the spotlight on the disinflation progress but stop short of providing anything concrete to signal further cuts.
The RBA will also release their detailed quarterly updated forecasts on growth (GDP ), unemployment, inflation, and the Cash Rate. Traders will look at these metrics closely for any revisions. I expect slightly lower revisions to GDP and inflation, but I do not see much change in forecasts for the Cash Rate.
Inflation and GDP: Main Drivers Behind a Rate Cut
In Q2 24, headline Australian inflation came in lower than expected, decelerating to 2.4% (from 2.8% in Q3 24) and marking the lowest quarterly reading since early 2021. This not only places headline inflation within the lower boundary of the RBA’s inflation target band of 2-3%, but the trimmed mean inflation rate – the RBA’s preferred measure of underlying inflation – also exhibited signs of softness, cooling to within touching distance of the RBA’s upper target band (3.0%) at 3.2% in Q4 24 (year-on-year ) from 3.5% in Q3 24.
GDP cooled to 0.8% in Q3 24 (YY), down from 1.0% in Q2 24 and marked the slowest pace of economic growth since late 2020. Quarterly (Q3 24), GDP grew by 0.3%, following a slight increase of 0.2% in the previous quarter (Q2 24).
However, while inflation is trending in the right direction and growth remains subdued – providing some legroom for the RBA to cut the Cash Rate this week – the central bank’s easing cycle will likely be slow and steady this year. Coupled with underlying inflation trending just north of the RBA’s inflation target, the central bank still faces a reasonably solid jobs market. Employment increased by 56,300, comfortably surpassing the market’s median estimate of 15,000 and was above November’s revised reading of 28,200, and wage growth remains steady.
AUD/USD Shaking Hands with Resistance
The AUD/USD currency pair (Australian dollar versus the US dollar) finished last week locking horns with daily resistance between US$0.6417 and US$0.6364 (this area comprises several ratios , a horizontal resistance level, and an ascending resistance extended from US$0.6170).
What is also interesting is the approach to the above-noted resistance could prompt sellers to enter the fray this week. Following a lower low of US$0.6088 in early February, this likely encouraged breakout selling. With these orders now flushed out of the market (bear trap) and the recent higher high (US$0.6368) potentially exciting buyers, this, coupled with price testing resistance last week, could be a bull trap in the making to push things lower.

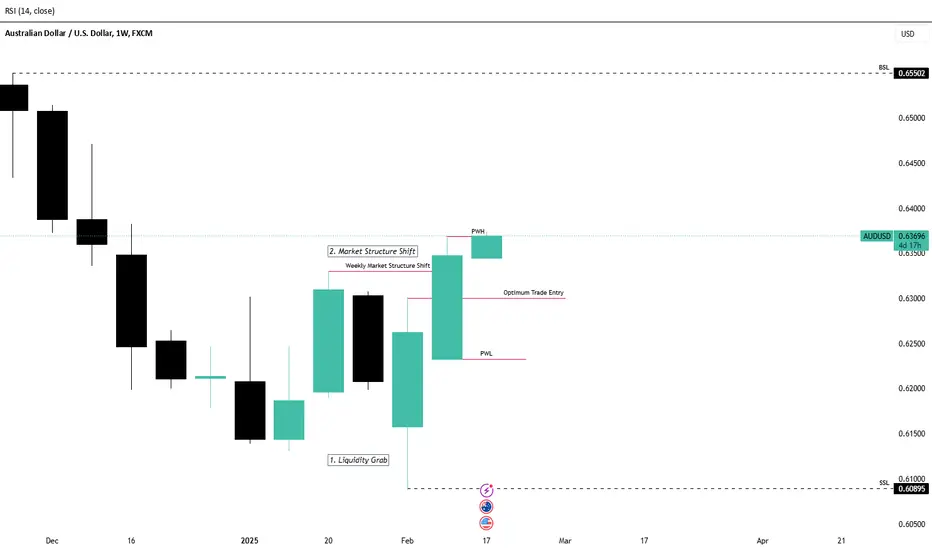
AUDUSD Weekly BiasThis pair is now on a bullish run considering that;
1. We had a liquidity grab at 0.61 Zone.
2. Market Structure Shift at 0.633.
The pair might aim towards the Buyside Liquidity at 0.655 and our entry positions might be around the 0.63 Zone.