AUD-USD Bullish Breakout! Buy!
Hello,Traders!
AUD-USD is making a
Bullish move up and the
Pair made a bullish breakout
Of the key horizontal level
Of 0.6310 and the breakout
Is confirmed so we are bullish
Biased and we will be expecting
A further bullish move up
Buy!
Comment and subscribe to help us grow!
Check out other forecasts below too!
AUDUSD

AUDUSD analysisAUDUSD 0.6366 hit the trendline and was rejected. It is going to cool off a bit. Meanwhile, I think DXY will retrace a bit as well ( Going up ). Those are my thoughts.

AUDUSD Is Close To The Daily ResistanceHey Traders, in today's trading session we are monitoring AUDUSD for a selling opportunity around 0.64000 zone, AUDUSD is trading in a downtrend and currently is in a correction phase in which it is approaching the trend at 0.64000 support and resistance area.
Trade safe, Joe.

Watch NZDUSD and AUDUSD because of RBNZ & RBA next weekThe RBA and the RBNZ are expected to deliver rate decisions next week, so there might be an slight opportunity for the bulls to capture a move higher, before those Banks deliver. Also, the current weakness in DXY could give a small helping hand for the bulls. That said, the positivity might be short-lived, as both Banks are expected to announce cuts, with the RBNZ potentially going for the bigger 50 bps cut.
Let's see what happens.
MARKETSCOM:AUDUSD
MARKETSCOM:NZDUSD
FX_IDC:AUDUSD
FX_IDC:NZDUSD
74.2% of retail investor accounts lose money when trading CFDs with this provider. You should consider whether you understand how CFDs work and whether you can afford to take the high risk of losing your money. Past performance is not necessarily indicative of future results. The value of investments may fall as well as rise and the investor may not get back the amount initially invested. This content is not intended for nor applicable to residents of the UK. Cryptocurrency CFDs and spread bets are restricted in the UK for all retail clients.

AUDUSDAUDUSD price is near the resistance zone 0.63238-0.63289. If the price cannot break through the 9.63289 level, it is expected that the price will drop in the short term. Consider selling the red zone.
🔥Trading futures, forex, CFDs and stocks carries a risk of loss.
Please consider carefully whether such trading is suitable for you.
>>GooD Luck 😊
❤️ Like and subscribe to never miss a new idea!

Buy the Dips? AUD/USD Eyes 0.65 After BreakoutAs mentioned, I remain bullish on AUD/USD and expect a rise to 0.65.
Over the past 10 days, the pair has remained virtually unchanged, fluctuating within a tight 50-pip range between 0.6250 and 0.63. However, yesterday, AUD/USD showed some strength and broke above 0.63.
I believe this breakout is genuine, and we could see further acceleration to the upside. My target remains 0.65, and I will stay bullish as long as the 0.62 zone holds.
Buying dips should continue to be the preferred strategy.
Disclosure: I am part of Trade Nation's Influencer program and receive a monthly fee for using their TradingView charts in my analysis.

AUDUSD MMT Entry Model Perfect Example?AUDUSD MMT Entry Model Perfect Example?AUDUSD MMT Entry Model Perfect Example?AUDUSD MMT Entry Model Perfect Example?AUDUSD MMT Entry Model Perfect Example?AUDUSD MMT Entry Model Perfect Example?AUDUSD MMT Entry Model Perfect Example?AUDUSD MMT Entry Model Perfect Example?AUDUSD MMT Entry Model Perfect Example?AUDUSD MMT Entry Model Perfect Example?AUDUSD MMT Entry Model Perfect Example?AUDUSD MMT Entry Model Perfect Example?AUDUSD MMT Entry Model Perfect Example?AUDUSD MMT Entry Model Perfect Example?AUDUSD MMT Entry Model Perfect Example?AUDUSD MMT Entry Model Perfect Example?AUDUSD MMT Entry Model Perfect Example?AUDUSD MMT Entry Model Perfect Example?AUDUSD MMT Entry Model Perfect Example?AUDUSD MMT Entry Model Perfect Example?AUDUSD MMT Entry Model Perfect Example?AUDUSD MMT Entry Model Perfect Example?AUDUSD MMT Entry Model Perfect Example?

AUDUSD Potential DownsidesHey Traders, in today's trading session we are monitoring AUDUSD for a selling opportunity around 0.62700 zone, AUDUSD is trading in a downtrend and currently is in correction phase in which it is approaching the trend at 0.62700 support and resistance area.
Trade safe, Joe.

Scenario on AUDUSD 13.2.2025I would see AUDUSD like this, if it were to be a short, then the first place I would be willing to enter is the sfp above the high around poc 0.63378 long positions are the first acceptable until the sfp around the support at the level of 0.616-0.613 and then only after the building sfp

AUDUSD sideways consolidation continuesThe AUDUSD currency pair price action sentiment appears bearish, supported by the longer-term prevailing downtrend. However, the recent price action since 24th December 2024, appears to be protracted sideways consolidation.
The key trading level is at 0.6311, which is the current swing high. An oversold rally from the current levels and a bearish rejection from the 0.6311 level could target the downside support at 0.6220 followed by 0.6183 and 0.6163 levels over the longer timeframe.
Alternatively, a confirmed breakout above 0.6311 resistance and a daily close above that level would negate the bearish outlook opening the way for further rallies higher and a retest of 0.6330 resistance level followed by 0.6350.
This communication is for informational purposes only and should not be viewed as any form of recommendation as to a particular course of action or as investment advice. It is not intended as an offer or solicitation for the purchase or sale of any financial instrument or as an official confirmation of any transaction. Opinions, estimates and assumptions expressed herein are made as of the date of this communication and are subject to change without notice. This communication has been prepared based upon information, including market prices, data and other information, believed to be reliable; however, Trade Nation does not warrant its completeness or accuracy. All market prices and market data contained in or attached to this communication are indicative and subject to change without notice.

Australian dollar drifting after mixed confidence dataThe Australian dollar is showing little movement on Tuesday. In the European session, AUD/USD is trading at 0.6279, up 0.05% on the day.
Australian confidence indicators were mixed on Tuesday. The Westpac consumer sentiment index climbed 0.1% in February to 92.2 points, which means a majority of the surveyed consumers were pessimistic about econmic conditions. The reading bounced back from a 0.7% decline in January but was shy of the forecast of 0.4%. Consumer confidence remains weak as consumers have been squeezed by high inflation and elevated interest rates. The survey noted that consumers have become more confident that the central bank will lower rates.
The National Australia Bank's (NAB) business confidence index, which rose 6 points in January to +4. However, business conditions index dropped to +3 from +6 a month earlier, as profitability and employment weakened. The NAB survey noted that retail spending has improved and this trend would need to continue if business conditions were to improve.
The mixed confidence numbers come just one week before a crucial Reserve Bank of Australia meeting. A rate cut is virtually certain at the meeting, which would mark the RBA's first rate cut since Nov. 2020. The RBA is yet to join the easing cycle which other major central banks have implemented as inflation has fallen.
The Federal Reserve is widely expected to continue to maintain interest rates at the March meeting. The US economy remains robust and the labor market has slowed gradually, which means there isn't much pressure on Fed policy makers to lower rates in the coming months. Barring unexpected economic news, the Fed is expected to cut rates no more than one or two times in 2025.
AUD/USD tested support at 0.6267 earlier. Below, there is support at 0.6245
There is resistance at 0.6299 and 0.6321

AUD/USD SHORT FROM RESISTANCE
Hello, Friends!
AUD/USD pair is in the uptrend because previous week’s candle is green, while the price is evidently rising on the 1D timeframe. And after the retest of the resistance line above I believe we will see a move down towards the target below at 0.611 because the pair overbought due to its proximity to the upper BB band and a bearish correction is likely.
✅LIKE AND COMMENT MY IDEAS✅

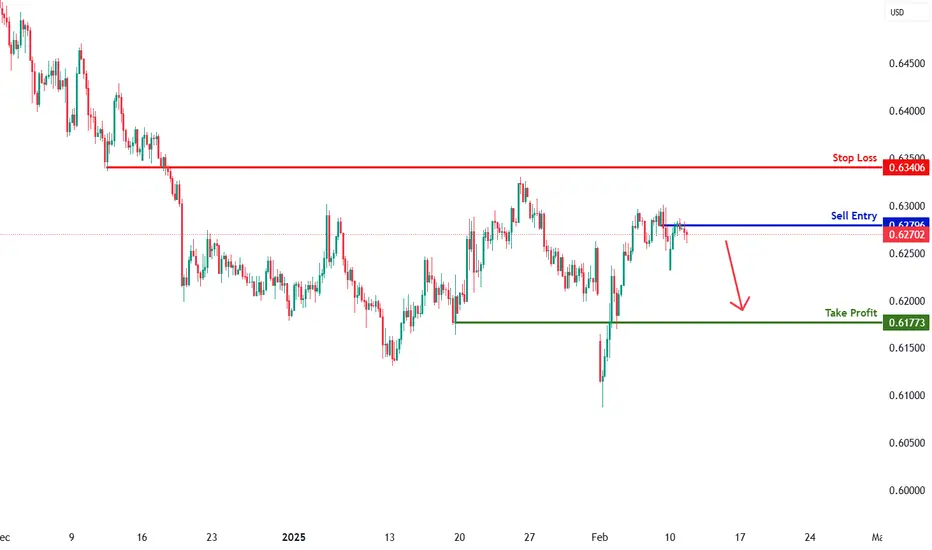
AUDUSD H4 | Bearish DropBased on the H4 chart analysis, we can see that the price has just reacted off our sell entry at 0.6279, which is an overlap resistance.
Our take profit will be at 0.6177, an overlap support level.
The stop loss will be placed at 0.6340, which is a pullback resistance level.
High Risk Investment Warning
Trading Forex/CFDs on margin carries a high level of risk and may not be suitable for all investors. Leverage can work against you.
Stratos Markets Limited (fxcm.com/uk):
CFDs are complex instruments and come with a high risk of losing money rapidly due to leverage. 63% of retail investor accounts lose money when trading CFDs with this provider. You should consider whether you understand how CFDs work and whether you can afford to take the high risk of losing your money.
Stratos Europe Ltd (fxcm.com/eu):
CFDs are complex instruments and come with a high risk of losing money rapidly due to leverage. 63% of retail investor accounts lose money when trading CFDs with this provider. You should consider whether you understand how CFDs work and whether you can afford to take the high risk of losing your money.
Stratos Trading Pty. Limited (fxcm.com/au):
Trading FX/CFDs carries significant risks. FXCM AU (AFSL 309763), please read the Financial Services Guide, Product Disclosure Statement, Target Market Determination and Terms of Business at fxcm.com/au
Stratos Global LLC (fxcm.com/markets):
Losses can exceed deposits.
Please be advised that the information presented on TradingView is provided to FXCM (‘Company’, ‘we’) by a third-party provider (‘TFA Global Pte Ltd’). Please be reminded that you are solely responsible for the trading decisions on your account. There is a very high degree of risk involved in trading. Any information and/or content is intended entirely for research, educational and informational purposes only and does not constitute investment or consultation advice or investment strategy. The information is not tailored to the investment needs of any specific person and therefore does not involve a consideration of any of the investment objectives, financial situation or needs of any viewer that may receive it. Kindly also note that past performance is not a reliable indicator of future results. Actual results may differ materially from those anticipated in forward-looking or past performance statements. We assume no liability as to the accuracy or completeness of any of the information and/or content provided herein and the Company cannot be held responsible for any omission, mistake nor for any loss or damage including without limitation to any loss of profit which may arise from reliance on any information supplied by TFA Global Pte Ltd.
The speaker(s) is neither an employee, agent nor representative of FXCM and is therefore acting independently. The opinions given are their own, constitute general market commentary, and do not constitute the opinion or advice of FXCM or any form of personal or investment advice. FXCM neither endorses nor guarantees offerings of third-party speakers, nor is FXCM responsible for the content, veracity or opinions of third-party speakers, presenters or participants.
Levels discussed on Livestream 10th Feb 202510th Feb 2025
DXY: Could trade down to 108 (or consolidate here) before climbing higher to 108.90 or 109 (61.8%).
NZDUSD: Sell 0.5620 SL 20 TP 70 (hesitation at 0.5580)
AUDUSD: In abit of a range, look for test and reaction at 0.6363 resistance level.
GBPUSD: Sell 1.2350 SL 30 TP 85 (watch the trendline)
EURUSD: Sell 1.0290 SL 25 TP 65
USDJPY: Buy 152.40 SL 40 TP 80
EURJPY: Sell 156.25 SL 40 TP 80
GBPJPY: Buy 189.70 SL 60 TP 200
USDCHF: Do nothing, middle of S/R
USDCAD: Buy 1.44 SL 30 TP 60
XAUUSD: Retracing now, needs to stay above 2870, could trade up to 2910

Australia dollar eyes confidence dataThe Australian dollar has started the week with gains. In the North American session, AUD/USD is trading at 0.6275, up 0.60% on the day.
Australia releases business and consumer confidence on Tuesday, with the markets expecting some improvement. Westpac Consumer Sentiment is expected to rebound and gain 0.4% in February after a 0.7% decline in January. The National Australian Bank business confidence index is projected to improve to zero in January, after a -2 reading in December.
China's inflation was a mix, as consumer inflation rose to a five-month high while producer inflation continued to decline. CPI jumped 0.5% y/y in January, up from 0.1% in December and above the market estimate of 0.4%. This was the highest level since August. Monthly CPI rose 0.7%, up sharply from zero in December and an 11-month high, but shy of the market estimate of 0.8%
The producer price index fell 2.3% y/y in January unchanged from December and deeper than the market estimate of 2.1%. This points to deflation which is likely to worsen if the trade war between the US and China continues. On Monday, China's retaliatory tariffs kicked in after the US hit China with tariffs last week.
US nonfarm payrolls decelerate, unemployment falls
US nonfarm payrolls eased to 143 thousand in January, shy of the market estimate of 175 thousand. Still, there weres signs of strength in the labor market - nonfarm payrolls were revised by 100 thousand in the previous two months and the unemployment rate ticked lower to 4% from 4.1%, below the market estimate of 4.1%.
Average hourly earnings rose 0.5%, up from 0.3% in December and above the market estimate of 0.5%. Annually, average hourly earnings rose 4.1%, unchanged from the revised December reading and above the market estimate of 3.8%. The generally positive employment report supports the case for the Federal Reserve continuing to hold rates, possibly until the third quarter. Just a few months ago, it appeared that the Fed would stay aggressive and continue lowering rates into 2025, but with the economy purring along we might see only one or two rate cuts this year.
There is resistance at 0.6351 and 0.6430
There is support at 0.6220 and 0.6141

AUD/USD Breakout Watch: Bullish Continuation or False Alarm?The AUD/USD pair is trading in a consolidation zone after breaking above a key descending trendline, signaling bullish momentum.
The price has retested the breakout level, turning resistance into support, strengthening the outlook. With the RSI at 51.32, holding above 0.6200 could push the price toward 0.6400, with a target near 0.6700.
A drop below this level may trigger a pullback.

XAU/USD : Possible Correction Ahead? (READ THE CAPTION)By analyzing the gold chart on the 30-minute timeframe, we can see that after yesterday's last analysis, the price corrected to $2858 as expected. However, it quickly rebounded, surging 240 pips to reach a new all-time high at $2882!
Today, we finally witnessed some correction from $2882 down to $2848, and gold is currently trading around $2868. If the price manages to stabilize below $2873.5 and experiences a strong rejection from this level, we might even see a correction down to levels below $2850.
With increased market volatility and key macroeconomic events on the horizon, traders should stay cautious. Price action around these levels will be critical in determining the next move, as gold continues to react to fundamental drivers such as inflation data and geopolitical developments. Monitoring price behavior near support and resistance levels will be essential for identifying potential trade opportunities.
Please support me with your likes and comments to motivate me to share more analysis with you and share your opinion about the possible trend of this chart with me !
Best Regards , Arman Shaban

Market Analysis: AUD/USD Rebound: Signs of Trend Shift?Market Analysis: AUD/USD Rebound: Signs of Trend Shift?
AUD/USD started a decent increase above the 0.6200 and 0.6240 levels.
Important Takeaways for AUD USD Analysis Today
- The Aussie Dollar rebounded after forming a base above the 0.6100 level against the US Dollar.
- There was a break below a connecting bullish trend line with support at 0.6255 on the hourly chart of AUD/USD at FXOpen.
AUD/USD Technical Analysis
On the hourly chart of AUD/USD at FXOpen, the pair started a fresh increase from the 0.6090 support. The Aussie Dollar was able to clear the 0.6170 resistance to move into a positive zone against the US Dollar.
There was a close above the 0.6240 resistance and the 50-hour simple moving average. Finally, the pair tested the 0.6300 zone. A high was formed near 0.6301 and the pair recently saw a minor pullback.
There was a move below the 0.6300 level. The pair declined below the 23.6% Fib retracement level of the upward move from the 0.6088 swing low to the 0.6301 high. Besides, there was a break below a connecting bullish trend line with support at 0.6255.
On the downside, initial support is near the 0.6240 level. The next major support is near the 0.6195 zone or the 50% Fib retracement level of the upward move from the 0.6088 swing low to the 0.6301 high.
If there is a downside break below the 0.6195 support, the pair could extend its decline toward the 0.6170 level. Any more losses might signal a move toward 0.6090.
On the upside, the AUD/USD chart indicates that the pair is now facing resistance near 0.6270. The first major resistance might be 0.6300. An upside break above the 0.6300 resistance might send the pair further higher.
The next major resistance is near the 0.6335 level. Any more gains could clear the path for a move toward the 0.6380 resistance zone.
Trade on TradingView with FXOpen. Consider opening an account and access over 700 markets with tight spreads from 0.0 pips and low commissions from $1.50 per lot.
This article represents the opinion of the Companies operating under the FXOpen brand only. It is not to be construed as an offer, solicitation, or recommendation with respect to products and services provided by the Companies operating under the FXOpen brand, nor is it to be considered financial advice.

10.02.25 Morning ForecastPairs on Watch -
FX:NZDUSD
FX:AUDUSD
FX:USDCAD
A short overview of the instruments I am looking at for today, multi-timeframe analysis down to what I will be looking at for an entry. Enjoy!

Bearish reversal?The Aussie (AUD/USD) is reacting off the pivot which has been identified as an overlap resistance and could drop to the 1st support.
Pivot: 0.6304
1st Support: 0.6098
1st Resistance: 0.6393
Risk Warning:
Trading Forex and CFDs carries a high level of risk to your capital and you should only trade with money you can afford to lose. Trading Forex and CFDs may not be suitable for all investors, so please ensure that you fully understand the risks involved and seek independent advice if necessary.
Disclaimer:
The above opinions given constitute general market commentary, and do not constitute the opinion or advice of IC Markets or any form of personal or investment advice.
Any opinions, news, research, analyses, prices, other information, or links to third-party sites contained on this website are provided on an "as-is" basis, are intended only to be informative, is not an advice nor a recommendation, nor research, or a record of our trading prices, or an offer of, or solicitation for a transaction in any financial instrument and thus should not be treated as such. The information provided does not involve any specific investment objectives, financial situation and needs of any specific person who may receive it. Please be aware, that past performance is not a reliable indicator of future performance and/or results. Past Performance or Forward-looking scenarios based upon the reasonable beliefs of the third-party provider are not a guarantee of future performance. Actual results may differ materially from those anticipated in forward-looking or past performance statements. IC Markets makes no representation or warranty and assumes no liability as to the accuracy or completeness of the information provided, nor any loss arising from any investment based on a recommendation, forecast or any information supplied by any third-party.

AUD_USD WILL FALL|SHORT|
✅AUD_USD made a retest
Of the strong horizontal resistance
Level of 0.6300 just as we expected
And the pair formed a double top
Pattern so we are locally bearish
Biased and we will be expecting
A local bearish move down
SHORT🔥
✅Like and subscribe to never miss a new idea!✅

AUDUSD Has it found Support?The AUDUSD pair gave us an excellent sell signal on our September 18 2024 bearish call (see chart below), which went straight to the 0.63750 Target within the time-frame we expected:
This time we are looking at a potential Support rebound as the price appears to have made a bottom on the 2-year Channel Down Lower Lows trend-line. Based on the upcoming 1W MACD Bullish Cross and the 1D RSI symmetrical positioning, we might be starting a rally similar to October 31 2023 during the last Lower Low.
This rose by +3.82% before pulling back to the 1D MA50 (blue trend-line) again, so our short-term Target is 0.63500. Beyond that, we need to observe whether the 1D MA200 (orange trend-line holds or not, in order to engage in buying break-outs.
-------------------------------------------------------------------------------
** Please LIKE 👍, FOLLOW ✅, SHARE 🙌 and COMMENT ✍ if you enjoy this idea! Also share your ideas and charts in the comments section below! This is best way to keep it relevant, support us, keep the content here free and allow the idea to reach as many people as possible. **
-------------------------------------------------------------------------------
💸💸💸💸💸💸
👇 👇 👇 👇 👇 👇

AUDUSD LONG: ISM SERVICES PMI ON TAPUS January ISM services 52.8 vs 54.3 expected. This indicates a slowdown in the US service sector. The service sector in the United States includes many industries that provide services to consumers, such as financial services, education, healthcare, entertainment, technology, construction, and housekeeping. As a result, we expect the dollar to become weaker than the Australian dollar.
