The Friday Forecast; Best Setups Frr Feb 7This market outlook will cover 15 markets:
ES \ S&P 500
NQ | NASDAQ 100
YM | Dow Jones 30
GC |Gold
SiI | Silver
PL | Platinum
HG | Copper
USD Index
EURUSD
GBPUSD
AUDUSD
NZDUSD
CAD, USDCAD
CHF, USDCHF
JPY, USDJPY
Non Farm Payroll news tomorrow! This is likely to inject a lot of volatility into the markets.
I recommend to wait until after the news is announced before executing on any trades. You never know where the market will go!
Enjoy!
May profits be upon you.
Leave any questions or comments in the comment section.
I appreciate any feedback from my viewers!
Like and/or subscribe if you want more accurate analysis.
Thank you so much!
Disclaimer:
I do not provide personal investment advice and I am not a qualified licensed investment advisor.
All information found here, including any ideas, opinions, views, predictions, forecasts, commentaries, suggestions, expressed or implied herein, are for informational, entertainment or educational purposes only and should not be construed as personal investment advice. While the information provided is believed to be accurate, it may include errors or inaccuracies.
I will not and cannot be held liable for any actions you take as a result of anything you read here.
Conduct your own due diligence, or consult a licensed financial advisor or broker before making any and all investment decisions. Any investments, trades, speculations, or decisions made on the basis of any information found on this channel, expressed or implied herein, are committed at your own risk, financial or otherwise.
AUDUSD

AUD-USD Strong Resistance! Sell!
Hello,Traders!
AUD-USD went up sharply
From the lows but will soon
Hit a horizontal resistance
Level of 0.6324 from where
We will be expecting a local
Bearish correction
Sell!
Comment and subscribe to help us grow!
Check out other forecasts below too!

XAU/USD: A Possible Correction? (Read the caption.)Analyzing the gold chart on the 30-minute timescale reveals that, as expected, the price corrected to $2858 following yesterday's study. However, it rapidly recovered, gaining 240 pips to set a new all-time high of $2882.
Today, we finally had a pullback from $2882 to $2848, and gold is currently trading around $2868. If the market manages to stabilize below $2873.5 and is strongly rejected from this level, we may witness a fall down to depths under $2850.
With increasing market volatility and important macroeconomic events on the horizon, traders should exercise caution. Price activity near these levels will be key in deciding the next move, as gold responds to fundamental variables such as inflation data and geopolitical developments. Monitoring price activity near support and resistance levels will be critical for spotting potential trading opportunities.
Please support me with your likes and comments to encourage me to share more analysis with you and share your thoughts on the potential trend of this chart with me!
By Nexus Trades Zone

AUD/USD may fall to 0.62459 - 0.62313Preference
Short positions below 0.62971 with targets at 0.62459 and 0.62313 in extension.
Alternative
If above 0.62971 look for further upside with 0.63103 and 0.63260 as targets.

Levels discussed on Livestream 5th Feb 20255th Feb 2025
DXY: Trading lower, needs to break 107.50 to retest 107 round number support level.
NZDUSD: Wait and look for reaction at 0.57 resistance area
AUDUSD: Buy 0.6280 SL 25 TP 80 (hesitation at 0.6325)
GBPUSD: Buy 1.2530 SL 30 TP 80
EURUSD: Sell 1.0440 SL 30 TP 100
USDJPY: Looking for reaction at current support level. Buy 154.10 or Sell 152.30 (SL 40 TP 120)
EURJPY: Buy 160.10 SL 60 TP 120
GBPJPY: Nothing for now
USDCHF: Downside to 0.8980, no H1 setup
USDCAD: Sell 1.4280 SL 40 TP 150
XAUUSD: Hit my TP at 2865, could retrace to 2841 before trading higher again to maybe 2900

Bearish drop?The Aussie (AUD/USD) is reacting off the pivot which acts as a pullback resistance and could drop to the 1st support level.
Pivot: 0.6285
1st Support: 0.6237
1st Resistance: 0.6330
Risk Warning:
Trading Forex and CFDs carries a high level of risk to your capital and you should only trade with money you can afford to lose. Trading Forex and CFDs may not be suitable for all investors, so please ensure that you fully understand the risks involved and seek independent advice if necessary.
Disclaimer:
The above opinions given constitute general market commentary, and do not constitute the opinion or advice of IC Markets or any form of personal or investment advice.
Any opinions, news, research, analyses, prices, other information, or links to third-party sites contained on this website are provided on an "as-is" basis, are intended only to be informative, is not an advice nor a recommendation, nor research, or a record of our trading prices, or an offer of, or solicitation for a transaction in any financial instrument and thus should not be treated as such. The information provided does not involve any specific investment objectives, financial situation and needs of any specific person who may receive it. Please be aware, that past performance is not a reliable indicator of future performance and/or results. Past Performance or Forward-looking scenarios based upon the reasonable beliefs of the third-party provider are not a guarantee of future performance. Actual results may differ materially from those anticipated in forward-looking or past performance statements. IC Markets makes no representation or warranty and assumes no liability as to the accuracy or completeness of the information provided, nor any loss arising from any investment based on a recommendation, forecast or any information supplied by any third-party.

AUD_USD SWING SHORT|
✅AUD_USD is set to retest a
Strong resistance level above at 0.6350
After trading in a local uptrend for some time
Which makes a bearish pullback a likely scenario
With the target being a local support below at 0.6250
SHORT🔥
✅Like and subscribe to never miss a new idea!✅

05.02.25 Morning ForecastPairs on Watch -
FX:AUDUSD
FX:NZDCAD
A short overview of the instruments I am looking at for today, multi-timeframe analysis down to what I will be looking at for an entry. Enjoy!

Could the Aussie reverse from here?The price is rising towards the pivot which has been identified as a pullback support and could rise to the 1st resistance.
Pivot: 0.6285
1st Support: 0.6225
1st Resistance: 0.6330
Risk Warning:
Trading Forex and CFDs carries a high level of risk to your capital and you should only trade with money you can afford to lose. Trading Forex and CFDs may not be suitable for all investors, so please ensure that you fully understand the risks involved and seek independent advice if necessary.
Disclaimer:
The above opinions given constitute general market commentary, and do not constitute the opinion or advice of IC Markets or any form of personal or investment advice.
Any opinions, news, research, analyses, prices, other information, or links to third-party sites contained on this website are provided on an "as-is" basis, are intended only to be informative, is not an advice nor a recommendation, nor research, or a record of our trading prices, or an offer of, or solicitation for a transaction in any financial instrument and thus should not be treated as such. The information provided does not involve any specific investment objectives, financial situation and needs of any specific person who may receive it. Please be aware, that past performance is not a reliable indicator of future performance and/or results. Past Performance or Forward-looking scenarios based upon the reasonable beliefs of the third-party provider are not a guarantee of future performance. Actual results may differ materially from those anticipated in forward-looking or past performance statements. IC Markets makes no representation or warranty and assumes no liability as to the accuracy or completeness of the information provided, nor any loss arising from any investment based on a recommendation, forecast or any information supplied by any third-party.

AUDUSD - Weekly forecast, Technical Analysis & Trading IdeasMidterm forecast:
0.63475 is a major resistance, while this level is not broken, the Midterm wave will be downtrend.
Technical analysis:
A peak is formed in daily chart at 0.63295 on 01/24/2025, so more losses minimum to Trend Hunter Buy Zone (0.61710 to 0.61000) is expected.
Take Profits:
0.62874
0.63475
0.64388
0.65385
0.66210
0.66846
0.67965
0.69410
0.71541
__________________________________________
❤️ If you find this helpful and want more FREE forecasts in TradingView,
. . . . . Please show your support back,
. . . . . . . . Hit the 👍 BOOST button,
. . . . . . . . . . . Drop some feedback below in the comment!
🙏 Your Support is appreciated!
Let us know how you see this opportunity and forecast.
Have a successful week,
ForecastCity Support Team

AUD/USD false break reversalThe AUD/USD chart is super interesting to watch and trade this week.
It fell yesterday to a fresh multi-year low, but rallied from its lows to close the day higher after Trump delayed tariffs on the USA's northern and southern neighbours.
Anyway, the AUD/USD has potentially formed what looks like a false break bullish reversal pattern against the January low of 0.6131.
The bulls will want to see rates now hold above Monday's high (that too, being a nice a hammer candle). If seen, we could see further follow-up technical buying in the days ahead.
By Fawad Razaqzada, market analyst at FOREX.com

AUDUSD Short A possible short after a nice pull back, will trade 8 pip stoploss with 82 pip target, nice risk to reward ratio, hopefully it plays well.

Audusdclean traffic ,right now were at historic lows ,expecting a nice push from here ,looking at previous highs and using them as guide for targets..

AUDUSD Potential DownsidesHey Traders, in today's trading session we are monitoring AUDUSD for a selling opportunity around 0.62400 zone, AUDUSD is trading in a downtrend and currently is in a correction phase in which it is approaching the trend at 0.62400 support and resistance area.
Trade safe, Joe.

Could the Aussie reverse from here?The price is rising towards the pivot which acts as a pullback resistance and could reverse to the pullback support.
Pivot: 0.6244
1st Support: 0.6176
1st Resistance: 0.6292
Risk Warning:
Trading Forex and CFDs carries a high level of risk to your capital and you should only trade with money you can afford to lose. Trading Forex and CFDs may not be suitable for all investors, so please ensure that you fully understand the risks involved and seek independent advice if necessary.
Disclaimer:
The above opinions given constitute general market commentary, and do not constitute the opinion or advice of IC Markets or any form of personal or investment advice.
Any opinions, news, research, analyses, prices, other information, or links to third-party sites contained on this website are provided on an "as-is" basis, are intended only to be informative, is not an advice nor a recommendation, nor research, or a record of our trading prices, or an offer of, or solicitation for a transaction in any financial instrument and thus should not be treated as such. The information provided does not involve any specific investment objectives, financial situation and needs of any specific person who may receive it. Please be aware, that past performance is not a reliable indicator of future performance and/or results. Past Performance or Forward-looking scenarios based upon the reasonable beliefs of the third-party provider are not a guarantee of future performance. Actual results may differ materially from those anticipated in forward-looking or past performance statements. IC Markets makes no representation or warranty and assumes no liability as to the accuracy or completeness of the information provided, nor any loss arising from any investment based on a recommendation, forecast or any information supplied by any third-party.

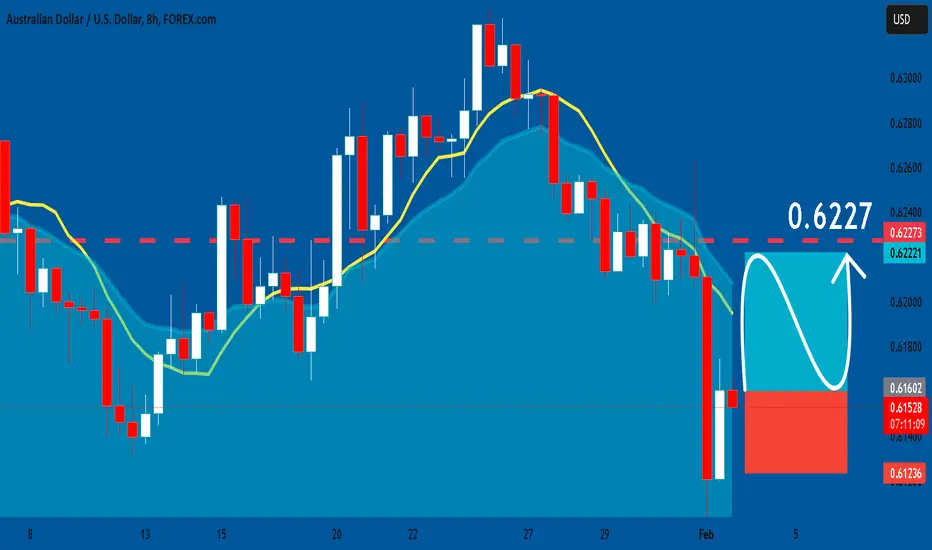
AUDUSD: Long Signal Explained
AUDUSD
- Classic bullish pattern
- Our team expects retracement
SUGGESTED TRADE:
Swing Trade
Buy AUDUSD
Entry - 0.6159
Stop - 0.6123
Take - 0.6227
Our Risk - 1%
Start protection of your profits from lower levels
❤️ Please, support our work with like & comment! ❤️
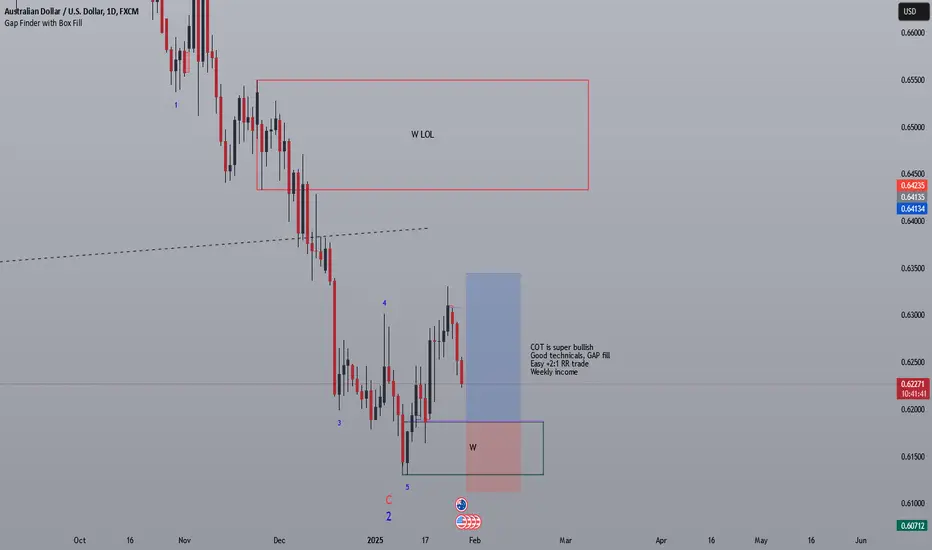
AUDUSD Bullish Trade Idea - SwingMy trading is based on COT readings along with Supply & Demand.
In this idea you can see a clear Weekly Demand area in support with great COT readings where the Users & Producers are clearly bullish and Retailers bearish. Of course, you want to trade AGAINST retailers at all costs because they are mostly wrong.
imgur.com
(Red = U&Ps | Blue = Retailers | Green = Fund managers / trend followers)
So, in addition to all that, I use Elliott Waves to confirm trends or end of trends, and now we're in the beginning of a major Wave 3 (creating wave 1 & 2, we're here).
Hope you like this idea and trade safe!
Aussie H4 | Bearish downtrend to resume?The Aussie (AUD/USD) is rising towards a pullback resistance and could potentially reverse off this level to drop lower.
Sell entry is at 0.6173 which is a pullback resistance that aligns with the 38.2% Fibonacci retracement level.
Stop loss is at 0.6223 which is a level that sits above the 50.0% Fibonacci retracement and a pullback resistance.
Take profit is at 0.6087 which is a swing-low support.
High Risk Investment Warning
Trading Forex/CFDs on margin carries a high level of risk and may not be suitable for all investors. Leverage can work against you.
Stratos Markets Limited (www.fxcm.com):
CFDs are complex instruments and come with a high risk of losing money rapidly due to leverage. 63% of retail investor accounts lose money when trading CFDs with this provider. You should consider whether you understand how CFDs work and whether you can afford to take the high risk of losing your money.
Stratos Europe Ltd (www.fxcm.com):
CFDs are complex instruments and come with a high risk of losing money rapidly due to leverage. 63% of retail investor accounts lose money when trading CFDs with this provider. You should consider whether you understand how CFDs work and whether you can afford to take the high risk of losing your money.
Stratos Trading Pty. Limited (www.fxcm.com):
Trading FX/CFDs carries significant risks. FXCM AU (AFSL 309763), please read the Financial Services Guide, Product Disclosure Statement, Target Market Determination and Terms of Business at www.fxcm.com
Stratos Global LLC (www.fxcm.com):
Losses can exceed deposits.
Please be advised that the information presented on TradingView is provided to FXCM (‘Company’, ‘we’) by a third-party provider (‘TFA Global Pte Ltd’). Please be reminded that you are solely responsible for the trading decisions on your account. There is a very high degree of risk involved in trading. Any information and/or content is intended entirely for research, educational and informational purposes only and does not constitute investment or consultation advice or investment strategy. The information is not tailored to the investment needs of any specific person and therefore does not involve a consideration of any of the investment objectives, financial situation or needs of any viewer that may receive it. Kindly also note that past performance is not a reliable indicator of future results. Actual results may differ materially from those anticipated in forward-looking or past performance statements. We assume no liability as to the accuracy or completeness of any of the information and/or content provided herein and the Company cannot be held responsible for any omission, mistake nor for any loss or damage including without limitation to any loss of profit which may arise from reliance on any information supplied by TFA Global Pte Ltd.
The speaker(s) is neither an employee, agent nor representative of FXCM and is therefore acting independently. The opinions given are their own, constitute general market commentary, and do not constitute the opinion or advice of FXCM or any form of personal or investment advice. FXCM neither endorses nor guarantees offerings of third-party speakers, nor is FXCM responsible for the content, veracity or opinions of third-party speakers, presenters or participants.

AUDUSD, What will hapen in upcoming weeks ?Hello Traders, Happy new year in advance, I Hope you have a great year ahead with your family.
let's go for AUDUSD analysis:
for upcoming weeks, we'll probably see an upward correction to Specified level at first and then it will start another fall. so with a proper trigger we can open a short position.
And finally tell me what do you think ? UP or DOWN ? leave your comment below this post.
If this post was helpful to you, please like it and share it with your friend.
THANKS.

HUGE GAPS on market open!HUGE GAPS on market open across all markets related to the US Dollar!
XXXUSD 📉
USDXXX 📈

Sideways Action in AUD/USD with Bearish Bias Amid RBA Rate Cut AUD/USD is expected to trade sideways in the near term, with a bearish bias overall. The market remains range-bound, and any rallies should be sold at resistance levels, as the broader trend is down. The Reserve Bank of Australia (RBA) is anticipated to cut rates, which could put additional pressure on the Aussie, reinforcing the overall negative outlook for the pair. Watch for confirmation at key levels before entering trades, with the focus on selling at resistance.

AUDUSD Breakout And Potential RetraceHey Traders, in the coming week we are monitoring AUDUSD for a buying opportunity around 0.61600 zone, AUDUSD was trading in a downtrend and successfully managed to break it out. Currently is in a correction phase in which it is approaching the retrace area at 0.61600 support and resistance area.
Trade safe, Joe.

$AUDUSDPrice is in consolidation range. Volume rising has also been weak since the 11/06/24 date. Since this date, price has still been moving down. However, since price is consolidating, we might be ready for a breakout to the upside soon. If valid, we have our target zones.
