Ready for the Aussie Heist? Is This the Perfect Entry?🚨💰 - "The Aussie Vault Raid: Bullish Robbery in Progress!" 💰🚨
AUD/USD Forex Trade Idea (Thief Style Swing/Day Plan)
📈🔥 Designed for Thief Traders, Market Robbers & Money Makers Worldwide 🤑🐱👤💸
🌍 Hello Global Robbers!
🌟 Hola! Ola! Bonjour! Hallo! Salaam! Konnichiwa! 🌟
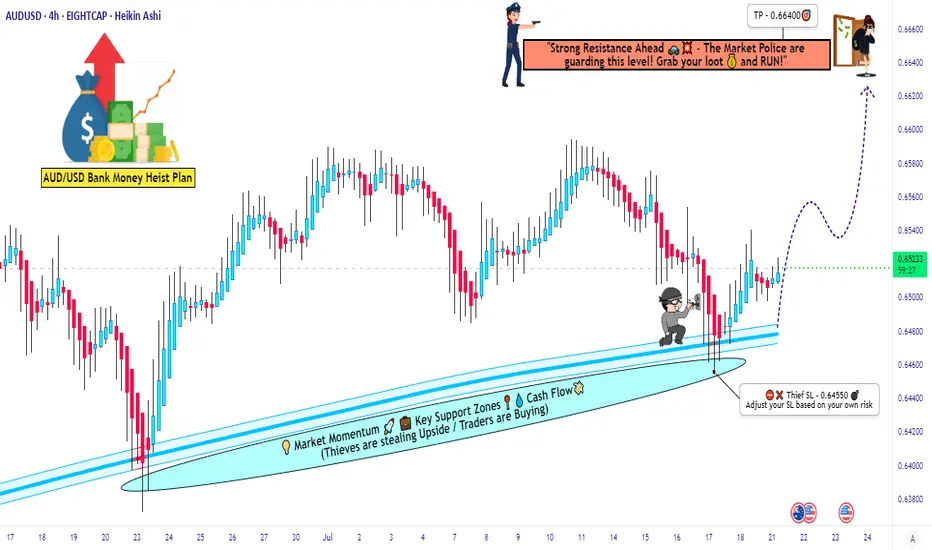
Welcome to another bold heist plan from the Thief Trading Crew. This one’s a high-stakes raid on the AUD/USD — "The Aussie" — using our signature Thief Trading Style, combining raw technical setups with real macro/fundamental edge. We're eyeing the Bullish Vault Breakout, so tighten up your gloves — it’s time to rob smart, not hard.
🔓💸 ENTRY PLAN – “The Vault is Unlocked!”
Grab the bullish loot at any valid price zone — but here’s how real thieves move:
📍 Recommended Entry Style:
Use Buy Limit Orders near local swing lows, demand zones, or key pullback entries on the 15m to 30m chart.
Execute DCA (Dollar Cost Averaging) / Layered Orders for more precision.
Align with your MA lines & candle structures for max confirmation.
🛑 STOP LOSS – “Escape Route Secured”
📍 SL hidden beneath recent swing lows below MA (on 4H):
🎯 Suggested Level: 0.64550
💡 Custom-fit your SL based on:
Trade size
Number of active positions
Account risk strategy
🎯 PROFIT TARGET – “Cash Out Before the Cops Show!”
🏴☠️ Take-Profit Zone: 0.66400
This is our bullish breakout reward zone — a high-value zone where profit meets safety.
🔍 MARKET OUTLOOK – "Cops Are Watching, but We're Ahead..."
📈 The AUD/USD market is flashing bullish momentum, supported by:
✅ Risk sentiment flow
✅ US Dollar weakness and rate expectations
✅ Intermarket signals from commodities (Gold/Iron)
✅ Positive macro positioning from smart money (via COT)
✅ Technical demand forming reversal patterns from oversold zones
📎 For a deeper breakdown —
📰 Fundamentals | COT Reports | Sentiment | Intermarket Analysis — Check Klick 🔗
⚠️ THIEF ALERT – “Avoid Sirens. Watch the News.”
Stay out of trouble by following these protocols during major news events:
🚫 Don’t enter trades blindly before/after big news
📍 Use trailing stops to protect gains
🔄 Adjust SL/TP if price nears breakout points during volatility
💥 SUPPORT THE CREW – “Smash That Boost Button!”
Love the plan? Then Boost this chart to show love for the Thief Trading Movement.
Every like, comment, and boost adds power to our robbery network across the globe. 🌍❤️💰
⚖️ DISCLAIMER – “Not Financial Advice, Just Thief Vibes”
📌 This analysis is for educational and entertainment purposes only.
📌 Trade at your own risk and always do your own analysis.
📌 Market moves fast — stay sharp, stay stealthy.
**🎭 See you at the next heist.
Until then, trade rich. Rob wise.
Thief Trader out. 🐱👤💰📉📈**
AUDUSD
AUDUSD Q3 | D21 | W30 | Y25📊AUDUSD Q3 | D21 | W30 | Y25
Daily Forecast 🔍📅
Here’s a short diagnosis of the current chart setup 🧠📈
Higher time frame order blocks have been identified — these are our patient points of interest 🎯🧭.
It’s crucial to wait for a confirmed break of structure 🧱✅ before forming a directional bias.
This keeps us disciplined and aligned with what price action is truly telling us.
📈 Risk Management Protocols
🔑 Core principles:
Max 1% risk per trade
Only execute at pre-identified levels
Use alerts, not emotion
Stick to your RR plan — minimum 1:2
🧠 You’re not paid for how many trades you take, you’re paid for how well you manage risk.
🧠 Weekly FRGNT Insight
"Trade what the market gives, not what your ego wants."
Stay mechanical. Stay focused. Let the probabilities work.
FRGNT 📊

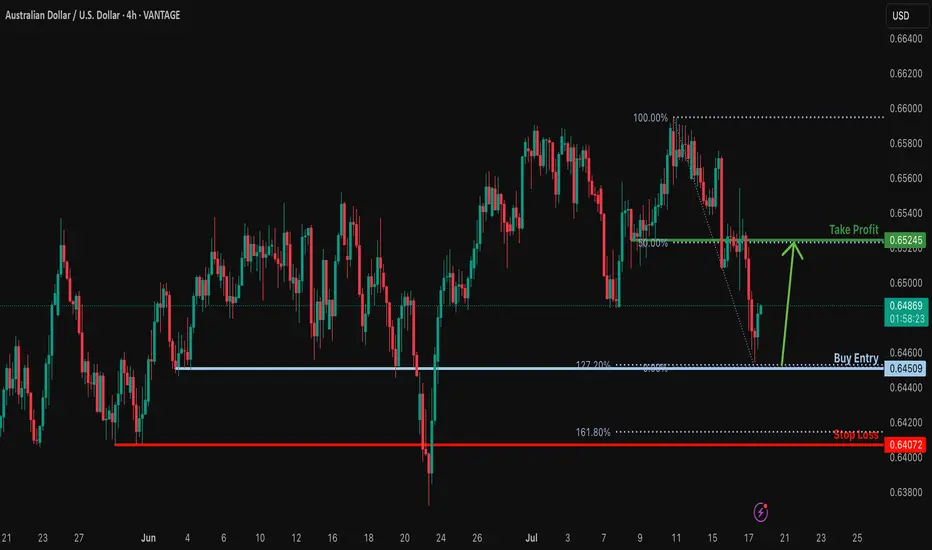
AUDUSD H1 I Bullish Bounce off the 50% FibBased on the H1 chart analysis, the price is approaching our buy entry level at 0.6494, a pullback support that aligns with the 50% Fib retracement.
Our take profit is set at 0.6538, an overlap resistance.
The stop loss is placed at 0.673, a pullback support.
High Risk Investment Warning
Trading Forex/CFDs on margin carries a high level of risk and may not be suitable for all investors. Leverage can work against you.
Stratos Markets Limited (tradu.com ):
CFDs are complex instruments and come with a high risk of losing money rapidly due to leverage. 66% of retail investor accounts lose money when trading CFDs with this provider. You should consider whether you understand how CFDs work and whether you can afford to take the high risk of losing your money.
Stratos Europe Ltd (tradu.com ):
CFDs are complex instruments and come with a high risk of losing money rapidly due to leverage. 66% of retail investor accounts lose money when trading CFDs with this provider. You should consider whether you understand how CFDs work and whether you can afford to take the high risk of losing your money.
Stratos Global LLC (tradu.com ):
Losses can exceed deposits.
Please be advised that the information presented on TradingView is provided to Tradu (‘Company’, ‘we’) by a third-party provider (‘TFA Global Pte Ltd’). Please be reminded that you are solely responsible for the trading decisions on your account. There is a very high degree of risk involved in trading. Any information and/or content is intended entirely for research, educational and informational purposes only and does not constitute investment or consultation advice or investment strategy. The information is not tailored to the investment needs of any specific person and therefore does not involve a consideration of any of the investment objectives, financial situation or needs of any viewer that may receive it. Kindly also note that past performance is not a reliable indicator of future results. Actual results may differ materially from those anticipated in forward-looking or past performance statements. We assume no liability as to the accuracy or completeness of any of the information and/or content provided herein and the Company cannot be held responsible for any omission, mistake nor for any loss or damage including without limitation to any loss of profit which may arise from reliance on any information supplied by TFA Global Pte Ltd.
The speaker(s) is neither an employee, agent nor representative of Tradu and is therefore acting independently. The opinions given are their own, constitute general market commentary, and do not constitute the opinion or advice of Tradu or any form of personal or investment advice. Tradu neither endorses nor guarantees offerings of third-party speakers, nor is Tradu responsible for the content, veracity or opinions of third-party speakers, presenters or participants.

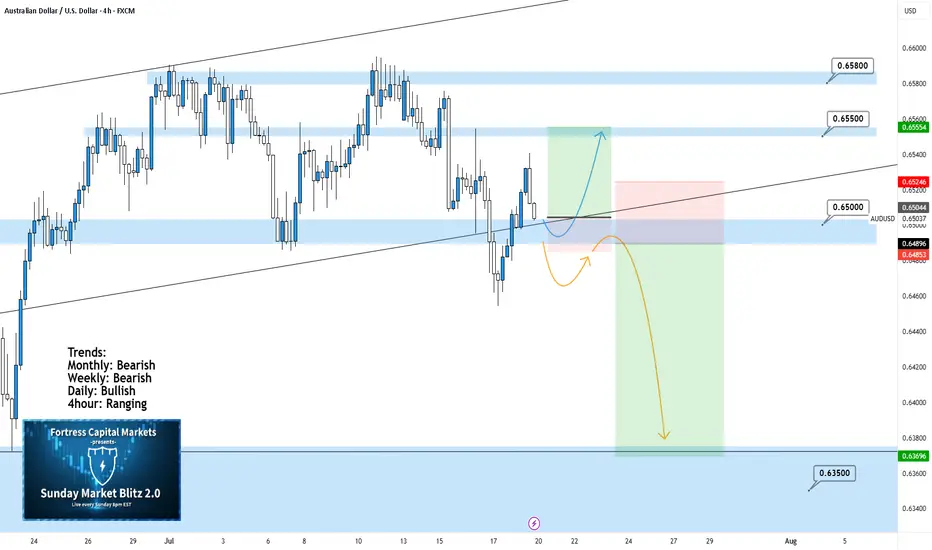
AUDUSD 4Hour TF - July 20th, 2025AUDUSD 7/20/2025
AUDUSD 4hour Neutral idea
Monthly - Bearish
Weekly - Bearish
Dailly - Bullish
4hour - Ranging
We’re looking at a fairly large range here on AU and although the higher timeframe suggests a potential bearish move, I am unsure until we have some clarity around 0.65000. Here are two scenarios that break down what could happen this week and how 0.65000 plays into it:
Range Continuation - Since late June we have seen price action establish this large range and stick to it (0.65800 Resistance & 0.65000 Support).
Currently, we can see price action attempting to break 0.65000 support but it has not done so yet. If we don’t break below 0.65000 early this week it is very likely we will see a rally into the top of the range.
Bearish Breakout - This is the setup we want to see play out this week as it presents a beauty of a trade.
For us to see AU as bearish on the 4hour we need to see a clear break below 0.65000 with a confirmed lower high below. If this happens look to target toward major support levels like 0.63500 area.
Week of 7/20/25: AUDUSD AnalysisLast week's price action was bearish and this week I will follow bearish order flow unless internal 1h structure continues to be bullish. I'm going to look for shorts after 1h internal structure is broken as confirmation, then take trades down to the daily demand zone and then look for bullish signals.

AUDUSD Potential UpsidesHey Traders, in tomorrow's trading session we are monitoring AUDUSD for a buying opportunity around 0.64200 zone, AUDUSD is trading in an uptrend and currently is in a correction phase in which it is approaching the trend at 0.64200 support and resistance area.
Trade safe, Joe.

AUDUSD: Sell The Rip!Welcome back to the Weekly Forex Forecast for the week of July 21-25th.
In this video, we will analyze the following FX market:
AUDUSD
AUDUSD has been difficult to trade, as it chops its slow grind upwards. Last week it gave a bearish close. With the USD expected to continue to gain strength, look for sells directed to the liquidity lows in AUDUSD.
Enjoy!
May profits be upon you.
Leave any questions or comments in the comment section.
I appreciate any feedback from my viewers!
Like and/or subscribe if you want more accurate analysis.
Thank you so much!
Disclaimer:
I do not provide personal investment advice and I am not a qualified licensed investment advisor.
All information found here, including any ideas, opinions, views, predictions, forecasts, commentaries, suggestions, expressed or implied herein, are for informational, entertainment or educational purposes only and should not be construed as personal investment advice. While the information provided is believed to be accurate, it may include errors or inaccuracies.
I will not and cannot be held liable for any actions you take as a result of anything you read here.
Conduct your own due diligence, or consult a licensed financial advisor or broker before making any and all investment decisions. Any investments, trades, speculations, or decisions made on the basis of any information found on this channel, expressed or implied herein, are committed at your own risk, financial or otherwise.

AUDUSD – bullish momentum returns, ready for a breakout?AUDUSD is showing clear strength after rebounding from a key support zone. The bullish structure remains intact with a series of higher lows, and the ascending trendline continues to hold. The recent pullback appears to be a healthy retracement before the market gathers momentum for the next leg up.
On the news front, the pair is supported by strong Australian employment data and expectations that the Federal Reserve will keep interest rates steady. This has slightly weakened the US dollar, giving AUD room to recover.
If buying pressure holds, AUDUSD could break through the overhead resistance and enter a new bullish phase. Now is the time for traders to watch price action closely and wait for a clear confirmation signal!
AUDUSD Potential UpsidesHey Traders, in today's trading session we are monitoring AUDUSD for a buying opportunity around 0.64500 zone, AUDUSD is trading in an uptrend and currently is in a correction phase in which it is approaching the trend at 0.64500 support and resistance area.
Trade safe, Joe.

AUDUSD SELLAUD/USD dives to three-week lows near 0.6560 after weak Australian employment data
The Australian Dollar is one of the weakest performers of the G8 currencies on Thursday, hammered by a disappointing Australian Employment report and the overall risk-averse market, which is boosting demand for safe-haven assets, such as the US Dollar
The battle between the Australian Dollar (AUD) and the US Dollar (USD) will be one worth watching in 2025, with central banks stealing the limelight. The Reserve Bank of Australia (RBA) has kept interest rates at record highs whilst most of its overseas counterparts started the loosening process. The US Federal Reserve (Fed), on the other hand, has trimmed the benchmark interest rate by 100 bps through 2024 and aims to slow the pace of cuts in 2025. The central banks’ imbalance aims for record lows in AUD/USD
TP 1 0.650
TP 2 0.649
TP 3 0.648
RESISTANCE 0.653

AUDUSD H4 I Falling from the pullback resistanceBased on the H4 chart, the price is testing our sell entry level at 0.6508, a pullback resistance.
Our take profit is set at 0.6457, an overlap support.
The stop loss is set at 0.6554, a swing high resistance.
High Risk Investment Warning
Trading Forex/CFDs on margin carries a high level of risk and may not be suitable for all investors. Leverage can work against you.
Stratos Markets Limited (tradu.com ):
CFDs are complex instruments and come with a high risk of losing money rapidly due to leverage. 66% of retail investor accounts lose money when trading CFDs with this provider. You should consider whether you understand how CFDs work and whether you can afford to take the high risk of losing your money.
Stratos Europe Ltd (tradu.com ):
CFDs are complex instruments and come with a high risk of losing money rapidly due to leverage. 66% of retail investor accounts lose money when trading CFDs with this provider. You should consider whether you understand how CFDs work and whether you can afford to take the high risk of losing your money.
Stratos Global LLC (tradu.com ):
Losses can exceed deposits.
Please be advised that the information presented on TradingView is provided to Tradu (‘Company’, ‘we’) by a third-party provider (‘TFA Global Pte Ltd’). Please be reminded that you are solely responsible for the trading decisions on your account. There is a very high degree of risk involved in trading. Any information and/or content is intended entirely for research, educational and informational purposes only and does not constitute investment or consultation advice or investment strategy. The information is not tailored to the investment needs of any specific person and therefore does not involve a consideration of any of the investment objectives, financial situation or needs of any viewer that may receive it. Kindly also note that past performance is not a reliable indicator of future results. Actual results may differ materially from those anticipated in forward-looking or past performance statements. We assume no liability as to the accuracy or completeness of any of the information and/or content provided herein and the Company cannot be held responsible for any omission, mistake nor for any loss or damage including without limitation to any loss of profit which may arise from reliance on any information supplied by TFA Global Pte Ltd.
The speaker(s) is neither an employee, agent nor representative of Tradu and is therefore acting independently. The opinions given are their own, constitute general market commentary, and do not constitute the opinion or advice of Tradu or any form of personal or investment advice. Tradu neither endorses nor guarantees offerings of third-party speakers, nor is Tradu responsible for the content, veracity or opinions of third-party speakers, presenters or participants.

Bullish bounce?The Aussie (AUD/USD) has bounced off the pivot and could rise to the 1st resistance.
Pivot: 0.6456
1st Support: 0.6407
1st Resistance: 0.6523
Risk Warning:
Trading Forex and CFDs carries a high level of risk to your capital and you should only trade with money you can afford to lose. Trading Forex and CFDs may not be suitable for all investors, so please ensure that you fully understand the risks involved and seek independent advice if necessary.
Disclaimer:
The above opinions given constitute general market commentary, and do not constitute the opinion or advice of IC Markets or any form of personal or investment advice.
Any opinions, news, research, analyses, prices, other information, or links to third-party sites contained on this website are provided on an "as-is" basis, are intended only to be informative, is not an advice nor a recommendation, nor research, or a record of our trading prices, or an offer of, or solicitation for a transaction in any financial instrument and thus should not be treated as such. The information provided does not involve any specific investment objectives, financial situation and needs of any specific person who may receive it. Please be aware, that past performance is not a reliable indicator of future performance and/or results. Past Performance or Forward-looking scenarios based upon the reasonable beliefs of the third-party provider are not a guarantee of future performance. Actual results may differ materially from those anticipated in forward-looking or past performance statements. IC Markets makes no representation or warranty and assumes no liability as to the accuracy or completeness of the information provided, nor any loss arising from any investment based on a recommendation, forecast or any information supplied by any third-party.
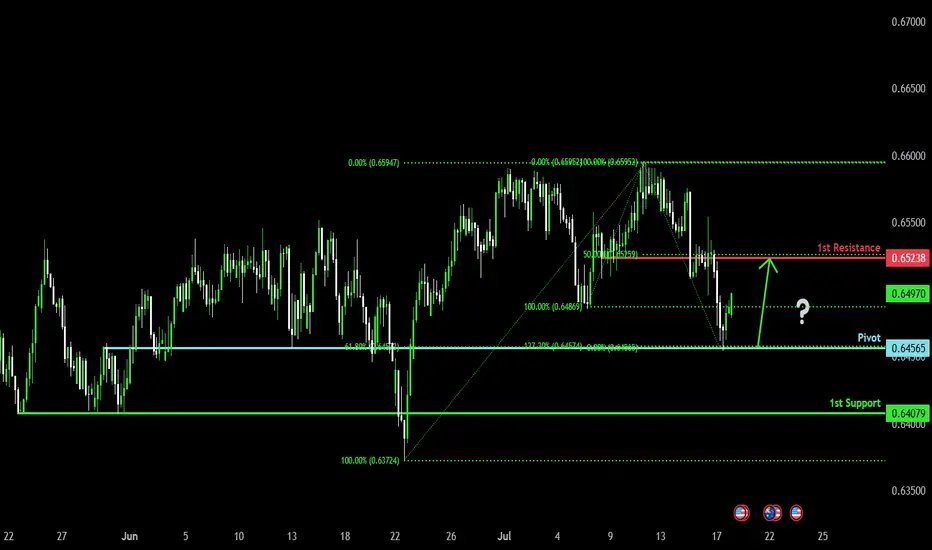
Bullish bounce off for the Aussie?The price has bounced off the support level which is a pullback support that aligns with the 127.2% Fibonacci extension and could potentially rise from this level to our take profit.
Entry: 0.6450
Why we like it:
There is a pullback support that aligns with the 127.2% Fibonacci extension.
Stop loss: 0.6407
Why we lik eit:
There is a pullback support that is slightly below the 161.8% Fibonacci extension.
Take profit: 0.6524
Why we like it:
There is an overlap resistance that lines up with the 50% Fibonacci retracement.
Enjoying your TradingView experience? Review us!
Please be advised that the information presented on TradingView is provided to Vantage (‘Vantage Global Limited’, ‘we’) by a third-party provider (‘Everest Fortune Group’). Please be reminded that you are solely responsible for the trading decisions on your account. There is a very high degree of risk involved in trading. Any information and/or content is intended entirely for research, educational and informational purposes only and does not constitute investment or consultation advice or investment strategy. The information is not tailored to the investment needs of any specific person and therefore does not involve a consideration of any of the investment objectives, financial situation or needs of any viewer that may receive it. Kindly also note that past performance is not a reliable indicator of future results. Actual results may differ materially from those anticipated in forward-looking or past performance statements. We assume no liability as to the accuracy or completeness of any of the information and/or content provided herein and the Company cannot be held responsible for any omission, mistake nor for any loss or damage including without limitation to any loss of profit which may arise from reliance on any information supplied by Everest Fortune Group.
AUD-USD Local Short! Sell!
Hello,Traders!
AUD-JPY is making a bullish
Rebound and the pair is
Making a retest of the key
Horizontal resistance of 0.6497
From where we will be
Expecting a local bearish correction
Sell!
Comment and subscribe to help us grow!
Check out other forecasts below too!
Disclosure: I am part of Trade Nation's Influencer program and receive a monthly fee for using their TradingView charts in my analysis.

AUDUSD Bearish Breakout!
HI,Traders !
AUD-USD is trading in a sideways trend
and the pair
Made a breakout of the
Key horizontal level
Of 0.8149 which is now
A resistance and the pair
Is now making a retest
Of the level so as we are
Bearish biased we will
Be expecting a pullback
And a further bearish
Move down !
Comment and subscribe to help us grow !

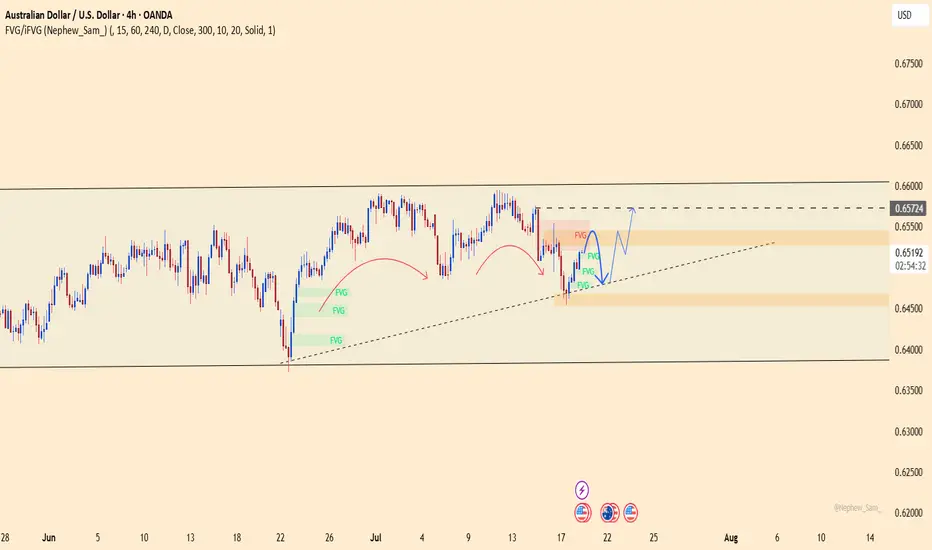
AUDUSD Forming Bullish MomentumAUDUSD is showing strong bullish momentum, and the current price structure confirms that the pair is gearing up for another potential rally. After building solid bullish pressure from key support zones, price has been making higher lows with clear buying interest stepping in on dips. I entered this setup earlier and am already in deep profit. With the momentum continuing to hold, I’m anticipating another wave to the upside in the coming sessions.
From a fundamental standpoint, the Australian dollar is currently benefiting from broad US dollar softness driven by expectations of a Fed rate cut later this year. As inflation cools in the US and the labor market shows signs of moderation, the Fed’s hawkish stance has softened, weakening the dollar across the board. At the same time, the Reserve Bank of Australia (RBA) has maintained a relatively firm tone, leaving the door open for further tightening if inflation pressures persist domestically. This divergence in central bank tone is favoring AUD strength.
Additionally, commodities like iron ore and copper—major Australian exports—have recently found renewed demand, particularly from China. With Chinese authorities signaling more fiscal and monetary stimulus to support their post-COVID recovery, the Australian economy stands to benefit, further supporting AUD upside. This commodity-backed strength adds another layer of support to the bullish AUDUSD narrative.
Technically, the pair has broken above a key resistance level and is now forming a bullish continuation pattern on the lower timeframes. Price action is supported by rising volume and moving averages starting to slope upward. The structure is clean, the fundamentals are supportive, and sentiment across TradingView shows increasing bullish interest in AUDUSD. I'm holding for higher levels as the bullish wave continues to develop.
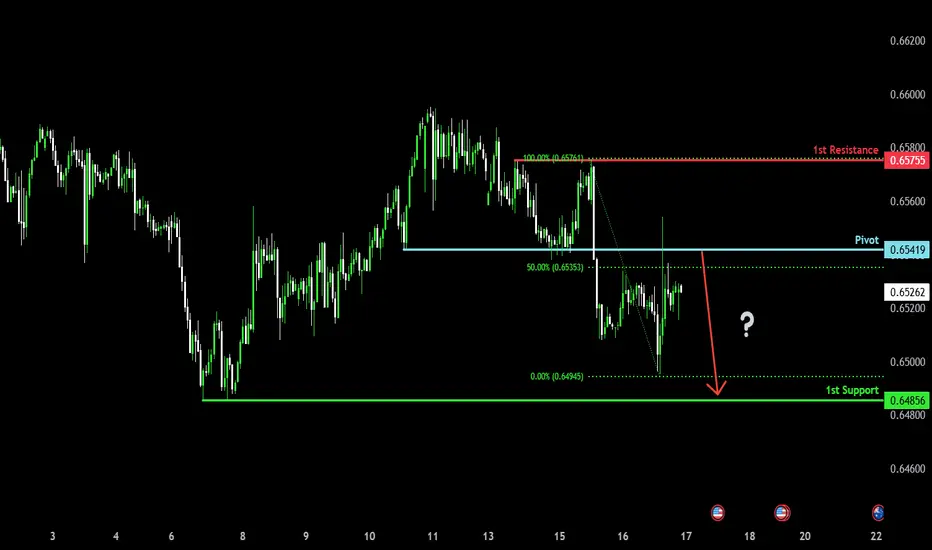
Bearish reversal?The Aussie (AUD/USD) is rising towards the pivot and could reverse to the 1st support.
Pivot: 0.6541
1st Support: 0.6485
1st Resistance: 0.6575
Risk Warning:
Trading Forex and CFDs carries a high level of risk to your capital and you should only trade with money you can afford to lose. Trading Forex and CFDs may not be suitable for all investors, so please ensure that you fully understand the risks involved and seek independent advice if necessary.
Disclaimer:
The above opinions given constitute general market commentary, and do not constitute the opinion or advice of IC Markets or any form of personal or investment advice.
Any opinions, news, research, analyses, prices, other information, or links to third-party sites contained on this website are provided on an "as-is" basis, are intended only to be informative, is not an advice nor a recommendation, nor research, or a record of our trading prices, or an offer of, or solicitation for a transaction in any financial instrument and thus should not be treated as such. The information provided does not involve any specific investment objectives, financial situation and needs of any specific person who may receive it. Please be aware, that past performance is not a reliable indicator of future performance and/or results. Past Performance or Forward-looking scenarios based upon the reasonable beliefs of the third-party provider are not a guarantee of future performance. Actual results may differ materially from those anticipated in forward-looking or past performance statements. IC Markets makes no representation or warranty and assumes no liability as to the accuracy or completeness of the information provided, nor any loss arising from any investment based on a recommendation, forecast or any information supplied by any third-party.
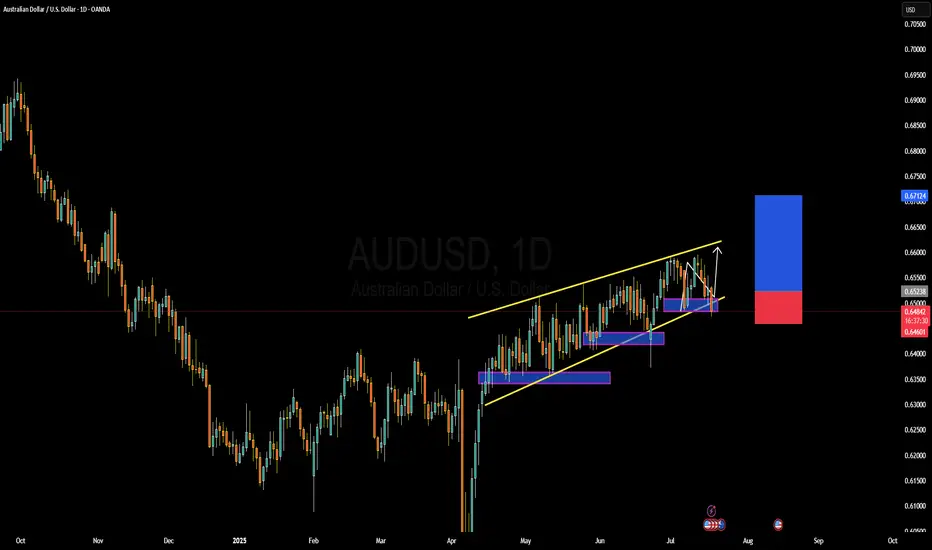
AUD/USD Technical Outlook: Rising Channel Faces Resistance Near The Australian Dollar remains in an upward-sloping channel against the U.S. Dollar on the daily timeframe. Price action has recently bounced from channel support near 0.6500, a key psychological and technical level, and is attempting to regain traction within the structure.
The 61.8% Fibonacci retracement of the July 2023 – April 2024 decline at 0.6558 is currently acting as resistance, coinciding with the upper half of the rising channel. A break above this could see momentum extend toward the 78.6% retracement zone near 0.6730.
The 50-day SMA is crossing above the 200-day SMA, forming a golden cross—typically a bullish continuation signal—though price is slightly below both moving averages, implying short-term indecision.
From an indicator perspective:
RSI hovers around 50, showing a neutral bias and confirming the consolidation phase.
MACD is flat and converging near the zero line, signaling weakening momentum and a possible pause or reversal.
A daily close below channel support could expose the 0.6450–0.6400 zone next, while sustained strength above 0.6558 could re-ignite bullish interest targeting the 0.6700–0.6730 region.
Overall, AUD/USD remains technically constructive as long as the channel holds, but traders should watch closely for a breakout or breakdown confirmation from current levels.
-MW

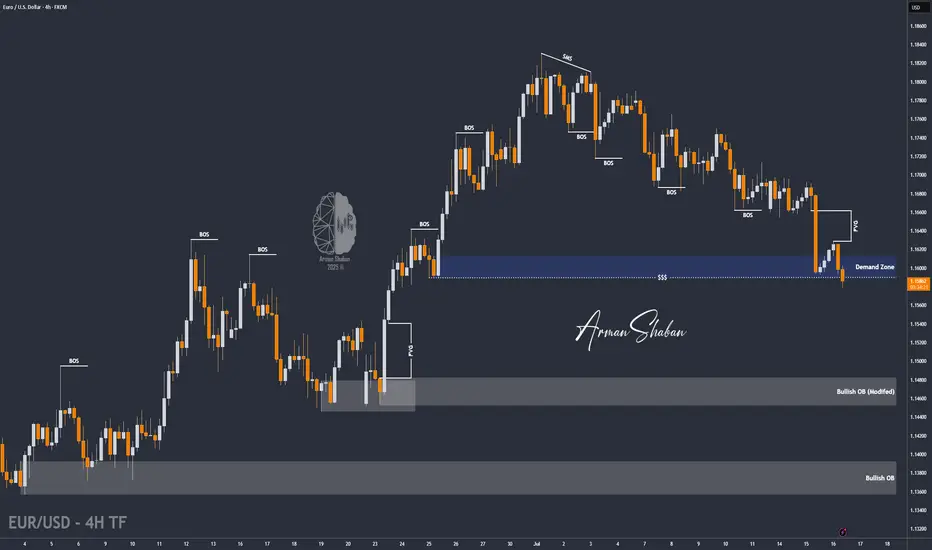
EUR/USD : Another Fall Ahead ? (READ THE CAPTION)By analyzing the EURUSD chart on the 4-hour timeframe, we can see that the price is currently breaking through the 1.16–1.158 zone. If it manages to hold below 1.159, we can expect further downside movement. The next targets for EURUSD are 1.15580, 1.154, and 1.148.
Please support me with your likes and comments to motivate me to share more analysis with you and share your opinion about the possible trend of this chart with me !
Best Regards , Arman Shaban
Australian job numbers and AUDWe are keeping a close eye on the Australian job numbers tonight. If you are trading AUD, then that's the data to watch. Let's dig in.
FX_IDC:AUDUSD
FX_IDC:AUDJPY
FX_IDC:AUDNZD
Let us know what you think in the comments below.
Thank you.
75.2% of retail investor accounts lose money when trading CFDs with this provider. You should consider whether you understand how CFDs work and whether you can afford to take the high risk of losing your money. Past performance is not necessarily indicative of future results. The value of investments may fall as well as rise and the investor may not get back the amount initially invested. This content is not intended for nor applicable to residents of the UK. Cryptocurrency CFDs and spread bets are restricted in the UK for all retail clients.

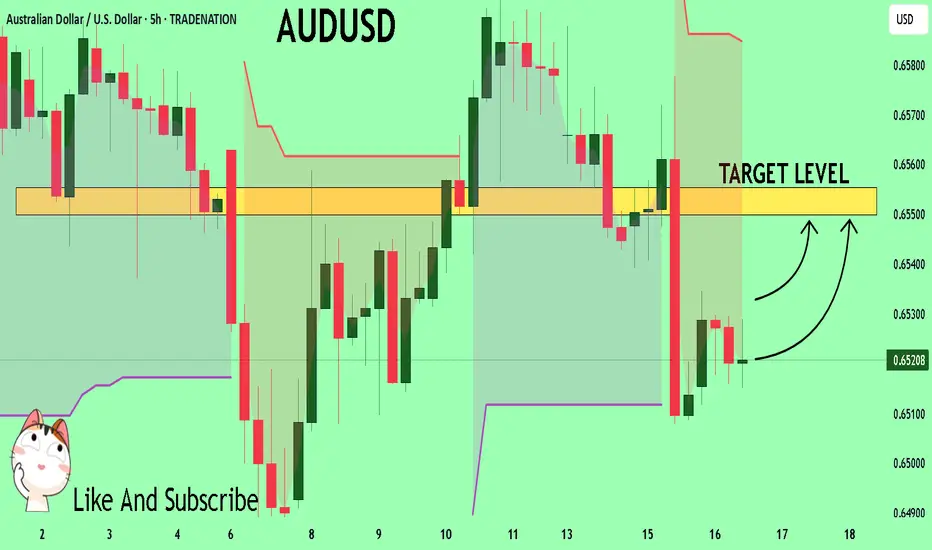
AUDUSD Set To Grow! BUY!
My dear subscribers,
AUDUSD looks like it will make a good move, and here are the details:
The market is trading on 0.6521 pivot level.
Bias - Bullish
Technical Indicators: Both Super Trend & Pivot HL indicate a highly probable Bullish continuation.
Target - 0.6550
About Used Indicators:
The average true range (ATR) plays an important role in 'Supertrend' as the indicator uses ATR to calculate its value. The ATR indicator signals the degree of price volatility.
Disclosure: I am part of Trade Nation's Influencer program and receive a monthly fee for using their TradingView charts in my analysis.
———————————
WISH YOU ALL LUCK
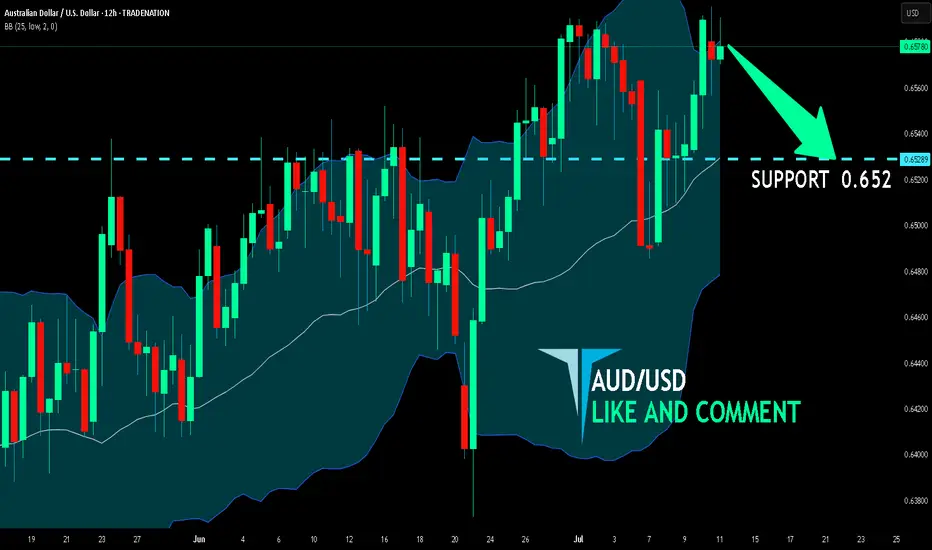
AUD/USD BEARS WILL DOMINATE THE MARKET|SHORT
Hello, Friends!
We are now examining the AUD/USD pair and we can see that the pair is going up locally while also being in a uptrend on the 1W TF. But there is also a powerful signal from the BB upper band being nearby, indicating that the pair is overbought so we can go short from the resistance line above and a target at 0.652 level.
Disclosure: I am part of Trade Nation's Influencer program and receive a monthly fee for using their TradingView charts in my analysis.
✅LIKE AND COMMENT MY IDEAS✅
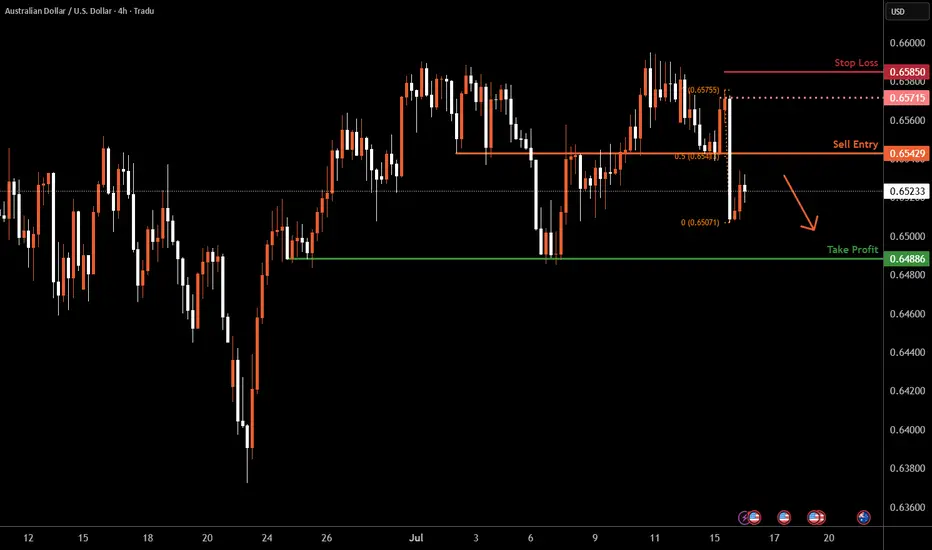
Aussie H4 | Overlap resistance at 50% Fibonacci retracementThe Aussie (AUD/USD) is rising towards an overlap resistance and could potentially reverse off this level to drop lower.
Sell entry is at 0.6542 which is an overlap resistance that aligns with the 50% Fibonacci retracement.
Stop loss is at 0.6585 which is a level that sits above a swing-high resistance.
Take profit is at 0.6488 which is a multi-swing-low support.
High Risk Investment Warning
Trading Forex/CFDs on margin carries a high level of risk and may not be suitable for all investors. Leverage can work against you.
Stratos Markets Limited (tradu.com ):
CFDs are complex instruments and come with a high risk of losing money rapidly due to leverage. 63% of retail investor accounts lose money when trading CFDs with this provider. You should consider whether you understand how CFDs work and whether you can afford to take the high risk of losing your money.
Stratos Europe Ltd (tradu.com ):
CFDs are complex instruments and come with a high risk of losing money rapidly due to leverage. 63% of retail investor accounts lose money when trading CFDs with this provider. You should consider whether you understand how CFDs work and whether you can afford to take the high risk of losing your money.
Stratos Global LLC (tradu.com ):
Losses can exceed deposits.
Please be advised that the information presented on TradingView is provided to Tradu (‘Company’, ‘we’) by a third-party provider (‘TFA Global Pte Ltd’). Please be reminded that you are solely responsible for the trading decisions on your account. There is a very high degree of risk involved in trading. Any information and/or content is intended entirely for research, educational and informational purposes only and does not constitute investment or consultation advice or investment strategy. The information is not tailored to the investment needs of any specific person and therefore does not involve a consideration of any of the investment objectives, financial situation or needs of any viewer that may receive it. Kindly also note that past performance is not a reliable indicator of future results. Actual results may differ materially from those anticipated in forward-looking or past performance statements. We assume no liability as to the accuracy or completeness of any of the information and/or content provided herein and the Company cannot be held responsible for any omission, mistake nor for any loss or damage including without limitation to any loss of profit which may arise from reliance on any information supplied by TFA Global Pte Ltd.
The speaker(s) is neither an employee, agent nor representative of Tradu and is therefore acting independently. The opinions given are their own, constitute general market commentary, and do not constitute the opinion or advice of Tradu or any form of personal or investment advice. Tradu neither endorses nor guarantees offerings of third-party speakers, nor is Tradu responsible for the content, veracity or opinions of third-party speakers, presenters or participants.