AUDUSD SELLAUDUSD 4hour break of structure with a 15 min double top and confirmation the chart pattern on the for hour is a head and shoulder pattern.
Audusdanalysis

Market Analysis: AUD/USD Could Continue HigherMarket Analysis: AUD/USD Could Continue Higher
AUD/USD is correcting gains from the 0.6365 zone.
Important Takeaways for AUD USD Analysis Today
- The Aussie Dollar started a downside correction from 0.6365 against the US Dollar.
- There is a key bullish trend line forming with support at 0.6300 on the hourly chart of AUD/USD at FXOpen.
AUD/USD Technical Analysis
On the hourly chart of AUD/USD at FXOpen, the pair started a fresh increase from the 0.6185 support. The Aussie Dollar was able to clear the 0.62550 resistance to move into a positive zone against the US Dollar.
There was a close above the 0.6275 resistance and the 50-hour simple moving average. Finally, the pair tested the 0.6365 zone. A high was formed near 0.6363 and the pair is now correcting gains.
There was a move below the 0.6320 level. The pair declined below the 23.6% Fib retracement level of the upward move from the 0.6186 swing low to the 0.6363 high. On the downside, initial support is near a key bullish trend line at 0.6300.
The next major support is near the 50% Fib retracement level of the upward move from the 0.6186 swing low to the 0.6363 high at 0.6274.
If there is a downside break below the 0.6270 support, the pair could extend its decline toward the 0.6255 level. Any more losses might signal a move toward 0.6185.
On the upside, the AUD/USD chart indicates that the pair is now facing resistance near 0.6320. The first major resistance might be 0.6365. An upside break above the 0.6365 resistance might send the pair further higher.
The next major resistance is near the 0.6420 level. Any more gains could clear the path for a move toward the 0.6450 resistance zone.
Trade on TradingView with FXOpen. Consider opening an account and access over 700 markets with tight spreads from 0.0 pips and low commissions from $1.50 per lot.
This article represents the opinion of the Companies operating under the FXOpen brand only. It is not to be construed as an offer, solicitation, or recommendation with respect to products and services provided by the Companies operating under the FXOpen brand, nor is it to be considered financial advice.

AUDUSD: Wait for AB=CD pattern to get completed before buying! AUDUSD is currently making AB=CD pattern where AB pattern already formed, however, for CD pattern to be completed we need to wait NFP data to be published which will give inside data of future trend.
Like and comment for more
Thank you
❤️

audusd buyaud/usd buy
wave trend is up trend
1= trend is up trend
2 = aud/usd is on end correction
3= aud/usdo on 50% Fibonacci
4= aud/usd is up trend as you know trend is your friend so trade with trend

AUD/USD "The Aussie" Forex Market Heist Plan🌟Hi! Hola! Ola! Bonjour! Hallo! Marhaba!🌟
Dear Money Makers & Robbers, 🤑💰🐱👤🐱🏍
Based on 🔥Thief Trading style technical and fundamental analysis🔥, here is our master plan to heist the AUD/USD "The Aussie" Forex market. Please adhere to the strategy I've outlined in the chart, which emphasizes long entry. Our aim is the high-risk Red Zone. Risky level, overbought market, consolidation, trend reversal, trap at the level where traders and bearish robbers are stronger. 🏆💸Book Profits Be wealthy and safe trade.💪🏆🎉
Entry 📈 : "The vault is wide open! Swipe the Bullish loot at any price - the heist is on!
however I advise to Place buy limit orders within a 15 or 30 minute timeframe most recent or swing, low or high level. I Highly recommended you to put alert in your chart.
Stop Loss 🛑:
Thief SL placed at the recent / swing low level Using the 4H timeframe (0.62000) swing trade basis.
SL is based on your risk of the trade, lot size and how many multiple orders you have to take.
Target 🎯:
Primary Target - 0.64500 (or) Escape Before the Target
Secondary Target - 0.66000 (or) Escape Before the Target
🧲Scalpers, take note 👀 : only scalp on the Long side. If you have a lot of money, you can go straight away; if not, you can join swing traders and carry out the robbery plan. Use trailing SL to safeguard your money 💰.
📰🗞️Read the Fundamental, Macro, COT Report, Quantitative Analysis, Intermarket Analysis, Sentimental Outlook before start the plan.
AUD/USD "The Aussie" Forex Market market is currently experiencing a bullish trend,., driven by several key factors.
🟠Fundamental Analysis
Australian Economic Growth: Australia's economic growth is expected to remain steady, driven by the country's strong mining sector.
US Economic Growth: The US economic growth is expected to slow down, due to the ongoing trade tensions and weak domestic demand.
Interest Rate Differential: The interest rate differential between Australia and the US is expected to narrow, with Australia's interest rate at 3.1% and the US interest rate at 5.25%.
🟣Macro Economics
Inflation Rate: Australia's inflation rate is expected to remain steady at 2.5%, while the US inflation rate is expected to decrease to 2.2%.
Unemployment Rate: Australia's unemployment rate is expected to remain steady at 3.7%, while the US unemployment rate is expected to increase to 3.7%.
Global Trade: The ongoing trade tensions between the US and China are expected to have a minimal impact on the AUD/USD market.
🟡Global Market Analysis
Forex Market: The global forex market is experiencing a moderate increase in volatility, with the AUD/USD pair experiencing a 0.5% increase in the last 24 hours.
Commodity Market: The global commodity market is experiencing a moderate increase, with iron ore prices increasing by 1.2% in the last 24 hours.
Stock Market: The global stock market is experiencing a moderate decrease, with the S&P 500 index decreasing by 0.3% in the last 24 hours.
🔵COT Data
Speculators (Non-Commercials): 60,000 long positions and 40,000 short positions.
Hedgers (Commercials): 40,000 long positions and 60,000 short positions.
🟠Intermarket Analysis
Correlation with NZD/USD: AUD/USD has a positive correlation with NZD/USD, indicating that a strong New Zealand dollar could boost AUD/USD prices.
Correlation with Commodities: AUD/USD has a positive correlation with commodities, indicating that an increase in commodity prices could boost AUD/USD prices.
🟣Quantitative Analysis
Moving Averages: The 50-day moving average is at 0.62600, and the 200-day moving average is at 0.61800.
Relative Strength Index (RSI): The RSI is at 54, indicating a neutral market sentiment.
🔴Market Sentiment Analysis
The overall sentiment for AUD/USD is neutral, with a mix of positive and negative predictions.
58% of client accounts are long on this market, indicating a bullish sentiment.
🟢Positioning
The long/short ratio for AUD/USD is currently 1.2.
The open interest for AUD/USD is approximately 150,000 contracts.
🟡Next Trend Move
Bullish Prediction: Some analysts predict a potential bullish move, targeting 0.64000 and 0.64500, due to the interest rate differential and the weak dollar.
Bearish Prediction: Others predict a potential bearish move, targeting 0.62500 and 0.62000, due to the ongoing trade tensions and the strong dollar.
🔵Real-Time Market Feed
As of the current time, AUD/USD is trading at 0.63300, with a 0.5% increase in the last 24 hours.
⚪Future Prediction
Short-Term: Bullish: 0.63800-0.64300, Bearish: 0.62800-0.62300
Medium-Term: Bullish: 0.64800-0.65300, Bearish: 0.61800-0.61300
Long-Term: Bullish: 0.66300-0.66800, Bearish: 0.60300-0.59800
🟤Overall Summary Outlook
The market is expected to experience a moderate fluctuation, with some analysts predicting a potential bullish move targeting 0.64000 and 0.64500.
📌Keep in mind that these factors can change rapidly, and it's essential to stay up-to-date with market developments and adjust your analysis accordingly.
⚠️Trading Alert : News Releases and Position Management 📰 🗞️ 🚫🚏
As a reminder, news releases can have a significant impact on market prices and volatility. To minimize potential losses and protect your running positions,
we recommend the following:
Avoid taking new trades during news releases
Use trailing stop-loss orders to protect your running positions and lock in profits
💖Supporting our robbery plan 💥Hit the Boost Button💥 will enable us to effortlessly make and steal money 💰💵. Boost the strength of our robbery team. Every day in this market make money with ease by using the Thief Trading Style.🏆💪🤝❤️🎉🚀
I'll see you soon with another heist plan, so stay tuned 🤑🐱👤🤗🤩

AUDUSD Top-down analysis Hello traders, this is a complete multiple timeframe analysis of this pair. We see could find significant trading opportunities as per analysis upon price action confirmation we may take this trade. Smash the like button if you find value in this analysis and drop a comment if you have any questions or let me know which pair to cover in my next analysis.

AUD/USD Technical AnalysisCurrent Market Trend: Bearish 📉
AUD/USD has been in a strong downtrend, experiencing significant selling pressure. After a continuous decline, the pair has now found support around the 0.61900 level, where buyers have stepped in, leading to a short-term rebound.
Possible Scenarios:
📈 Bullish Scenario:
If AUD/USD manages to break and hold above the 0.62200 resistance level, we may see further upside movement toward 0.62300 and potentially 0.62800.
A successful breakout above 0.62800 could signal a trend reversal, leading to further bullish momentum.
📉 Bearish Scenario:
If the pair fails to break above 0.62200, selling pressure may increase, pushing the price lower.
A move below 0.61900 could indicate weakness, with the next downside targets at 0.61700 and 0.60900.
A break below 0.60900 would confirm a deeper bearish trend, opening the door for further downside moves.
Trading Strategy:
Bullish entry: After a confirmed breakout above 0.62200, targeting 0.62800 with a stop-loss below 0.61900.
Bearish entry: If the price rejects 0.62200, looking for short positions with targets at 0.61700 and 0.60900.

DeGRAM | AUDUSD came out of the channelAUDUSD is above the descending channel between the trend lines.
The price has already consolidated above the descending channel and is now moving from the dynamic resistance.
The chart is approaching the dynamic support, which previously acted as a growth point.
We expect the growth to continue after the retest of the lower trend line.
-------------------
Share your opinion in the comments and support the idea with like. Thanks for your support!

AUD/USD "The Aussie Dollar" Forex Market Bearish Heist Plan🌟Hi! Hola! Ola! Bonjour! Hallo!🌟
Dear Money Makers & Thieves, 🤑 💰🐱👤
Based on 🔥Thief Trading style technical and fundamental analysis🔥, here is our master plan to heist the AUD/USD "The Aussie Dollar" Forex market. Please adhere to the strategy I've outlined in the chart, which emphasizes long entry. Our aim is the high-risk Red Zone. Risky level, overbought market, consolidation, trend reversal, trap at the level where traders and bearish robbers are stronger. 🏆💸Be wealthy and safe trade.💪🏆🎉
Entry 📈 : "The vault is wide open! Swipe the Bullish loot at any price - the heist is on!
however I advise placing Buy Stop Orders above the breakout MA or Place Buy limit orders within a 15 or 30 minute timeframe. Entry from the most re cent or closest low or high level should be in retest.
Stop Loss 🛑: Thief SL placed at the recent / nearest low level Using the 4H timeframe,
SL is based on your risk of the trade, lot size and how many multiple orders you have to take.
Target 🎯: 0.65100 (or) Escape Before the Target
Scalpers, take note 👀 : only scalp on the Long side. If you have a lot of money, you can go straight away; if not, you can join swing traders and carry out the robbery plan. Use trailing SL to safeguard your money 💰.
📰🗞️Fundamental, Macro, COT, Sentimental Outlook:
AUD/USD "The Aussie Dollar" Forex Market is currently experiencing a Bullish trend., driven by several key factors.
💨 Fundamental Analysis
The AUD/USD pair is struggling due to dismal Goods Trade Balance data from Australia, a modest US Dollar uptick, February RBA rate cut bets, and US-China trade war fears. Australia's trade surplus has shrunk to a three-month low, and the latest Q4 Consumer Price Index (CPI) figures showed that headline inflation rose by 2.5% YoY, down from 2.8% in the previous quarter.
💨 Macro Economics
The Reserve Bank of Australia (RBA) has kept interest rates at record highs, while the US Federal Reserve (Fed) has trimmed the benchmark interest rate by 100 bps through 2024 and aims to slow the pace of cuts in 2025 . The Australian economy is expected to be affected by the US-China trade war, as China is its biggest export market.
💨 COT Analysis
Large speculators and asset managers remain net-long the US dollar index, although the latter has a more convincing bullish view . The Australian Dollar COT Index represents the positioning of large non-commercial (speculator) net positions minus large commercial (hedger) net positions.
💨 Key Takeaways
The AUD/USD pair is bearish due to weak Australian data, US Dollar strength, and trade war fears.
The RBA is expected to cut interest rates in February, while the Fed is slowing the pace of rate cuts.
Large speculators and asset managers remain net-long the US dollar index.
💨 Bullish Factors
RBA Rate Cut Priced In: Markets have already priced in a 25 basis point rate cut by the RBA, which could limit the downside potential for AUD/USD.
China's Economy Showing Signs of Recovery: China's latest economic data, including the Caixin Services PMI, has shown signs of recovery, which could boost demand for Australian exports and support the AUD.
Iron Ore Prices Rising: Iron ore prices have been rising due to supply disruptions and strong demand from China, which could support the AUD.
AUD/USD Oversold: The AUD/USD pair is currently oversold, with the Relative Strength Index (RSI) below 30, which could lead to a technical bounce.
US Dollar Overbought: The US Dollar is currently overbought, with the US Dollar Index (DXY) above 98, which could lead to a correction and support the AUD.
Positive Australian Data: Australia's latest economic data, including the Q4 Consumer Price Index (CPI) and the January employment report, has been positive, which could support the AUD.
Technical Support: The AUD/USD pair has technical support at 0.6200, which could limit the downside potential.
💨 Bullish Scenarios
AUD/USD breaks above 0.6300: A break above 0.6300 could lead to a rally towards 0.6400.
RBA surprises with no rate cut: If the RBA surprises markets with no rate cut, the AUD could rally towards 0.6500.
China's economy continues to recover: If China's economy continues to show signs of recovery, the AUD could benefit from increased demand for Australian exports.
💨 Market sentiment for AUD/USD is currently bullish, with 76% of traders holding long positions ¹. This is also reflected in IG's client sentiment data, which shows that 78% of client accounts are long on this market
However, it's essential to note that market sentiment can change rapidly, and it's crucial to consider other factors, such as technical analysis and fundamental data, when making trading decisions.
From a technical perspective, AUD/USD is struggling to capitalize on its recent recovery move from a multi-year low, dropping toward 0.6250 due to dismal Goods Trade Balance data from Australia
Fundamentally, the Australian economy is expected to be affected by the US-China trade war, as China is its biggest export market. The Reserve Bank of Australia (RBA) has kept interest rates at record highs, while the US Federal Reserve (Fed) has trimmed the benchmark interest rate by 100 bps through 2024 and aims to slow the pace of cuts in 2025
⚠️Trading Alert : News Releases and Position Management 📰 🗞️ 🚫🚏
As a reminder, news releases can have a significant impact on market prices and volatility. To minimize potential losses and protect your running positions,
we recommend the following:
Avoid taking new trades during news releases
Use trailing stop-loss orders to protect your running positions and lock in profits
📌Please note that this is a general analysis and not personalized investment advice. It's essential to consider your own risk tolerance and market analysis before making any investment decisions.
📌Keep in mind that these factors can change rapidly, and it's essential to stay up-to-date with market developments and adjust your analysis accordingly.
💖Supporting our robbery plan will enable us to effortlessly make and steal money 💰💵 Tell your friends, Colleagues and family to follow, like, and share. Boost the strength of our robbery team. Every day in this market make money with ease by using the Thief Trading Style.🏆💪🤝❤️🎉🚀
I'll see you soon with another heist plan, so stay tuned 🤑🐱👤🤗🤩

Market Analysis: AUD/USD Holds Strong—Are More Gains Ahead?Market Analysis: AUD/USD Holds Strong—Are More Gains Ahead?
AUD/USD is attempting a fresh increase from the 0.6350 support.
Important Takeaways for AUD/USD Analysis Today
- The Aussie Dollar found support at 0.6300 and recovered higher against the US Dollar.
- There is a connecting bullish trend line forming with support at 0.6365 on the hourly chart of AUD/USD at FXOpen.
AUD/USD Technical Analysis
On the hourly chart of AUD/USD at FXOpen, the pair formed a base above 0.6300. The Aussie Dollar started a decent increase above the 0.6350 resistance against the US Dollar, as mentioned in the previous analysis.
The pair even cleared 0.6400 before there was a minor pullback. The recent low was formed at 0.6351 and the pair is again rising. The bulls pushed the pair above the 50% Fib retracement level of the downward move from the 0.6408 swing high to the 0.6351 low.
However, the pair is still below the 50-hour simple moving average. On the upside, the AUD/USD chart indicates that the pair is now facing resistance near the 0.6385 zone. It is close to the 61.8% Fib retracement level of the downward move from the 0.6408 swing high to the 0.6351 low.
The first major resistance might be 0.6395. An upside break above the 0.6395 resistance might send the pair further higher. The next major resistance is near the 0.6410 level. Any more gains could clear the path for a move toward the 0.6450 resistance zone.
If not, the pair might correct lower. Immediate support sits near the 0.6365 level. There is also a connecting bullish trend line forming with support at 0.6365.
The next support could be 0.6350. If there is a downside break below the 0.6350 support, the pair could extend its decline toward the 0.6330 zone. Any more losses might signal a move toward 0.6300.
Trade on TradingView with FXOpen. Consider opening an account and access over 700 markets with tight spreads from 0.0 pips and low commissions from $1.50 per lot.
This article represents the opinion of the Companies operating under the FXOpen brand only. It is not to be construed as an offer, solicitation, or recommendation with respect to products and services provided by the Companies operating under the FXOpen brand, nor is it to be considered financial advice.

audusd buy signal. Don't forget about stop-loss.
Write in the comments all your questions and instruments analysis of which you want to see.
Friends, push the like button, write a comment, and share with your mates - that would be the best THANK YOU.
P.S. I personally will open entry if the price will show it according to my strategy.
Always make your analysis before a trade

AudUsd, rising or falling ?I expect price to test the previous day's low, 0.63300 zone to pick liquidity before heading higher, the previous day's candle was a full day's breakout. risk to reward is 1:6 trade with caution, see chart for more details

Ghost's AUD/USD Long Setup (Shorter Term Targets)AUD/USD has now seen a 350+ rally off the lows with no substantial pullback. A lot of the time this kind of price action occurs on AU, it tends to extend a lot further than most traders predict but also not to the overly bullish targets retail traders will spout off like 70+ cents.
While I think a revisit to the lows before a long-term bullrun can be seen for AU is likely, I'm aware that price is indicating it's looking for a healthy correction before target the .65 zone, which is the POC for the higher time frames we broke down from weeks ago with no retest.
For these reason and the general understanding of price action and market structure I see a lot on AUD/USD, I'm bullish in the short-term if we can get a steeper pullback to the .629 area after taking profits on my shorts for 50+ pips around .635.
Best of luck team, Ghost Traders FX now for the year of 2025 has 25 wins in a row, almost 500+ pips gained, 0 losses, improving our overall core strategy results to 135 Wins, 18 Breakevens, 7 losses pulling our WR back to 95%+
Feel good to be trading at my best agian.

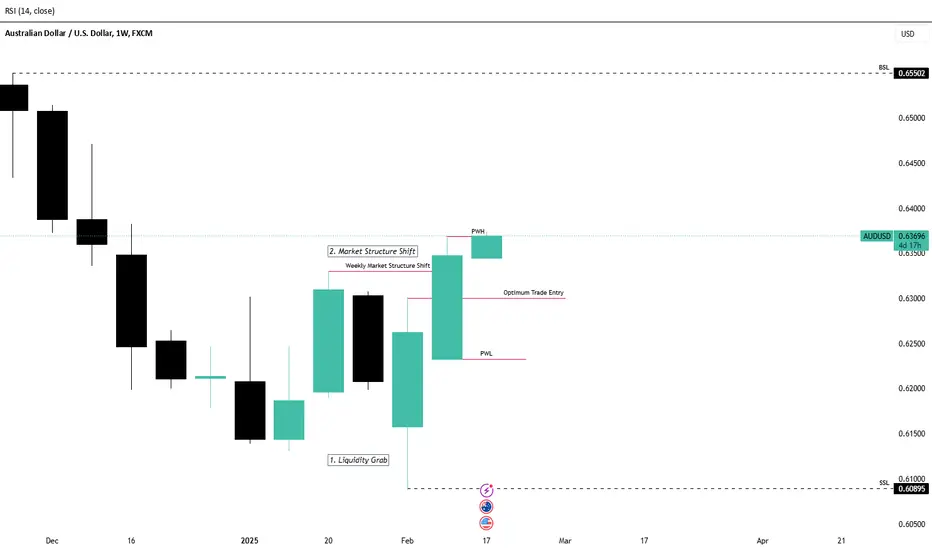
AUDUSD Weekly BiasThis pair is now on a bullish run considering that;
1. We had a liquidity grab at 0.61 Zone.
2. Market Structure Shift at 0.633.
The pair might aim towards the Buyside Liquidity at 0.655 and our entry positions might be around the 0.63 Zone.

AUD/USD Bullish Breakout Signals Further UpsideAUD/USD has broken out of a bullish flag pattern on the 4-hour timeframe, suggesting continued upward momentum. A buy entry is recommended at a retest of the former resistance level near 0.63700, now acting as support, aligning with a key bullish trendline.
Technical Observations:
Higher High Formation: The AUD/USD pair has established a higher high on the 4-hour chart, confirming an ongoing bullish trend.
Bullish Flag Breakout: Price has decisively broken above a well-defined bullish flag pattern, typically a continuation pattern that signals further upside.
Support Confirmation: The 0.63700 level, previously acting as resistance, is anticipated to act as support upon a retest.
Trendline Confluence: A bullish trendline further reinforces the support zone near the 0.63700 level.
Trading Recommendation:
Entry Point: Buy AUD/USD near the retest of the 0.63700 level.
Stop Loss: Place a stop loss at 0.63200 to manage risk.
Take Profit 1: 0.64200
Take Profit 2: 0.64700
Disclaimer:
This analysis is for informational purposes only and does not constitute financial advice. Trading involves risk, and you should carefully consider your risk tolerance before making any investment decisions.

AUDUSD Intra Day SetupAUDUSD has confirmed bullish momentum on the higher timeframes, with an intraday setup targeting the next 4-hour high.

AUDUSD - Look for a short !!Hello traders!
‼️ This is my perspective on AUDUSD.
Technical analysis: Here we are in a bearish market structure from 4H timeframe perspective, so I look for a short. As we can see price took buy side liquidity and now it's in bearish OB, I expect to see BOS on lower timeframe to open the trade.
Fundamental news: Upcoming week on Tuesday (GMT+2) we will see results of Cash Rate on AUD and on Thursday (GMT+2) we have Unemployment Rate. News with high impact on currency.
Like, comment and subscribe to be in touch with my content!

#AUDUSD 1DAYAUDUSD (4H Timeframe) Analysis
Market Structure:
The price has been in a downtrend but has now broken above the downtrend resistance, signaling a potential shift in market direction. A breakout from this level suggests that buyers are gaining strength, possibly leading to further bullish movement.
Forecast:
A buy opportunity may arise as the breakout indicates a change in trend. Waiting for a retest of the breakout level for confirmation can provide a stronger entry point.
Key Levels to Watch:
- Entry Zone: A buy position can be considered after a successful breakout and retest of the previous resistance as support.
- Risk Management:
- Stop Loss: Placed below the breakout level to minimize risk.
- Take Profit: Target key resistance zones where price may face selling pressure.
Market Sentiment:
The breakout of the downtrend resistance suggests that bullish momentum is increasing. A confirmed retest with strong price action can provide better confirmation for an upward move.

AUD/USD Trades Near Year’s High After RBA DecisionAUD/USD Trades Near Year’s High After RBA Decision
Today, the Reserve Bank of Australia (RBA) eased monetary policy, cutting the interest rate from 4.35% to 4.10%, according to Forex Factory.
As reported by Reuters:
→ This marks the first easing since the 2020 pandemic;
→ RBA Governor Michele Bullock stated that market expectations for two more cuts this year are “ambitious”;
→ The bank’s leadership remains cautious about further easing prospects.
While analysts had accurately predicted the February rate cut, AUD/USD saw volatility without a significant move, possibly because market participants are more focused on Trump’s tariff plans, which could impact global trade and Forex markets.
Technical Analysis of AUD/USD Today
Since mid-December, the AUD/USD pair has mostly traded within the 0.6200–0.6300 range, except for early February’s sharp drop when Trump’s tariff policies shook currency markets.
However, demand appears resilient:
→ After plunging to around 0.6100, the price quickly rebounded into the range;
→ Arrows highlight rapid recoveries after short-term dips;
→ A blue ascending trend channel is forming on the chart.
These factors suggest growing appeal for the Australian dollar, with the 0.6300 level potentially acting as support going forward.
Trade on TradingView with FXOpen. Consider opening an account and access over 700 markets with tight spreads from 0.0 pips and low commissions from $1.50 per lot.
This article represents the opinion of the Companies operating under the FXOpen brand only. It is not to be construed as an offer, solicitation, or recommendation with respect to products and services provided by the Companies operating under the FXOpen brand, nor is it to be considered financial advice.

#AUDUSD 4HAUDUSD (4H Timeframe) Analysis
Market Structure:
The price is forming an expanding pattern, indicating increased volatility and uncertainty in market direction. Additionally, a sell engulfing candlestick has appeared, suggesting strong bearish momentum and potential downside movement.
Forecast:
A sell opportunity is anticipated as the expanding pattern, combined with the sell engulfing area, signals increased selling pressure.
Key Levels to Watch:
- Entry Zone: A sell position can be considered near the recent resistance area where the sell engulfing pattern has formed.
- Risk Management:
- Stop Loss: Placed above the recent swing high to manage risk.
- Take Profit: Target lower support levels for potential downside movement.
Market Sentiment:
The formation of an expanding pattern with a sell engulfing candlestick suggests that bearish pressure is increasing. Monitoring price action and confirmation signals before entry will help align with the prevailing trend.

EURUSD and AUDUSD Top-down analysis Hello traders, this is a complete multiple timeframe analysis of this pair. We see could find significant trading opportunities as per analysis upon price action confirmation we may take this trade. Smash the like button if you find value in this analysis and drop a comment if you have any questions or let me know which pair to cover in my next analysis.

AUDUSD Weekly BiasThis pair is now on a bullish run considering that;
1. We had a liquidity grab at 0.61 Zone.
2. Market Structure Shift at 0.633.
The pair might aim towards the Buyside Liquidity at 0.655 and our entry positions might be around the 0.63 Zone.
Ghost's AUD/USD Setup [LONG/SHORT]I believe at the moment shorts and longs are valid, shorts on the short-term, longs for the long-term no pun intended.
We have an equal low created leaving behind internal liquidity I am expecting to be swept before price can continue higher, 0.617 to me seems to be a strong & critical area of price for the current environment and as such, could be tapped before price continues to .65+.
RBA interest rate decision is around the corner & COT positioning is indicating profit take so be careful gang.
As it stands right now GTFX is on a 22 win streak, almost 300 pips acquired for 2025 already and a lot more to come.
