AUDUSD Analysis – Falling from the Rising WedgeAUDUSD pair broke below an ascending wedge, a bearish reversal pattern.
Clean rejection from 0.6518, with lower highs and new lower lows confirming bearish momentum.
Price is now sitting below former trendline support, retested and respected as resistance.
Bearish target points toward 0.6400–0.6380 zone, aligning with recent swing lows.
Risk invalidation sits above 0.6520, where structure fails.
Technical Bias: Bearish
Target: 0.6400
Stop-loss zone: Above 0.6520
📊 Current Bias: Bearish
🔍 Key Fundamentals Driving AUDUSD
AUD Fundamentals (Weakening):
Australian jobs data was mixed, and wage growth has plateaued.
RBA remains cautious, with expectations for rate cuts later in 2025.
AUD pressured by China growth risks and weak commodity demand.
Geopolitical drag: Australia-China tensions and weak Chinese retail data from 618 Festival dampen AUD outlook.
USD Fundamentals (Resilient):
USD remains bid on risk-off flows, especially after weak global data and ongoing Middle East tensions.
Fed remains reluctant to cut fast despite disinflation signs – supports the USD.
US data is mixed, but rate cut odds are declining (only one expected in 2025 now per dot plot).
⚠️ Risks to This Bearish View
If China announces new stimulus, AUD could rebound sharply.
A dovish surprise from the Fed (e.g. Powell softening in speeches).
Sharp rebound in risk appetite (e.g. tech-led equity rally).
🗓️ Important Events to Watch
🇨🇳 China industrial profits & PMIs
🇦🇺 RBA Meeting Minutes (July preview hints)
🇺🇸 US Core PCE (June 28)
Global risk tone: watch metals, equities, and geopolitical headlines.
🚀 Which Asset Leads?
AUDUSD is lagging other USD pairs, but will likely lead commodity FX downside if China or metals weaken further.
Watch AUDJPY and EURAUD for further confirmation of risk-off flows and Aussie weakness.
Audusdforecast

AUDUSD Selling Trading IdeaHello Traders
In This Chart AUDUSD HOURLY Forex Forecast By FOREX PLANET
today AUDUSD analysis 👆
🟢This Chart includes_ (AUDUSD market update)
🟢What is The Next Opportunity on AUDUSD Market
🟢how to Enter to the Valid Entry With Assurance Profit
This CHART is For Trader's that Want to Improve Their Technical Analysis Skills and Their Trading By Understanding How To Analyze The Market Using Multiple Timeframes and Understanding The Bigger Picture on the Chart

Audusd setup Here's a bullish analysis on AUD/USD (generic and adaptable to most timeframes; if you want it based on a specific chart or timeframe, let me know):
---
📈 AUD/USD Bullish Analysis
1. Support Zone Holding Strong:
AUD/USD has established a firm support level around where price has bounced multiple times.
Recent price action shows a double bottom or rounded base formation, indicating demand buildup.
2. Bullish Trendline Formation:
A new higher low structure is forming, suggesting a shift in momentum.
Price is respecting a short-term ascending trendline, signaling continued buying interest.
3. Breakout Confirmation:
A bullish breakout above the 0.6650 resistance opens room for an upward move.
Next target levels: 0.6700 and 0.6780.
4. RSI & Momentum Indicators:
RSI trending above 50, showing strength.
Bullish divergence on momentum indicators confirms possible upside continuation.
5. Fundamentals (Optional Context):
AUD supported by improving risk sentiment and commodity strength (especially iron ore and gold).
USD weakening slightly due to lower rate hike expectations from the Fed.
---
🎯 Bullish Targets:
Entry zone: 0.6620–0.6640
Target 1: 0.6700
Target 2: 0.6780
Stop-loss: Below support

AUDUSD(20250617)Today's AnalysisMarket news:
Revised version of the Republican tax cut bill in the US Senate: It is planned to raise the debt ceiling to 5 trillion, and the overall framework is consistent with the House version.
Technical analysis:
Today's buying and selling boundaries:
0.6512
Support and resistance levels:
0.6597
0.6566
0.6545
0.6480
0.6459
0.6428
Trading strategy:
If the price breaks through 0.6545, consider buying, and the first target price is 0.6566
If the price breaks through 0.6512, consider selling, and the first target price is 0.6480

Week of 6/15/25: AU AnalysisLast week took the prior week's high and showed large rejection. Expecting this week to take the weak low and liquidity from all the lows to at least the extreme of the daily swing.
Major news:
FOMC - Wednesday

AUD/USD Aims Steady IncreaseAUD/USD Aims Steady Increase
AUD/USD started a decent increase above the 0.6450 and 0.6500 levels.
Important Takeaways for AUD USD Analysis Today
- The Aussie Dollar rebounded after forming a base above the 0.6400 level against the US Dollar.
- There is a connecting bullish trend line forming with support at 0.6510 on the hourly chart of AUD/USD at FXOpen.
AUD/USD Technical Analysis
On the hourly chart of AUD/USD at FXOpen, the pair started a fresh increase from the 0.6450 support. The Aussie Dollar was able to clear the 0.6500 resistance to move into a positive zone against the US Dollar.
There was a close above the 0.6500 resistance and the 50-hour simple moving average. Finally, the pair tested the 0.6535 zone. A high was formed near 0.6533 and the pair recently started a consolidation phase.
There was a move below the 0.6520 level. The pair dipped below the 23.6% Fib retracement level of the upward move from the 0.6489 swing low to the 0.6533 high.
On the downside, initial support is near the 0.6510 level. There is also a connecting bullish trend line forming with support at 0.6510. It is close to the 50% Fib retracement level of the upward move from the 0.6489 swing low to the 0.6533 high.
The next major support is near the 0.6480 zone. If there is a downside break below the 0.6480 support, the pair could extend its decline toward the 0.6450 level.
Any more losses might signal a move toward 0.6420. On the upside, the AUD/USD chart indicates that the pair is now facing resistance near 0.6535. The first major resistance might be 0.6550. An upside break above the 0.6580 resistance might send the pair further higher.
The next major resistance is near the 0.6600 level. Any more gains could clear the path for a move toward the 0.6650 resistance zone.
This article represents the opinion of the Companies operating under the FXOpen brand only. It is not to be construed as an offer, solicitation, or recommendation with respect to products and services provided by the Companies operating under the FXOpen brand, nor is it to be considered financial advice.
audusd sell signal. Don't forget about stop-loss.
Write in the comments all your questions and instruments analysis of which you want to see.
Friends, push the like button, write a comment, and share with your mates - that would be the best THANK YOU.
P.S. I personally will open entry if the price will show it according to my strategy.
Always make your analysis before a trade

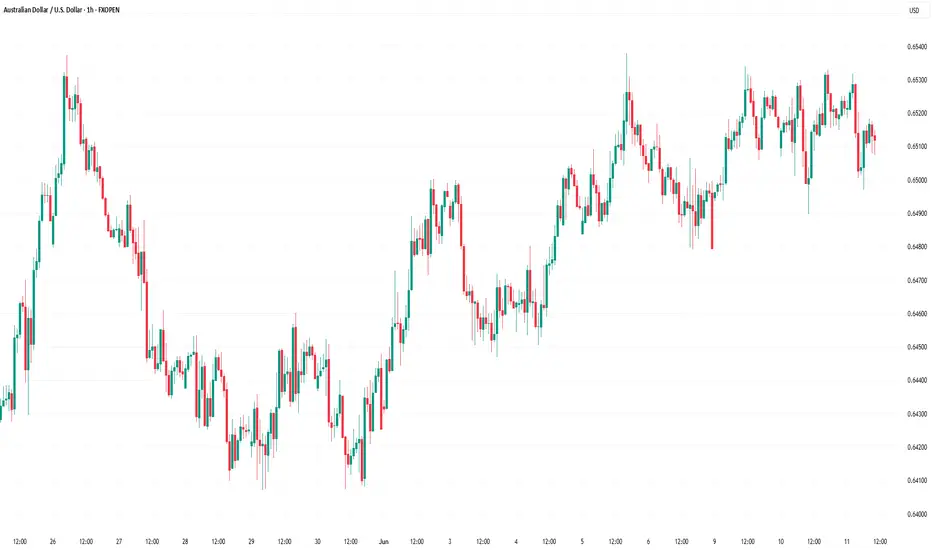
AUD Bulls Charge on China CPI & Trade HopesOANDA:AUDUSD is trading near 0.6510, buoyed by China’s better-than-expected May CPI print at -0.1% YoY (vs forecast of -0.4%) and optimism over the renewed U.S.-China trade dialogue, which has improved global risk sentiment.
Despite weak CMCMARKETS:AUDUSD Australian Q1 GDP and a narrower trade surplus, the Aussie remains firm as a proxy for Chinese demand and commodity-linked risk appetite.
From a technical perspective, the pair is moving within an ascending hourly channel and is currently testing key resistance at 0.6517. A confirmed breakout could clear the path toward monthly resistance at 0.6582. However, failure to break higher may see a pullback to 0.6492, or deeper to the critical support at 0.6411. As long as the channel structure remains intact, the bias stays bullish.
Resistance : 0.6517 , 0.6582
Support : 0.6492 , 0.6411

Week of 6/8/25: AU AnalysisLast week swept the high of the prior week and immediately got rejected. We are expecting that the low that swept the high is weak on the HTF and will be following 1h internal structure bearish until the low is at least taken out.
Major news:
Core CPI - Wednesday

AUDUSD SELL OPPORTUNITY Don't be deceived
Sell opportunity on AUDUSD
Entry: 1.65000
Sl: 1.65200
TP: 1.6400
Comment your opinion
Follow me on X for account management

03.06.25 AUDUSD Trade Recap (Breakeven Manual Close)A long position taken on AUDUSD for a breakeven manual close, full explanation as to why I made this decision in the recap and my current thoughts on this pairs next move

audusd sell signal. Don't forget about stop-loss.
Write in the comments all your questions and instruments analysis of which you want to see.
Friends, push the like button, write a comment, and share with your mates - that would be the best THANK YOU.
P.S. I personally will open entry if the price will show it according to my strategy.
Always make your analysis before a trade

Week of 6/1/25: AU AnalysisA lot of consolidation from the prior week, all time frames are technically bullish and internal 1h structure is bullish. I am going to be cautious around the current level until there is a prime entry model to get in long.
Major news:
PMI - Monday
PMI/ADP NFP - Wed
Unemployment Claims - Thurs
NFP/Unemployment rate - Friday

AUDUSD LONG FORECAST Q2 W22 D29 Y25👀 AUDUSD LONG FORECAST Q2 W22 D29 Y25
Professional Risk Managers👋
Welcome back to another FRGNT chart update📈
Diving into some Forex setups using predominantly higher time frame order blocks alongside intraday confirmation & breaks of structure.
Let’s see what price action is telling us today! 🔥
💡Here are some trade confluences📝
✅Weekly 50 EMA
✅Daily 50 EMA
✅15’ order block
✅Intraday bullish breaks of structure
🔑 Remember, to participate in trading comes always with a degree of risk, therefore as professional risk managers it remains vital that we stick to our risk management plan as well as our trading strategies.
📈The rest, we leave to the balance of probabilities.
💡Fail to plan. Plan to fail.
🏆It has always been that simple.
❤️Good luck with your trading journey, I shall see you at the very top.
🎯Trade consistent, FRGNT X

Market Analysis: AUD/USD Faces Pressure, Dips AgainMarket Analysis: AUD/USD Faces Pressure, Dips Again
AUD/USD declined below the 0.6500 and 0.6460 support levels.
Important Takeaways for AUD/USD Analysis Today
- The Aussie Dollar started a fresh decline from well above the 0.6500 level against the US Dollar.
- There is a connecting bearish trend line forming with resistance at 0.6460 on the hourly chart of AUD/USD at FXOpen.
AUD/USD Technical Analysis
On the hourly chart of AUD/USD at FXOpen, the pair struggled to clear the 0.6520 zone. The Aussie Dollar started a fresh decline below the 0.6500 support against the US Dollar.
The pair even settled below 0.6460 and the 50-hour simple moving average. There was a clear move below 0.6450. A low was formed at 0.6435 and the pair is now consolidating.
On the upside, an immediate resistance is near the 0.6460 level and the 23.6% Fib retracement level of the downward move from the 0.6537 swing high to the 0.6435 low.
The next major resistance is near the 0.6485 zone or the 50% Fib retracement level of the downward move from the 0.6537 swing high to the 0.6435 low, above which the price could rise toward 0.6515.
Any more gains might send the pair toward the 0.6535 resistance. A close above the 0.6535 level could trigger another steady increase in the near term. The next major resistance on the AUD/USD chart could be 0.6600.
On the downside, initial support is near the 0.6435 zone. The next support sits at 0.6410. If there is a downside break below 0.6410, the pair could extend its decline. The next support could be 0.6350. Any more losses might send the pair toward the 0.6320 support.
This article represents the opinion of the Companies operating under the FXOpen brand only. It is not to be construed as an offer, solicitation, or recommendation with respect to products and services provided by the Companies operating under the FXOpen brand, nor is it to be considered financial advice.

AUDUSD Daily Squeeze – Breakout LoadingAUDUSD is pressing against descending trendline resistance, forming a bullish continuation wedge just above the 0.6420–0.6450 support zone (50% Fib level). Price has been consolidating tightly, suggesting a potential breakout setup is developing.
Key Levels:
Resistance: 0.6500 – 0.6547 (wedge top and 61.8% Fib)
Support: 0.6420 (local structure), 0.6300 (deeper demand zone)
Bullish Target: 0.6718 → 0.6900 → 0.6950
Invalidation: Daily close below 0.6410
Scenarios:
🔹 Bullish Breakout
Clean break above wedge resistance
Momentum push toward 0.6700–0.6900 zone
Confirmation = daily close above 0.6547 (Fib confluence)
🔹 Fakeout + Pullback
Temporary rejection leads to retest of 0.6420–0.6400
Holds support = high-probability long setup for second wave up
Outlook:
Bias: Bullish
AUDUSD is building bullish pressure after defending key support. Wedge structure favors breakout continuation, especially if global risk sentiment remains firm and USD softens.

Week of 5/25/25: AU AnalysisBullish previous week leads for my bias being bullish this week as well until price reaches the next Daily supply zone which we will look to trade the pullback.
Thanks for stopping by goodluck this week!
Major news:
PMI - Thursday

THERE IS POTENTIAL - AUDUSD SHORT FORECAST Q2 W21 D23 Y25AUDUSD SHORT FORECAST Q2 W21 D23 Y25
BE SMART- AWAIT A BREAK OF STRUCTURE FIRST!
Professional Risk Managers👋
Welcome back to another FRGNT chart update📈
Diving into some Forex setups using predominantly higher time frame order blocks alongside confirmation breaks of structure.
Let’s see what price action is telling us today!
💡Here are some trade confluences📝
✅4H Order Block
✅Tokyo ranges to be filled
✅15' order block identified
✅Weekly 50 EMA forecasting rejection
✅Daily 50 EMA target
🔑 Remember, to participate in trading comes always with a degree of risk, therefore as professional risk managers it remains vital that we stick to our risk management plan as well as our trading strategies.
📈The rest, we leave to the balance of probabilities.
💡Fail to plan. Plan to fail.
🏆It has always been that simple.
❤️Good luck with your trading journey, I shall see you at the very top.
🎯Trade consistent, FRGNT X

CAUTION 50'EMA NOT ON SIDE AUDUSD SHORT FORECAST Q2 W21 D22 Y25CAUTION 50'EMA NOT ON SIDE AUDUSD SHORT FORECAST Q2 W21 D22 Y25
Professional Risk Managers👋
Welcome back to another FRGNT chart update📈
Diving into some Forex setups using predominantly higher time frame order blocks alongside confirmation breaks of structure.
Let’s see what price action is telling us today!
💡Here are some trade confluences📝
✅4H Order Block
✅Tokyo ranges to be filled
✅15' order block identified
✅Weekly 50 EMA forecasting rejection
✅Daily 50 EMA target
🔑 Remember, to participate in trading comes always with a degree of risk, therefore as professional risk managers it remains vital that we stick to our risk management plan as well as our trading strategies.
📈The rest, we leave to the balance of probabilities.
💡Fail to plan. Plan to fail.
🏆It has always been that simple.
❤️Good luck with your trading journey, I shall see you at the very top.
🎯Trade consistent, FRGNT X

IF THE SHOE FITS... AUDUSD SHORT FORECAST Q2 W21 D21 Y25AUDUSD SHORT FORECAST Q2 W21 D21 Y25
Professional Risk Managers👋
Welcome back to another FRGNT chart update📈
Diving into some Forex setups using predominantly higher time frame order blocks alongside confirmation breaks of structure.
Let’s see what price action is telling us today!
💡Here are some trade confluences📝
✅4H Order Block
✅Tokyo ranges to be filled
✅15' order block identified
✅Weekly 50 EMA
✅Daily 50 EMA
🔑 Remember, to participate in trading comes always with a degree of risk, therefore as professional risk managers it remains vital that we stick to our risk management plan as well as our trading strategies.
📈The rest, we leave to the balance of probabilities.
💡Fail to plan. Plan to fail.
🏆It has always been that simple.
❤️Good luck with your trading journey, I shall see you at the very top.
🎯Trade consistent, FRGNT X

audusd sell signal. Don't forget about stop-loss.
Write in the comments all your questions and instruments analysis of which you want to see.
Friends, push the like button, write a comment, and share with your mates - that would be the best THANK YOU.
P.S. I personally will open entry if the price will show it according to my strategy.
Always make your analysis before a trade

Aussie Turns Bullish — All Eyes on RBACMCMARKETS:AUDUSD AUD/USD trades near 0.6448 ahead of the RBA rate decision, where a 25bps cut to 3.85% is widely expected. Technically, a breakout above the falling trendline suggests a potential bullish reversal. Immediate support lies at 0.6422–0.6406. A rejection near minor resistance at 0.6456 could trigger a pullback, while a sustained break above that level may open room for gains beyond 0.6500. Market direction hinges on RBA’s tone and Governor Bullock’s guidance on future easing.
Resistance : 0.6456 , 0.6500
Support : 0.6422 , 0.6406

Week of 5/18/25: Audusd AnalysisAU is bearish in the short-term until 1h timeframe shifts back to bullish to align with 4h and daily structure. We're looking for shorts in the meantime until price reaches the extreme of the swing structure.
Major News:
Unemployment - Thursday
