AUD)USD) resistance level back down Read The ChaptianSMC Trading point update
Technical analysis for the AUD/USD pair on the 1-hour timeframe. Here's a breakdown of the idea presented:
Key Elements:
1. Resistance Level (0.65000 - 0.65200 area):
Price is approaching this strong resistance zone.
RSI is in the overbought zone (above 70), indicating potential reversal or correction.
2. Expected Price Action:
The chart suggests that price may spike into the resistance area (possibly a liquidity grab).
After hitting resistance, a drop is expected toward the FVG (Fair Value Gap) zone.
3. FVG and Target Zone (~0.64059):
There’s a highlighted Fair Value Gap that may attract price for mitigation.
Target point is near the EMA200 level and inside a previous structure zone.
This area also aligns with the RSI cooling off.
4. Support Level (~0.63600):
Marked as a stronger support area, though the current trade setup doesn't expect price to reach there soon.
5. EMA200 (blue line around 0.64202):
Acts as dynamic support.
Target is slightly below this EMA, potentially a liquidity sweep before a bounce.
Mr SMC Trading point
---
Summary of the Idea:
Bearish bias after a resistance rejection.
Look for short opportunities around the resistance zone (0.6500 area).
Target near 0.6405–0.6420 (FVG + EMA200).
Overbought RSI supports this pullback expectation.
Pelas support boost 🚀 analysis follow)
Audusdforecast

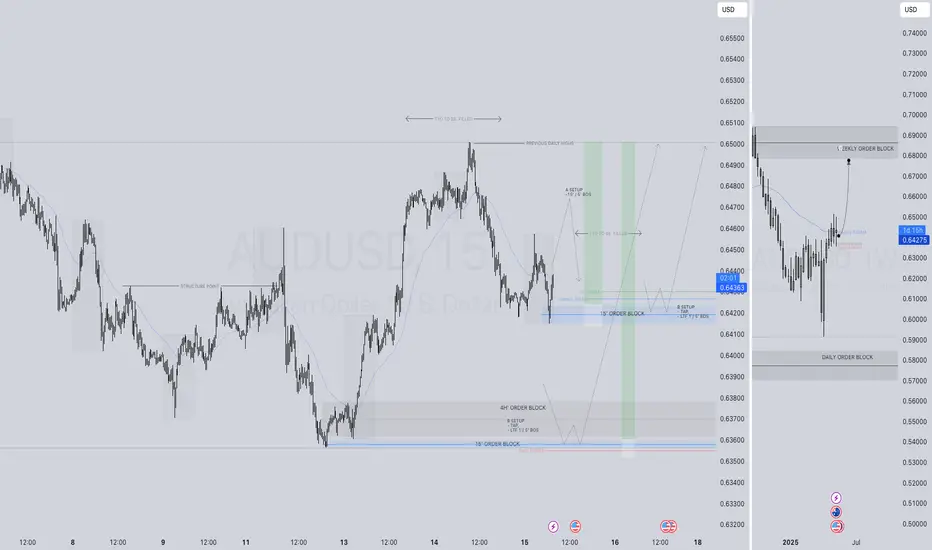
AUDUSD LONG FORECAST Q2 W20 D15 Y25AUDUSD LONG FORECAST Q2 W20 D15 Y25
Professional Risk Managers👋
Welcome back to another FRGNT chart update📈
Diving into some Forex setups using predominantly higher time frame order blocks alongside confirmation breaks of structure.
Let’s see what price action is telling us today!
💡Here are some trade confluences📝
✅Daily order block rejection
✅15’ order block identified
✅Tokyo ranges to be filled
✅Intraday bullish breaks of structure to be confirmed
🔑 Remember, to participate in trading comes always with a degree of risk, therefore as professional risk managers it remains vital that we stick to our risk management plan as well as our trading strategies.
📈The rest, we leave to the balance of probabilities.
💡Fail to plan. Plan to fail.
🏆It has always been that simple.
❤️Good luck with your trading journey, I shall see you at the very top.
🎯Trade consistent, FRGNT X
AUD/USD "The Aussie" Forex Bank Money Heist (Bullish)🌟Hi! Hola! Ola! Bonjour! Hallo! Marhaba!🌟
Dear Money Makers & Robbers, 🤑 💰💸✈️
Based on 🔥Thief Trading style technical and fundamental analysis🔥, here is our master plan to heist the AUD/USD "The Aussie" Forex Bank Heist. Please adhere to the strategy I've outlined in the chart, which emphasizes long entry. Our aim is to escape near the high-risk Red Zone. It's a Risky level, overbought market, consolidation, trend reversal, trap at the level where traders and bearish robbers are stronger. 🏆💸"Take profit and treat yourself, traders. You deserve it!💪🏆🎉
Entry 📈 : "The heist is on! Wait for the MA Pullback at Institutional Buy zone (0.63700) & (0.62800) then make your move - Bullish profits await!"
Stop Loss 🛑: "🔊 Yo, listen up! 🗣️ If you're lookin' to get in on a buy stop order, don't even think about settin' that stop loss till after the breakout 🚀. You feel me? Now, if you're smart, you'll place that stop loss where I told you to 📍, but if you're a rebel, you can put it wherever you like 🤪 - just don't say I didn't warn you ⚠️. You're playin' with fire 🔥, and it's your risk, not mine 👊."
📍 Thief SL placed at the nearest/swing low level Using the 2H timeframe "Big Money buy" SL at (0.64000) & "Institutional Buy" SL at (0.62000) Swing trade basis.
📍 SL is based on your risk of the trade, lot size and how many multiple orders you have to take.
🏴☠️Target 🎯: 0.67000
🧲Scalpers, take note 👀 : only scalp on the Long side. If you have a lot of money, you can go straight away; if not, you can join swing traders and carry out the robbery plan. Use trailing SL to safeguard your money 💰.
💰💵💸AUD/USD "The Aussie" Forex Bank Money Heist is currently experiencing a bullishness,., driven by several key factors. .☝☝☝
⚠️Trading Alert : News Releases and Position Management 📰🗞️🚫🚏
As a reminder, news releases can have a significant impact on market prices and volatility. To minimize potential losses and protect your running positions,
we recommend the following:
Avoid taking new trades during news releases
Use trailing stop-loss orders to protect your running positions and lock in profits.
💖Supporting our robbery plan 💥Hit the Boost Button💥 will enable us to effortlessly make and steal money 💰💵. Boost the strength of our robbery team. Every day in this market make money with ease by using the Thief Trading Style.🏆💪🤝❤️🎉🚀
I'll see you soon with another heist plan, so stay tuned 🤑🐱👤🤗🤩

AUDUSD(20250514)Today's AnalysisMarket news:
The U.S. unadjusted CPI annual rate unexpectedly dropped to 2.3% in April, the lowest since February 2021.
Technical analysis:
Today's buying and selling boundaries:
0.6435
Support and resistance levels:
0.6552
0.6508
0.6480
0.6390
0.6362
0.6318
Trading strategy:
If the price breaks through 0.6480, consider buying, the first target price is 0.6508
If the price breaks through 0.6435, consider selling, the first target price is 0.6390

Market Analysis: AUD/USD Ready to Climb AgainMarket Analysis: AUD/USD Ready to Climb Again
AUD/USD is attempting a fresh increase from the 0.6370 support.
Important Takeaways for AUD/USD Analysis Today
- The Aussie Dollar found support at 0.6370 and recovered higher against the US Dollar.
- There was a break above a key bearish trend line with resistance at 0.6410 on the hourly chart of AUD/USD at FXOpen.
AUD/USD Technical Analysis
On the hourly chart of AUD/USD at FXOpen, the pair formed a base above 0.6420. The Aussie Dollar started a decent increase above the 0.6450 resistance against the US Dollar, as mentioned in the previous analysis.
The pair even cleared 0.6500 before there was a minor pullback. The recent low was formed at 0.6370 and the pair is again rising. The bulls pushed the pair above the 23.6% Fib retracement level of the downward move from the 0.6514 swing high to the 0.6370 low.
Besides, there was a break above a key bearish trend line with resistance at 0.6410. The pair is now consolidating above the 50-hour simple moving average. On the upside, the AUD/USD chart indicates that the pair is now facing resistance near the 0.6440 zone.
The first major resistance might be 0.6460 and the 61.8% Fib retracement level of the downward move from the 0.6514 swing high to the 0.6370 low. An upside break above the 0.6460 resistance might send the pair further higher. The next major resistance is near the 0.6515 level. Any more gains could clear the path for a move toward the 0.6550 resistance zone.
If not, the pair might correct lower. Immediate support sits near the 0.6410 level. The next support could be 0.6370. If there is a downside break below the 0.6370 support, the pair could extend its decline toward the 0.6320 zone. Any more losses might signal a move toward 0.6300.
This article represents the opinion of the Companies operating under the FXOpen brand only. It is not to be construed as an offer, solicitation, or recommendation with respect to products and services provided by the Companies operating under the FXOpen brand, nor is it to be considered financial advice.

Week of 5/11/25: AUDUSD AnalysisDaily is bullish, so in the future price possibly will trend up.
In the meantime 4h and 1h are bearish but has reached a critical daily demand zone at the extreme of daily structure.
So far 1h internal is bullish, so we are still looking for longs cautiously until structure is broken.
Major news:
China trade talks - Monday
CPI - Tuesday
PPI/Unemployment - Thursday

AUDUSD LONG FORECAST Q2 W20 D12 Y25AUDUSD LONG FORECAST Q2 W20 D12 Y25
Professional Risk Managers👋
Welcome back to another FRGNT chart update📈
Diving into some Forex setups using predominantly higher time frame order blocks alongside confirmation breaks of structure.
Let’s see what price action is telling us today!
💡Here are some trade confluences📝
✅Daily order block rejection
✅15’ order block identified
✅Tokyo ranges to be filled
✅Intraday bullish breaks of structure to be confirmed
🔑 Remember, to participate in trading comes always with a degree of risk, therefore as professional risk managers it remains vital that we stick to our risk management plan as well as our trading strategies.
📈The rest, we leave to the balance of probabilities.
💡Fail to plan. Plan to fail.
🏆It has always been that simple.
❤️Good luck with your trading journey, I shall see you at the very top.
🎯Trade consistent, FRGNT X

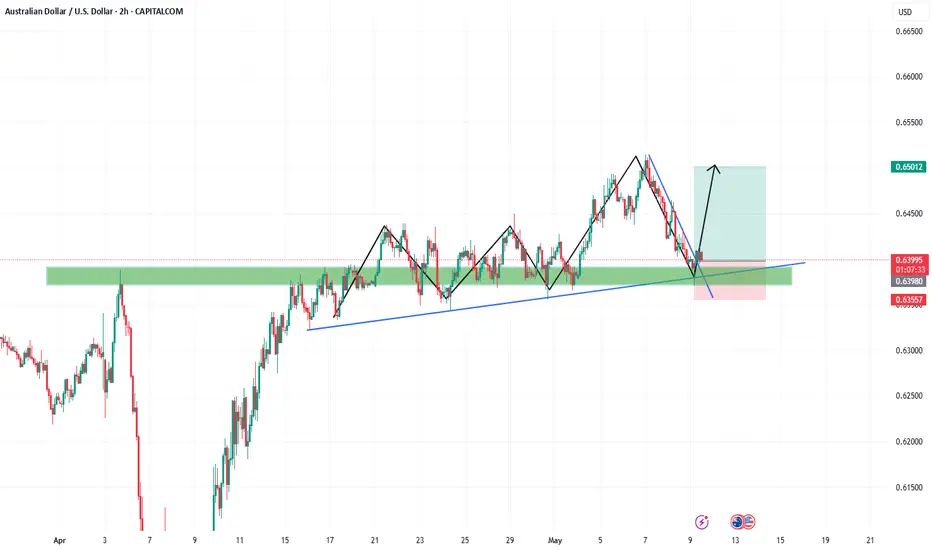
AUDUSD Bearish Breakout – Macro and Technicals AlignAUDUSD has broken below a rising wedge formation on the 4H chart, signaling a bearish continuation. With the Reserve Bank of Australia pausing rates and weak local data weighing on sentiment, while the Federal Reserve maintains a hawkish hold due to sticky labor costs, this trade sets up well both technically and fundamentally. I'm watching for downside continuation toward 0.6379 and potentially 0.6350. The bearish bias is invalidated on a move above 0.6475.
🔍 Technical Analysis
Structure: Price broke down from a rising wedge and continues forming bear flags — each followed by further selling pressure.
Current Price Action:
Rejected sharply at ~0.6475 (last swing high)
Confirmed breakout with downside momentum
Key Support Levels:
0.6379 – minor structural support
0.6350 – major support zone from April
Resistance / Invalidation:
Above 0.6475 – would break the bearish structure and negate the setup
Bias: Bearish — clean structure, breakout momentum, and sustained lower highs
🌏 Fundamental Context
🇦🇺 Bearish AUD Drivers:
Weak domestic data:
Building Approvals: -8.8% vs -1.7% forecast
RBA on hold:
No rate hike in sight; cautious due to housing and China concerns
China slow-down:
PBOC cut rates and reduced reserve requirements — signals broader economic softness
🇺🇸 Bullish USD Drivers:
Fed holding firm:
Benchmark rate held at 4.25–4.50%
Labor costs surged +5.3% q/q
Productivity dropped -0.4%, reinforcing inflation concerns
Market repricing rate cuts:
Cuts now expected later in 2025 or even 2026
Political pressure from Trump:
Despite attacks on Jerome Powell, Fed appears unmoved
Trump teasing a “major trade deal” — potentially USD-positive if credible
🎯 Trade Setup
Entry Area: Watching 0.6420–0.6435 as a pullback zone for potential shorts
Target Levels:
First target: 0.6379
Second target: 0.6350
Stop Loss: Placed above 0.6475 (last swing high) to protect against false breakouts
Trade Thesis:
Technical structure supports downside continuation
Macro fundamentals favor USD strength and AUD weakness
Clean reward-to-risk if structure holds
🧭 Conclusion
AUDUSD setup is supported by a strong confluence of technical breakdown and macro divergence. With the Fed staying firm and the RBA cautious amid weak data, the fundamentals validate the bearish trend. As long as price stays below 0.6475, the outlook remains bearish, with 0.6379 and 0.6350 as the next logical levels. Caution around U.S. data releases or trade deal news is advised, but the path of least resistance remains downward.

AUDUSD BEARISH(SELL) TECHNICAL SCENARIO.AUD/USD Market Analysis Scenario
Pair: AUD/USD
Bias: Bearish
Entry Consideration: Upon confirmation of rejection or reversal near the resistance zone.
Key Levels
Resistance: 0.64960 (critical supply zone)
1st Target: 0.64200
Final Target: 0.63800
Technical Scenario
The AUD/USD pair is currently trading below a strong resistance at 0.64960, which has acted as a key reversal zone in the recent past. Price action near this level indicates a potential bearish reversal pattern, such as a bearish engulfing, double top, or rejection wicks on higher time frames (H4 or D1).
If the pair fails to break above 0.64960, we can expect a downward movement toward the first support target at 0.64200, where minor demand might provide temporary consolidation. If bearish momentum continues, the pair could head further down to the final target at 0.63800, a previous swing low and stronger demand area.

AUDUSD BUY/LONGBy utilizing Fibonacci retracement levels, historical patterns, , we can formulate a hypothesis that the market might follow a similar trajectory if bullish sentiment prevails.
AUD/USD "The Aussie" Forex Bank Money Heist (Bullish)🌟Hi! Hola! Ola! Bonjour! Hallo! Marhaba!🌟
Dear Money Makers & Robbers, 🤑 💰💸✈️
Based on 🔥Thief Trading style technical and fundamental analysis🔥, here is our master plan to heist the AUD/USD "The Aussie" Forex Bank Heist. Please adhere to the strategy I've outlined in the chart, which emphasizes long entry. Our aim is to escape near the high-risk MA Line Zone. It's a Risky level, overbought market, consolidation, trend reversal, trap at the level where traders and bearish robbers are stronger. 🏆💸"Take profit and treat yourself, traders. You deserve it!💪🏆🎉
Entry 📈 : "The heist is on! Wait for the Crossing previous high (0.64900) then make your move - Bullish profits await!"
however I advise to Place Buy stop orders above the Moving average (or) Place buy limit orders within a 15 or 30 minute timeframe most recent or swing, low or high level for Pullback entries.
📌I strongly advise you to set an "alert (Alarm)" on your chart so you can see when the breakout entry occurs.
Stop Loss 🛑: "🔊 Yo, listen up! 🗣️ If you're lookin' to get in on a buy stop order, don't even think about settin' that stop loss till after the breakout 🚀. You feel me? Now, if you're smart, you'll place that stop loss where I told you to 📍, but if you're a rebel, you can put it wherever you like 🤪 - just don't say I didn't warn you ⚠️. You're playin' with fire 🔥, and it's your risk, not mine 👊."
📍 Thief SL placed at the nearest/swing low level Using the 4H timeframe (0.6400) Day trade basis.
📍 SL is based on your risk of the trade, lot size and how many multiple orders you have to take.
🏴☠️Target 🎯: 0.65800
🧲Scalpers, take note 👀 : only scalp on the Long side. If you have a lot of money, you can go straight away; if not, you can join swing traders and carry out the robbery plan. Use trailing SL to safeguard your money 💰.
💰💵💸AUD/USD "The Aussie" Forex Bank Money Heist is currently experiencing a bullishness,., driven by several key factors. .☝☝☝
📰🗞️Get & Read the Fundamental, Macro Economics, COT Report, Quantitative Analysis, Sentimental Outlook, Intermarket Analysis, Future trend targets with overall score... go ahead to check👉👉👉🔗🔗🌎🌏🗺
⚠️Trading Alert : News Releases and Position Management 📰🗞️🚫🚏
As a reminder, news releases can have a significant impact on market prices and volatility. To minimize potential losses and protect your running positions,
we recommend the following:
Avoid taking new trades during news releases
Use trailing stop-loss orders to protect your running positions and lock in profits
💖Supporting our robbery plan 💥Hit the Boost Button💥 will enable us to effortlessly make and steal money 💰💵. Boost the strength of our robbery team. Every day in this market make money with ease by using the Thief Trading Style.🏆💪🤝❤️🎉🚀
I'll see you soon with another heist plan, so stay tuned 🤑🐱👤🤗🤩

AUDUSD LONG FORECAST Q2 W19 D7 Y25AUDUSD LONG FORECAST Q2 W19 D7 Y25
Professional Risk Managers👋
Welcome back to another FRGNT chart update📈
Diving into some Forex setups using predominantly higher time frame order blocks alongside confirmation breaks of structure.
Let’s see what price action is telling us today!
💡Here are some trade confluences📝
✅Weekly 50 EMA
✅Intraday 15' order block
✅Tokyo ranges to be filled
✅Intraday bullish breaks of structure to be confirmed
🔑 Remember, to participate in trading comes always with a degree of risk, therefore as professional risk managers it remains vital that we stick to our risk management plan as well as our trading strategies.
📈The rest, we leave to the balance of probabilities.
💡Fail to plan. Plan to fail.
🏆It has always been that simple.
❤️Good luck with your trading journey, I shall see you at the very top.
🎯Trade consistent, FRGNT X

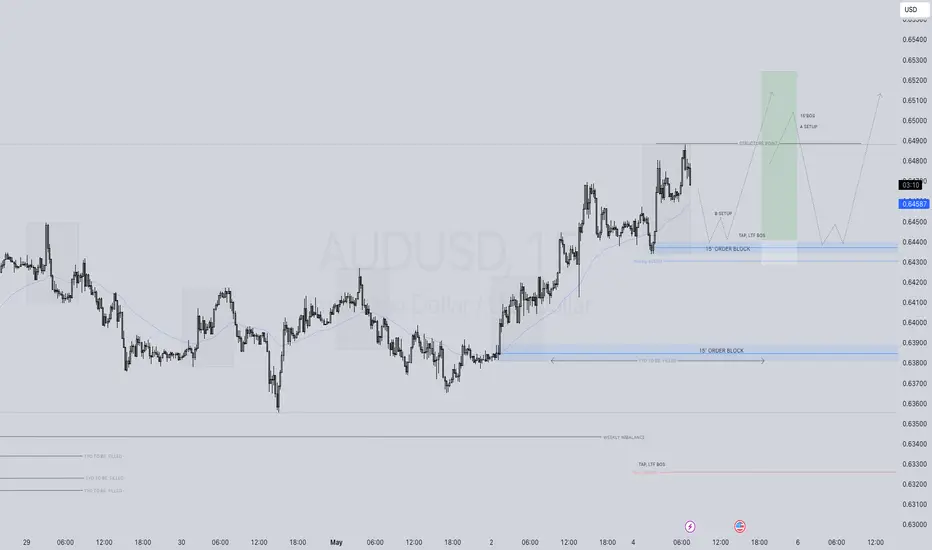
AUDUSD LONG FORECAST Q2 W19 D5 Y25
AUDUSD LONG FORECAST Q2 W19 D5 Y25
Professional Risk Managers👋
Welcome back to another FRGNT chart update📈
Diving into some Forex setups using predominantly higher time frame order blocks alongside confirmation breaks of structure.
Let’s see what price action is telling us today!
💡Here are some trade confluences📝
✅Weekly 50 EMA
✅Intraday 15' order block
✅Tokyo ranges to be filled
✅Intraday bullish breaks of structure to be confirmed
🔑 Remember, to participate in trading comes always with a degree of risk, therefore as professional risk managers it remains vital that we stick to our risk management plan as well as our trading strategies.
📈The rest, we leave to the balance of probabilities.
💡Fail to plan. Plan to fail.
🏆It has always been that simple.
❤️Good luck with your trading journey, I shall see you at the very top.
🎯Trade consistent, FRGNT X
Week of 5/4/25: AUDUSD AnalysisAfter a hellish week of consolidation, price has made its move higher (finally) and we're back to a trendy chart.
My analysis the beginning of the week shows 2 POIs that I am interested in for longs, and if it breaks the level that I pointed out bearish, I will look for shorts.
Thanks for tuning in!
Major News:
FOMC - Wed
Unemployment - Thurs

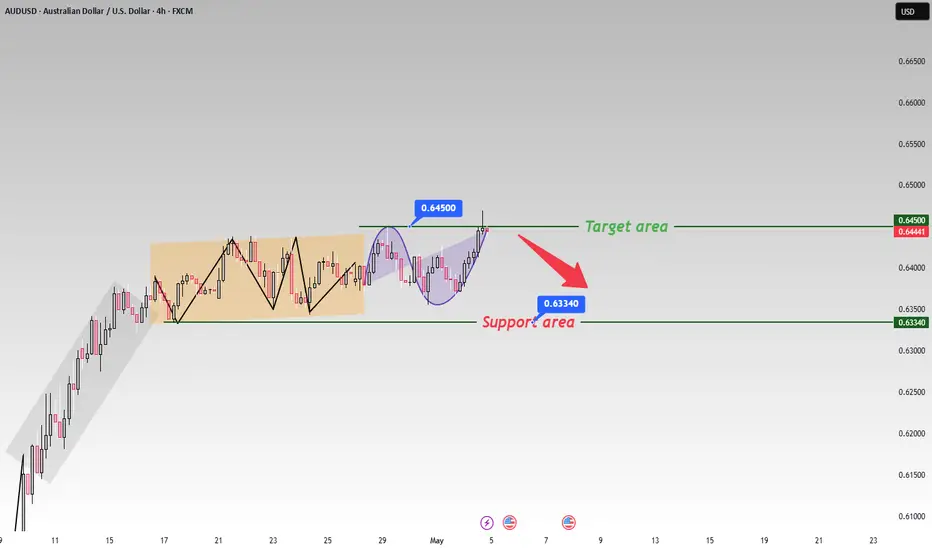
The trend next weekJudging from the price trend presented in the chart, the current market is clearly in a bearish state 📉. Previously, after the price reached the key resistance level of 0.64500, it failed to break through effectively and continue the upward trend. Instead, it entered a consolidation pattern 📊. This indicates that the bullish forces encountered strong resistance near this price level and found it difficult to push the price higher 👎.
It is expected that in the coming period, without significant positive news stimuli, the price is highly likely to continue its downward trend 📉. Investors should closely monitor whether the support level of 0.63340 holds 👀. If this support level is broken, they may consider selling short on rallies ⏬.
⚡⚡⚡ AUDUSD ⚡⚡⚡
🚀 Sell@0.6500 - 0.6450
🚀 TP 0.6350 - 0.6300
Accurate signals are updated every day 📈 If you encounter any problems during trading, these signals can serve as your reliable guide 🧭 Feel free to refer to them! I sincerely hope they'll be of great help to you 🌟
AUDUSD: Neutral View First Buy and Then Sell! Hey everyone!
Our first buy swing entry is going swimmingly! We’ve got over 500 pips running positively, and we reckon price can keep going up and then when it hits our selling zone, you can swing sell too. This is a fantastic opportunity where we can wait for price to do its thing and then when it reaches the sell zone, we can execute our order. But if you’re feeling adventurous and want to take a bit of a risk, you can take a buy entry at the given point and keep it up until it reaches our sell area.
With just one shot, we can make two entries!
Good luck and trade safely!
Thanks a bunch for your unwavering support! 😊
If you’d like to lend a hand, here are a few ways you can contribute:
- Like our ideas
- Comment on our ideas
- Share our ideas
Cheers,
Team Setupsfx_
❤️🚀

AUDUSD(20250502)Today's AnalysisToday's buying and selling boundaries:
0.6391
Support and resistance levels:
0.6452
0.6429
0.6414
0.6367
0.6352
0.6329
Trading strategy:
If the price breaks through 0.6391, consider buying, the first target price is 0.6414
If the price breaks through 0.6367, consider selling, the first target price is 0.6352

AUDUSD SHORT FORECAST Q2 W18 D2 Y25AUDUSD SHORT FORECAST Q2 W18 D2 Y25
Professional Risk Managers👋
Welcome back to another FRGNT chart update📈
Diving into some Forex setups using predominantly higher time frame order blocks alongside confirmation breaks of structure.
Let’s see what price action is telling us today!
💡Here are some trade confluences📝
✅Weekly 50 EMA
✅Intraday 15' order block
✅Tokyo ranges to be filled
✅Intraday 15' order block trading levels
🔑 Remember, to participate in trading comes always with a degree of risk, therefore as professional risk managers it remains vital that we stick to our risk management plan as well as our trading strategies.
📈The Xrest, we leave to the balance of probabilities.
💡Fail to plan. Plan to fail.
🏆It has always been that simple.
❤️Good luck with your trading journey, I shall see you at the very top.
🎯Trade consistent, FRGNT

AUDUSD SHORT FORECAST Q2 W18 D30 Y25AUDUSD SHORT FORECAST Q2 W18 D30 Y25
Professional Risk Managers👋
Welcome back to another FRGNT chart update📈
Diving into some Forex setups using predominantly higher time frame order blocks alongside confirmation breaks of structure.
Let’s see what price action is telling us today!
💡Here are some trade confluences📝
✅Weekly 50 EMA
✅Intraday 15' order block
✅Tokyo ranges to be filled
✅Intraday 15' order block trading levels
🔑 Remember, to participate in trading comes always with a degree of risk, therefore as professional risk managers it remains vital that we stick to our risk management plan as well as our trading strategies.
📈The Xrest, we leave to the balance of probabilities.
💡Fail to plan. Plan to fail.
🏆It has always been that simple.
❤️Good luck with your trading journey, I shall see you at the very top.
🎯Trade consistent, FRGNT

AUDUSD SHORT IDEAUnder current market conditions, the area near 0.6398 has been identified as a critical resistance zone, where the AI model detects a high-probability trade setup.
From a technical perspective, a clear directional bias based on recent price action patterns. Suppose the market demonstrates increased volume and price stability above key moving averages in the 0.6398 area. In that case, traders are advised to monitor for trend-continuation entry opportunities in alignment with the prevailing momentum.
Profit targets are defined at 0.6372 and 0.6344, corresponding to logical technical support zones. These levels are designed for staged profit-taking across different trade management styles. Stop-loss should be strictly enforced at the designated level; once breached, the strategy is considered invalidated in order to limit potential downside.
Market Analysis: AUD/USD Consolidates GainsMarket Analysis: AUD/USD Consolidates Gains
AUD/USD is consolidating gains near the 0.6420 zone.
Important Takeaways for AUD/USD Analysis Today
- The Aussie Dollar started a downside correction from 0.6450 against the US Dollar.
- There was a break above a key bearish trend line with resistance near 0.6400 on the hourly chart of AUD/USD at FXOpen.
AUD/USD Technical Analysis
On the hourly chart of AUD/USD at FXOpen, the pair started a fresh increase from the 0.6345 support. The Aussie Dollar was able to clear the 0.6375 resistance to move into a positive zone against the US Dollar.
There was also a move above the 0.6400 resistance and the 50-hour simple moving average. There was also a break above a key bearish trend line with resistance near 0.6400. Finally, the pair tested the 0.6450 zone. A high was formed near 0.6450 and the pair is now correcting gains.
There was a move below the 0.6420 level. The pair declined below the 23.6% Fib retracement level of the upward move from the 0.6367 swing low to the 0.6449 high.
On the downside, initial support is near the 0.6400 level. It is close to the 61.8% Fib retracement level of the upward move from the 0.6367 swing low to the 0.6449 high. The next major support is near the 0.6360 level.
If there is a downside break below the 0.6360 support, the pair could extend its decline toward the 0.6345 level. Any more losses might signal a move toward 0.6300.
On the upside, the AUD/USD chart indicates that the pair is now facing resistance near 0.6420. The first major resistance might be 0.6450. An upside break above the 0.6450 resistance might send the pair further higher.
The next major resistance is near the 0.6485 level. Any more gains could clear the path for a move toward the 0.6550 resistance zone.
This article represents the opinion of the Companies operating under the FXOpen brand only. It is not to be construed as an offer, solicitation, or recommendation with respect to products and services provided by the Companies operating under the FXOpen brand, nor is it to be considered financial advice.

AUDUSD SHORT FORECAST Q2 W18 D29 Y25AUDUSD SHORT FORECAST Q2 W18 D29 Y25
Professional Risk Managers👋
Welcome back to another FRGNT chart update📈
Diving into some Forex setups using predominantly higher time frame order blocks alongside confirmation breaks of structure.
Let’s see what price action is telling us today!
💡Here are some trade confluences📝
✅Weekly 50 EMA
✅Intraday 15' order block
✅Tokyo ranges to be filled
✅Intraday 15' order block trading levels
🔑 Remember, to participate in trading comes always with a degree of risk, therefore as professional risk managers it remains vital that we stick to our risk management plan as well as our trading strategies.
📈The rest, we leave to the balance of probabilities.
💡Fail to plan. Plan to fail.
🏆It has always been that simple.
❤️Good luck with your trading journey, I shall see you at the very top.
🎯Trade consistent, FRGNT X

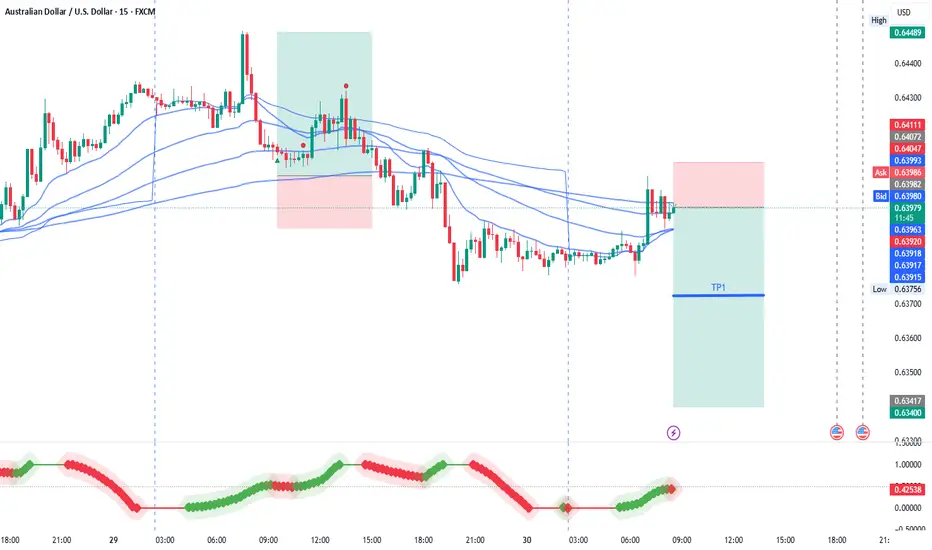
AUDUSD LONG SIGNALUnder current market conditions, the area near 0.6407 has been identified as a critical support zone, where the AI model detects a high-probability trade setup.
From a technical perspective, a clear directional bias based on recent price action patterns. Suppose the market demonstrates increased volume and price stability above key moving averages in the 0.6407 area. In that case, traders are advised to monitor for trend-continuation entry opportunities in alignment with the prevailing momentum.
Profit targets are defined at 0.6437 and 0.6489, corresponding to logical technical resistance zones. These levels are designed for staged profit-taking across different trade management styles. Stop-loss should be strictly enforced at the designated level; once breached, the strategy is considered invalidated in order to limit potential downside.
