Long on USD/AUDI am longing USD/AUD from 1.5750
Target 1 - 1.6050
Target 2 - 1.63
I believe we have completed an Elliot wave structure and expect to see upside from this location.
In addition, the stochastic RSI on the daily time frame is oversold.
Audusdforecast

AUD/USD is Bullish: More Gains AheadFenzoFx—The AUD/USD pair rebounded from the $0.6363 support level, aided by the 50-period simple moving average, and is currently trading near $0.6413.
Resistance stands at $0.6444. A close above this level may extend the bullish move toward $0.6940 and $0.7200.
Bearish Scenario : A drop below $0.6363 would invalidate the bullish outlook, potentially triggering a decline toward $0.6322.

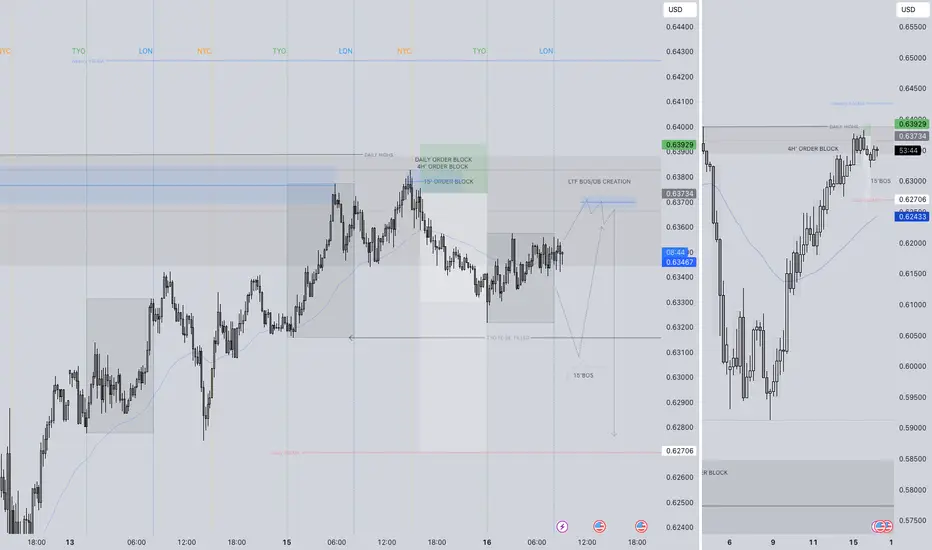
AUDUSD SHORT FORECAST Q2 W17 D23 Y25AUDUSD SHORT FORECAST Q2 W17 D23 Y25
Professional Risk Managers👋
Welcome back to another FRGNT chart update📈
Diving into some Forex setups using predominantly higher time frame order blocks alongside confirmation breaks of structure.
Let’s see what price action is telling us today!
💡Trade confluences
- Weekly 50 EMA rejection
- 5’ order block created
- Intraday bearish breaks of structure
- Tokyo ranges to be filled
🔑 Remember, to participate in trading comes always with a degree of risk, therefore as professional risk managers it remains vital that we stick to our risk management plan as well as our trading strategies.
📈The rest, we leave to the balance of probabilities.
💡Fail to plan. Plan to fail.
🏆It has always been that simple.
❤️Good luck with your trading journey, I shall see you at the very top.
🎯Trade consistent, FRGNT X

audusd sell signal. Don't forget about stop-loss.
Write in the comments all your questions and instruments analysis of which you want to see.
Friends, push the like button, write a comment, and share with your mates - that would be the best THANK YOU.
P.S. I personally will open entry if the price will show it according to my strategy.
Always make your analysis before a trade

AUDUSD SHORT FORECAST Q2 W17 D22 Y25AUDUSD SHORT FORECAST Q2 W17 D22 Y25
SUMMARY
- Weekly 50 exponential moving average
- Daily high rejection
Requirements
- 15' Break of structure short! Non negotiable.
- 15' order block creation to short from once price action pulls back.
🔑 Remember, to participate in trading comes always with a degree of risk, therefore as professional risk managers it remains vital that we stick to our risk management plan as well as our trading strategies.
📈The rest, we leave to the balance of probabilities.
💡Fail to plan. Plan to fail.
🏆It has always been that simple.
❤️Good luck with your trading journey, I shall see you at the very top.
🎯Trade consistent, FRGNT X

AUD/USD Secures Bullish Momentum Above $0.6407FenzoFx—AUD/USD closed above $0.6407 and remains stable, signaling a bullish trend supported by the 50-period simple moving average.
However, indicators like Stochastic and RSI 14 suggest an overbought condition, hinting at a possible correction. Key support lies at $0.6395, with traders watching for bullish signals such as candlestick patterns.
The outlook stays bullish above $0.6276, while dips below this level could trigger extended consolidation.
>>> No Deposit Bonus
>>> %100 Deposit Bonus
>>> Forex Analysis Contest
All at FenzoFx Decentralized Forex Broker

Week of 4/20/25: AUDUSD AnalysisWeekly and daily candles are consecutively bullish with a V-shape recovery to the upside. Looking for longs and especially keeping an eye out for the 1H POI flip-zone that I refined in the 4H POI.
Unless 1H internal structure shifts bearish, I am long ALL THE WAY!
Major News:
PMI - Wednesday
Unemployment - Thursday
Thanks for tuning in, have a great week.

AUDUSD(20250418)Today's AnalysisMarket news:
The European Central Bank cut interest rates by 25 basis points as expected, the seventh rate cut in the past year, and this decision was unanimous.
Technical analysis:
Today's buying and selling boundaries: 0.6369
Support and resistance levels:
0.6430
0.6407
0.6392
0.6346
0.6331
0.6309
Trading strategy:
If the price breaks through 0.6392, consider buying, the first target price is 0.6407
If the price breaks through 0.6369, consider selling, the first target price is 0.6346

AUDUSD SHORT FORECAST Q2 W18 D18 Y25AUDUSD SHORT FORECAST Q2 W18 D18 Y25
Fun Coupon Friday !
SUMMARY
- IMO, if this shorts, it's a slippy slide !
- Daily order block setup
- Daily highs confluence
- Weekly 50 Ema forecast to provide resistance for the short.
- Required to await 15' breaks of structure as price is bullish/ ranging at the moment .
- upon intra day breaks of structure, anticipating a creation of 15' order block to provide an area of interest to short from.
FRGNT X

AUD/USD) Resistance level pullback Short Read The ChaptianSMC Trading point update
analysis of the AUD/USD pair on the 2-hour timeframe, showing a possible bearish setup. Here's a breakdown of the idea behind it:
Key Observations:
1. Current Trend:
The pair was in an uptrend, as indicated by the rising channel (parallel trendlines). However, it has now broken out of that channel.
2. Resistance Level:
The price has reached a resistance zone around 0.64000, and it seems to be rejecting this level.
3. 2 Timeframe Demand Zone:
Around the 0.63300 – 0.63400 range, this area previously acted as a demand zone (support), and the chart suggests price might retest it.
4. Projected Move:
First, a pullback up into the resistance zone could occur.
Then a drop to the demand zone.
If the demand zone fails to hold, the price could head down toward the key support/FVG (Fair Value Gap) around 0.61000 – 0.61500.
5. EMA (200):
The 200 EMA is below the price, suggesting longer-term bullish pressure, but it's starting to flatten, which could signal weakness in the uptrend.
6. RSI Indicator:
RSI is around 52, showing neutral momentum—neither overbought nor oversold, allowing room for movement in either direction.
Mr SMC Trading point
---
Idea Summary:
The chart suggests a potential reversal from the uptrend into a downtrend, triggered by a failure to break above resistance. The two key targets for a bearish move are:
First: the 2TF demand zone
Final: the key support/FVG zone
Pales support boost 🚀 analysis follow)

AUDUSD SHORT FORECAST Q2 W16 D17 Y25AUDUSD SHORT FORECAST Q2 W16 D17 Y25
GM GM.
Summary
+ Daily high rejection
+ Weekly order block rejection
+ Weekly 50 EMA edging closer to price action
+ 4H bearish close
+ 1H continued short
+ 15' intraday breaks of structure
Just a few confluences mentioned.
Entry Model
Tap
Lower time frame break of structure/ Bearish candle stick formation from point of interest.
FRGNT X

AUDUSD SHORT FORECAST Q2 W16 D16 Y25AUDUSD SHORT FORECAST Q2 W16 D16 Y25
GM.
Here's a short forecast for AUDUSD short based of 4 hour order block.
awaiting short confirmation in turn around in price in turn creating a lower time frame order block to be used to short from.
Let's await price action!
FRGNT X
AUDUSD(20250416)Today's AnalysisMarket news:
U.S. import prices fell 0.1% in March from the previous month, the first month-on-month decline since September last year.
Technical analysis:
Today's buying and selling boundaries:
0.6346
Support and resistance levels:
0.6414
0.6388
0.6372
0.6320
0.6304
0.6278
Trading strategy:
If the price breaks through 0.6346, consider buying, the first target price is 0.6372
If the price breaks through 0.6320, consider selling, the first target price is 0.6304

AUDUSD Short Setup Based on DXY AnalysisHello traders!
After closely analyzing the Dollar Index (DXY), I've spotted a key development that has shaped my bearish bias on AUDUSD. The DXY recently broke below a higher timeframe low, rejecting strongly off the July 2023 low after sweeping liquidity on the Weekly chart. This kind of price action signals potential bullish momentum on the dollar in the coming days.
As a result, I’m anticipating weakness across major USD pairs, AUDUSD, EURUSD, GBPUSD, and NZDUSD included.
Here’s my trade setup for AUDUSD:
Entry: 0.63550
Target 1: 0.62748
Target 2: 0.62061
Target 3: 0.61506
Target 4: 0.60951
Stop Loss: 0.64020
I’m expecting a move to the downside if the resistance level at 0.6355 continues to hold, especially with DXY looking primed for further upside.
📈 This idea is based on a combination of liquidity grabs, higher timeframe structure, and DXY confluence, a powerful trio when it comes to swing setups.
If this analysis resonates with your view or adds value to your trading, a boost would be greatly appreciated! 🙌
Stay sharp and trade safe! 💰
DXY (Dollar Index) on Weekly Timeframe

AUD/USD is Overbought: Awaiting CorrectionFenzoFx—AUD/USD is in a strong bullish run, nearing the $0.6407 resistance. The Stochastic Oscillator signals overbought conditions, indicating the Australian dollar is overpriced in the short term.
While the trend remains bullish, consolidation may follow, with potential support at $0.6276.
>>> No Deposit Bonus
>>> %100 Deposit Bonus
>>> Forex Analysis Contest
All at F enzo F x Decentralized Forex Broker

Daily Chart Price Action: AUDUSD Monday 4/14/2025In this video, we are looking at Price Action movement on the Daily Chart. This includes forecasting of upward movement towards .63830 range.

AUDUSD SHORT FORECAST 4H ORDER BLOCK Q2 W16 D14 Y25
AUDUSD SHORT FORECAST 4H ORDER BLOCK Q2 W16 D14 Y25
Good morning Monday Traders!
FRGNT X

Market Analysis: AUD/USD Gains Pace, Bulls Are Back?Market Analysis: AUD/USD Gains Pace, Bulls Are Back?
AUD/USD started a decent increase above the 0.6150 and 0.6200 levels.
Important Takeaways for AUD USD Analysis Today
- The Aussie Dollar rebounded after forming a base above the 0.6000 level against the US Dollar.
- There is a connecting bullish trend line forming with support at 0.6260 on the hourly chart of AUD/USD at FXOpen.
AUD/USD Technical Analysis
On the hourly chart of AUD/USD at FXOpen, the pair started a fresh increase from the 0.5940 support. The Aussie Dollar was able to clear the 0.6065 resistance to move into a positive zone against the US Dollar.
There was a close above the 0.6200 resistance and the 50-hour simple moving average. Finally, the pair tested the 0.6315 zone. A high was formed near 0.6314 and the pair recently started a consolidation phase.
There was a move below the 0.6300 level. The pair remained above the 23.6% Fib retracement level of the upward move from the 0.5913 swing low to the 0.6314 high.
On the downside, initial support is near the 0.6260 level. There is also a connecting bullish trend line forming with support at 0.6260. The next major support is near the 0.6220 zone. If there is a downside break below the 0.6220 support, the pair could extend its decline toward the 0.6205 level.
Any more losses might signal a move toward 0.6065 and the 61.8% Fib retracement level of the upward move from the 0.5913 swing low to the 0.6314 high.
On the upside, the AUD/USD chart indicates that the pair is now facing resistance near 0.6315. The first major resistance might be 0.6340. An upside break above the 0.6340 resistance might send the pair further higher.
The next major resistance is near the 0.6385 level. Any more gains could clear the path for a move toward the 0.6450 resistance zone.
This article represents the opinion of the Companies operating under the FXOpen brand only. It is not to be construed as an offer, solicitation, or recommendation with respect to products and services provided by the Companies operating under the FXOpen brand, nor is it to be considered financial advice.

AUDUSD(20250414)Today's AnalysisMarket news:
Fed Collins: It is currently expected that the Fed will need to keep interest rates unchanged for a longer period of time. If necessary, the Fed is "absolutely" ready to help stabilize the market; Kashkari: No serious chaos has been seen yet, and the Fed should intervene cautiously only in truly urgent situations; Musallem: The Fed should be wary of continued inflation driven by tariffs.
Technical analysis:
Today's buying and selling boundaries:
0.6256
Support and resistance levels:
0.6374
0.6330
0.6301
0.6210
0.6182
0.6138
Trading strategy:
If the price breaks through 0.6301, consider buying, the first target price is 0.6330
If the price breaks through 0.6256, consider selling, the first target price is 0.6210

AUDUSD(20250411)Today's AnalysisMarket news:
The annual rate of the US CPI in March was 2.4%, a six-month low, lower than the market expectation of 2.6%. The market almost fully priced in the Fed's interest rate cut in June. Trump said inflation has fallen.
Technical analysis:
Today's buying and selling boundaries:
0.6195
Support and resistance levels:
0.6328
0.6278
0.6246
0.6144
0.6112
0.6062
Trading strategy:
If the price breaks through 0.6246, consider buying, the first target price is 0.6278
If the price breaks through 0.6195, consider selling, the first target price is 0.6144

AUDUSD SELL/ SHORTBy utilizing levels, historical patterns, , we can formulate a hypothesis that the market might follow a similar trajectory if bullish sentiment prevails.

AUDUSD(20250410)Today's AnalysisToday's buying and selling boundaries:
0.6079
Support and resistance levels:
0.6339
0.6242
0.6179
0.5980
0.5917
0.5820
Trading strategy:
If the price breaks through 0.6179, consider buying, the first target price is 0.6242
If the price breaks through 0.6079, consider selling, the first target price is 0.5980

AUD/USD Bearish Trade Setup – Trendline Rejection & SBR Zone📉 Trendline & Market Structure
🔵 Downward trendline connects lower highs (🔴🔴🔴), showing a bearish trend.
🔵 Price is forming lower highs and lower lows, confirming the downtrend.
🟦 SBR Zone (Support Became Resistance)
🔵 SBR Zone (🟦) was previously a support but now acts as resistance.
🔵 Price is testing this area → Possible rejection and move down.
📌 Trade Setup
✅ Entry: Short (Sell) near SBR zone if rejection occurs.
❌ Stop Loss: 0.60650 (🔺 Above SBR Zone)
🎯 Target Point: 0.59150 (🔻 Downside goal)
📉 Potential Drop: -2.08% (-125.4 pips)
📊 Confirmation Checklist
✔️ Price must reject 🟦 SBR Zone.
✔️ Bearish candles like Pin Bars or Engulfing confirm entry.
✔️ DEMA (9) at 0.60175 → If price drops below, trade is valid.
⚠️ Risk Management
🚀 Good Risk-to-Reward Ratio → Worth considering if rejection occurs.
🔄 Invalidation: If price breaks above 0.60650, setup is canceled.
