AUDUSD Top-down analysis Hello traders, this is a complete multiple timeframe analysis of this pair. We see could find significant trading opportunities as per analysis upon price action confirmation we may take this trade. Smash the like button if you find value in this analysis and drop a comment if you have any questions or let me know which pair to cover in my next analysis.
Audusdidea

AUDUSD Analysis H4Here is my analysis for AUDUSD on H4 using Order Block. The price could go bearish, you can put a pending order on the Order block or find an entry on LTF within OB Zone. Trade Safe!

AUDUSD: Great area to BUY BIG :)Dear Traders, hope you are doing great, we have an excellent opportunity to buy AUDUSD, like other USD PAIRS we still believe prices to be bullish.

BluetonaFX - AUDUSD Potential Head & Shoulders OpportunityHi Traders!
We have a potential Head and Shoulders opportunity on the AUDUSD 1H chart.
The price action is telling us that there is a bearish bias here; we have broken below both our 20 EMA and middle Band, and we are near the neckline of the pattern.
We are now looking for a break and a close below both the neckline and lower bollinger band to target 0.65271.
As long as we remain below the 20 EMA and middle band (we MUST stay below the 20 EMA and middle band), our bearish view will continue.
Please do not forget to like, comment, and follow, as your support greatly helps.
Thank you for your support.
BluetonaFX

AUDUSD Analysis 7Aug2023There was a slight change in the position of Elliot's notation compared to last week's analysis. If you see a pattern that resembles a bullish falling wedge, then the possibility of the current Wave correction is at the end of the period and will enter the beginning of the bullish again. This analysis of crows when the price drops more than the invalid area

A Short Trader May get happy today, on this AUD pair! {07/08/23}Educational Analysis says AUDUSD may go Short according to my technical.
This is not an entry signal. I have no concerns with your profit and loss from this analysis.
Why long?
Because AUDUSD respects an uptrend line facing down line on a 4-hour time frame.
The market is bearish but a strong AUD may change its direction and start a new trend soon.
The black line is the Order block
The RED line is high and low at the current price.
I HAVE NO CONCERNS WITH YOUR PROFIT OR LOSS,
Happy trading, FX Dollars.

AUDUSD Buy IdeaLiquidity Grab on H2 and Expansion Shows that there are Some Pending Orders and Internal Liquidity (FVG) There. Expecting a Bullish Move Resumption in Zone
if MSS happened on M15.
Look for MSS/Sweep Based CHoCH/Swing CHoCH as Confirmation.

AUDUSD long now Trade is active {31/07/2023}Trade is Active at
Long at - 0.66430
Stop loss at - 0.66210
Take profit at - 0.68800
I am linking this chart to the previous analysis for better understanding.
This chart is updated one of the last analysis i had done it.

AUDUSD Prediction H1Here is my analysis for AUDUSD on H1 using Order Block. The price could go bearish, you can put a pending order on the Order block or find an entry on LTF within OB Zone. Trade Safe!

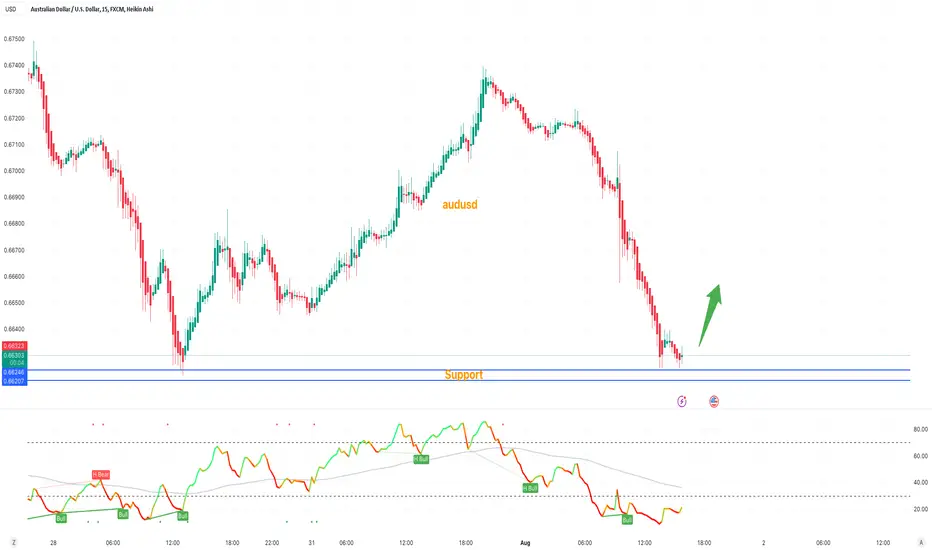
AUDUSD Trade PlanAUDUSD testing strong support area again, let's wait if support breaks or resist from the area.
Manage your risk according to account size!
AUDUSD - SHORT SETUP - SELLOnce the price is able to break through here; 0.68441, the next stop with some resistance to breakthrough is most likely 0.67899

AUDUSD - SHORT SETUP - SELL
The Stochastic Oscillator %K value is 84.92% and the %D value is 91.64%. Both values are above 80, indicating an overbought condition. This suggests that the price has reached a relatively high level and a pullback or reversal may be likely. The price is likely to retrace back to around .66300.
From the Daily time frame, it is evident that the price is nearing a significant supply area. This suggests the possibility of a downward correction. We should observe whether the market will present us with a suitable trading setup.
Please note that the information presented on TradingView is sourced from a third-party provider. It is important to remember that you are solely responsible for making trading decisions for your account. Trading involves a very high level of risk. Any information or content provided is strictly for research, educational, and informational purposes and should not be considered as investment advice, consultation advice, or an investment strategy. The information provided is not customized to meet the investment requirements of any specific individual, and it does not take into account the investment objectives, financial situation, or needs of any recipient who may access it. This is not financial advice and we are not responsible for your losses that may occur following our analysis!!!
If you find this analysis of AUD/USD helpful, please give me a boost, or like to show your support. My first public Idea post

AUDUSD Will Fall!AUD-USD is now trading
Below the supply cluster
Of rising and horizontal
Resistance levels so I am
Bearish biased and a
Move down is to be expected !

AUDUSD Analysis 30July2023If this analysis is true that currently forming Wave C, then the possibility after Wave C is perfectly formed, there will be a fairly high bullish. I prefer to look for opportunities to Long by waiting for some reversal signs that might be formed next week.

AUDUSD BullishOn Thursday, DXY was become stronger and put AUDUSD down, but If you look on the chart, we can see huge Bearish candle which is abnormal as compared to another candle. I believe AUDUSD may rise more. Every support is an opportunity to buy.

AUDUSD Analysis 24July2023If you see this, a double top can occur and the current price forms a bearish channel pattern. Added with Elliot Wave notation, the possibility that happens is in the A-B-C correction period. Find an opportunity for short when the price is corrected bullish approaching the trendline

AUDUSD Analysis H1Here is my analysis for AUDUSD on H1 using Order Block. The price could go bearish, you can put a pending order on the Order block or find an entry on LTF within OB Zone. Trade Safe!

BluetonaFX - AUDUSD Potential Double Top OpportunityHi Traders!
There is a potential double top pattern on the AUDUSD 1D chart as the 0.68999 resistance is still holding. There has been huge amounts of bullish momentum over the past few days, and there might be a possibility that bulls are now profit-taking and exiting their long positions, which will lead to a slowdown of momentum and a possible retracement of the bullish wave. The RSI indicator is also supporting this, as there is also a potential double top forming on the indicator.
We have a first target at 0.68182 and a second target at 0.67199, which is just above the range zone before the bullish breakout.
Please note that this is a risky setup; stops should be very tight as the bull momentum may continue if the double top fails and 0.68999 is broken.
Please do not forget to like, comment, and follow, as your support greatly helps us.
Thank you for your support.
BluetonaFX

AUDUSD Top-down analysisHello traders, this is a complete multiple timeframe analysis of this pair. We see could find significant trading opportunities as per analysis upon price action confirmation we may take this trade. Smash the like button if you find value in this analysis and drop a comment if you have any questions or let me know which pair to cover in my next analysis.

AUDUSD BUYHi, according to my analysis of the AUDUSD pair. There is a possibility of an uptrend with a retest of the price. Double button model. There is strong support in this area 0.65000. And this is just a corrective wave. to return to height. Good luck everyone .Note: If you like this analysis, please give your opinion on it. in the comments. I will be happy to share ideas. Like and click to get free content. Thank you

AUDUSD might pumping after correctionSeveral weeks ago I expect it will going down retrace to price 64¢ but it didn't, it was pumping from 65¢ and broke the strong resistance swing high at 68¢, after that correction to strong support at 66¢ before it pumping hard again to test that 69¢, but unfortunately not yet touched. Usually when the price doesn't touched particular strong round number (almost touch 1-3 pips), once again when it comes to that price, it will break the price like it was nothing (long bullish/bearish candle close above/below the strong price). Actualy I had sell limit at 69¢ several weeks ago but the price didn't take my sell order (missed less than 2 pips). Now the market structure is clear, bull domination. Usually price will spike to 60-70 pips before it going in favor (downward). I expect will correction to 67¢ for buy opportunity to test the new resistance at 69¢ (200 pips). It was consolidating 100 pips between 66¢ (minor support) and 67¢ (minor resistance) for 10 days before it pumping hard broke the 67¢ after USD high impact news released (CPI data) and this mean this (67¢) is strong demand on daily or weekly chart (spot the move without change to daily or weekly chart). I'll looking the price to build minor structure on smaller timeframe such as H1 before take consideration to sell for corrective moves.
What do you guys think?

AUDUSD Analysis 14July2023AUDUSD analysis is in accordance with the analysis a few days ago. the price finally bullish broke through the resistance area and now looks correction.
To determine the next target, we can draw fibo extensions from the beginning of wave 1 and the base of wave 2 to find the approximate length of wave 3.

AUDUSD:UPDATED CHART 10/07/2023❤️Dear Traders, hope everyone having an profitable week. Our last setup on AUDUSD showcased the possible future trend of the pair. Price came close to our area of entry.
In our opinion price already have completed the bearish move and the bulls have taken control over.
