Audusdidea

AUD/USD H&S pattern in Daily AUD/USD Head&Shoulder pattern in 4hr/Daily timeframe
AUD economic calendar release CPI MoM & QoQ expected bullish release
while in USD interest rate bears will be gathering.
Entry at vwap and s/l at high of the candle

AUDUSDThere are multipal confluences which hint us about continuation of the bearish trend. H&S was formed and broken, the previous support was broken, bounce from EMA 55 and forming consecutive lower lows and lower highs.


AUDUSD Further Downside PossibleAUDUSD has broken below key support turning it into resistance. Since this happens to be a daily head shoulders neckline also this gives me confidence in a further downwards cycle to be shown by AUDUSD .

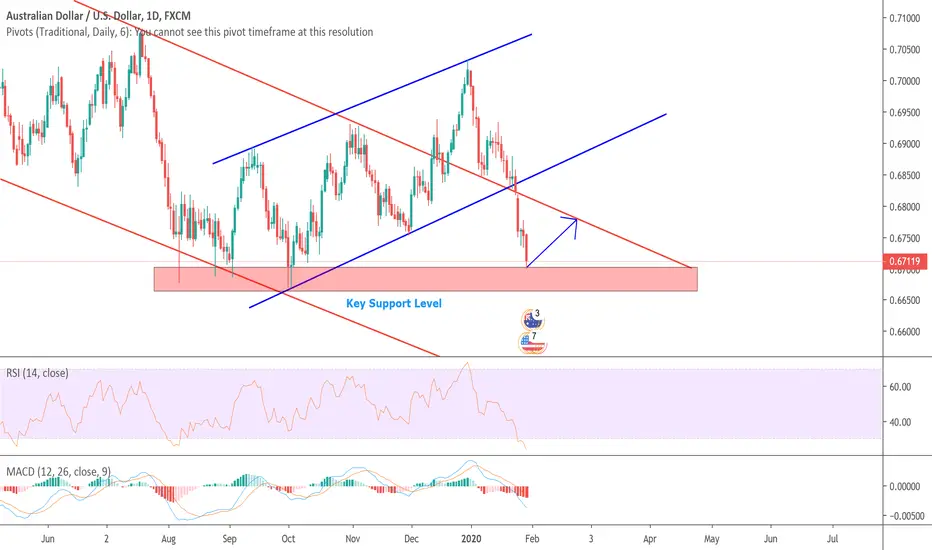
AUUSD - Buy once droppedANALYSIS ON AUDUSD
Welcome to my analysis
-
4HR CHart
-
Interesting Point of interest In the AUD/USD pair.
- Price below 200 day EMA.
- look for sell signals TO GREEN ZONE.
- possibility of 1 more move to the downside.
- Watch 0.68300 for Take Profit (TP) if going down, Also look for buy at this stage.
- MACD showing hidden bullish divergence
Long term i am expecting move to the upside. Will update soon
Stay Tuned

AUD/USD Potential Short Trade Idea - Institutional Order FlowIf we see a pullback, back into the yellow box when the new week opens, I will be most likely looking to short AUD/USD to take out the equal lows created that are marked up. This looks like a pretty solid setup, with it being on the daily chart.
**Education Purposed Only**
- Will

AUDUSD BUY FROM THE RETEST TO CONTINUE IT'S BULLISH RUNAUDUSD has made a retest on the larger time frame, this breakout simply provides a good opportunity to get in on the buy.

AUDUSD The Tiny Little LadderAUDUSD, how are thee ?
I see you are recovering, VERY VERY GOOD !
I hope you are well for the rest of year, I Really hope you are well for the rest of the year.
.
.
.
.
At this moment, i expect another upside from this pair.
Just one more push UP !
And then we can expect a downside, not for long i say....
But its only an IDEA if you will.
Me and my cup of tea, will wait for that very opportune moment to short this pair,
Hopefully i, myself, and me... Could find such setup around the price of 0.69560 - 0.70000
And we can Short this pair for a while. With a hint of hope that 2020 would grant you blessing my dearest AUDUSD.
.
.
.
.
Off i go, to the land of peesha and to the land of tea..........

AUDUSD surge aheadThis pair is ready to go upwards but this movement can be stopped because of Christmas and New Year celebrations. Show your support and hit the "like" button! Follow me for more educational charts.

AUDUSD H1 WAIT FOR BREAK OUTwe have down trend chart and triangle pattern
I wait for breaking support level 0.685
we have good risk/reward ratio 1:4
keep your eyes on this chart

AUDUSD idea My bias on this pair is long.
If im going to take a long position. I’d like for price to retrace to the 61.8 fib level giving Us a rejection confirming a 3rd touch on daily trend line/, 61.8 also lines up Nicely with daily resistance now turn support? If so that all could indicate bulls are still in control to get A push higher.
However if we break below structure and break trendline this trade becomes invalid.
(Price is at weekly trendline, wait for confirmation!)

#AUDUSD,Will this time be a breaking of the resistance?As you can see in the graph above, once again the AUD USD is approaching the 200 moving average line which is used as serious resistance, only this time compared to the previous times we have the beginning of a rising trend.
The Stochastic is already in the area that points to Overbought.
Our recommendation is to let AUDUSD touch the line (15/20 pips) and then sell with a short target of 0.6830

AUDUSD LONGHi Traders,
I think it's the beginning of a long uptrend.
You see the candlestick in the circle, that shows the end of the downtrend, and the beginning of an uptrend..
Good luck;
DON'T FORGET TO WAIT FOR BREAKING THE MOVING AVERAGE.
Make a lot of money with me;
Benjamin

AUDUSDWE ARE GOING LONG ON AUDUSD... A VERY STRONG UPTREND, A VERY STRONG BUY...
IF YOU CAN HOLD YOUR TRADE A WEEK AS A SWING TRADER, WE ARE TARGETING 100 - 130 pipS GUARANTEE
GIVE YOUR COMMENT
