AUDUSD Analysis H1Here is my analysis for AUDUSD on H1 using Order Block. The price could go bullish, you can put a pending order on the Order block or find an entry on LTF within OB Zone. Trade Safe!
Audusdlong

AUDUSD I Downside bias and short-term potential longWelcome back! Let me know your thoughts in the comments!
** AUDUSD Analysis - Listen to video!
We recommend that you keep this pair on your watchlist and enter when the entry criteria of your strategy is met.
Please support this idea with a LIKE and COMMENT if you find it useful and Click "Follow" on our profile if you'd like these trade ideas delivered straight to your email in the future.
Thanks for your continued support!

Buy AUDUSD?
I've been observing the AUD/USD chart , and it seems that the price might continue in an uptrend. We can notice multiple instances of the price breaking through the support/resistance zone, and after that, the price managed to surpass the trendline and perform a retest. I anticipate that the price will reach higher levels. This trade could potentially be of a longer duration. If it goes in our favor, consider taking partial profits.

AUDUSD Long Term BUYING Trading IdeaHello Traders
In This Chart AUDUSD HOURLY Forex Forecast By FOREX PLANET
today AUDUSD analysis 👆
🟢This Chart includes_ (AUDUSD market update)
🟢What is The Next Opportunity on AUDUSD Market
🟢how to Enter to the Valid Entry With Assurance Profit
This CHART is For Trader's that Want to Improve Their Technical Analysis Skills and Their Trading By Understanding How To Analyze The Market Using Multiple Timeframes and Understanding The Bigger Picture on the Charts

AUDUSD to continue in the upward move?AUDUSD - 24h expiry
Short term bias has turned positive.
Intraday dips continue to attract buyers and there is no clear indication that this sequence for trading is coming to an end.
20 4hour EMA is at 0.6462.
Bespoke support is located at 0.6460.
We look to buy dips.
We look to Buy at 0.6461 (stop at 0.6441)
Our profit targets will be 0.6511 and 0.6531
Resistance: 0.6508 / 0.6522 / 0.6540
Support: 0.6470 / 0.6450 / 0.6420
Risk Disclaimer
The trade ideas beyond this page are for informational purposes only and do not constitute investment advice or a solicitation to trade. This information is provided by Signal Centre, a third-party unaffiliated with OANDA, and is intended for general circulation only. OANDA does not guarantee the accuracy of this information and assumes no responsibilities for the information provided by the third party. The information does not take into account the specific investment objectives, financial situation, or particular needs of any particular person. You should take into account your specific investment objectives, financial situation, and particular needs before making a commitment to trade, including seeking advice from an independent financial adviser regarding the suitability of the investment, under a separate engagement, as you deem fit.
You accept that you assume all risks in independently viewing the contents and selecting a chosen strategy.
Where the research is distributed in Singapore to a person who is not an Accredited Investor, Expert Investor or an Institutional Investor, Oanda Asia Pacific Pte Ltd (“OAP“) accepts legal responsibility for the contents of the report to such persons only to the extent required by law. Singapore customers should contact OAP at 6579 8289 for matters arising from, or in connection with, the information/research distributed.

AUDUSD - LONG - BUYWhen assessing the potential for taking a long position on the AUD/USD pair, there are several factors to consider based on the provided Stochastic Oscillator readings.
The Stochastic Oscillator indicates that the pair is currently in an oversold condition (1H, 4H, 1D as of the time of this analysis) . Specifically, the %K line is at 12.95, and the %D line is at 18.1, both well below the 20 mark. This situation typically implies that the asset has been sold too aggressively and may experience a price bounce or reversal, which can present a bullish opportunity for traders.
Looking at the trend indicators, the Short-Term, Medium-Term, and Long-Term trends are all flagged as Bearish which means that the AUD/USD pair is in an downtrend across all these timeframes (1D)). However, the price is reaching major support and is more than likely to hold. This support combined with the oversold condition could potentially strengthen the case for entering a long position.
The current price will start to deviate from its average price, creating an opportunity for traders to potentially profit from a price correction toward the mean.
However, you must consider that Stochastic Oscillator is only one tool and should not be used in isolation. To better support your decision, it would be beneficial to also consider other indicators, patterns, economic data, and market news that could influence the AUD/USD pair.
Finally, always ensure that risk management measures are in place when considering any trade, as all trading involves risk. This is NOT FINANCIAL ADVICE!!! THERE WERE OTHER ANALYSIS USED IN ADDITION TO THE ONES MENTIONED ABOVE

AUD/USD Long IdeaThe AUDUSD downtrend channel was broken and now the price went to a consolidation area.
The 200 EMA being broken on 1H confirms the same thing.
The consolidation area has two touches on the support and two on the resistance.
I'm waiting for the consolidation area to be broken as the resistance of the consolidation area is a key area that has been support turned to resistance multiple times.
Once that area has been broken, I'm waiting for it to be retested as support and a strong bullish candle should signal a long entry.
TP target should be the next key area at around 0.66050.
SL should be a couple of pips underneath the consolidation's resistance area.

AUDUSD to find buyers at previous resistance?AUDUSD - 24H expiry
Short term bias has turned positive.
Previous resistance at 0.6435 now becomes support.
We look to buy dips.
The overnight dip has been bought into and there is scope for further bullish pressure going into this morning.
50 4hour EMA is at 0.6442.
We look to Buy at 0.6438 (stop at 0.6418)
Our profit targets will be 0.6488 and 0.6498
Resistance: 0.6488 / 0.6500 / 0.6520
Support: 0.6450 / 0.6435 / 0.6400
Risk Disclaimer
The trade ideas beyond this page are for informational purposes only and do not constitute investment advice or a solicitation to trade. This information is provided by Signal Centre, a third-party unaffiliated with OANDA, and is intended for general circulation only. OANDA does not guarantee the accuracy of this information and assumes no responsibilities for the information provided by the third party. The information does not take into account the specific investment objectives, financial situation, or particular needs of any particular person. You should take into account your specific investment objectives, financial situation, and particular needs before making a commitment to trade, including seeking advice from an independent financial adviser regarding the suitability of the investment, under a separate engagement, as you deem fit.
You accept that you assume all risks in independently viewing the contents and selecting a chosen strategy.
Where the research is distributed in Singapore to a person who is not an Accredited Investor, Expert Investor or an Institutional Investor, Oanda Asia Pacific Pte Ltd (“OAP“) accepts legal responsibility for the contents of the report to such persons only to the extent required by law. Singapore customers should contact OAP at 6579 8289 for matters arising from, or in connection with, the information/research distributed.

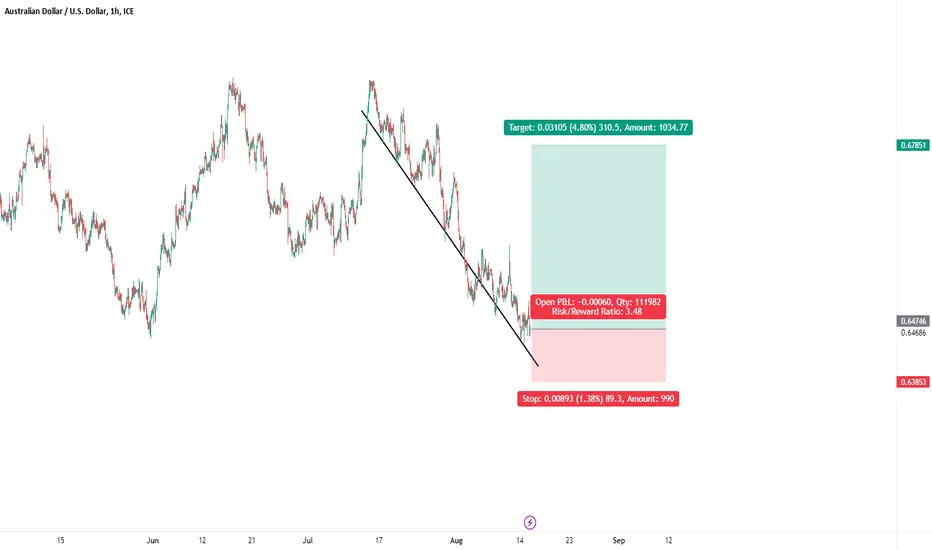
If AUD/USD is going to bounce, it has to be nowConditions for a weaker US dollar have been ripe, with calls for the RBA’s rate to have peaked at 4.1%, deteriorating data from China and ‘higher for longer’ calls for the Fed. And with that, we have seen some outlandish calls for the Aussie to fall to 50 and even 40c.
Perhaps those calls will turn out to be right. But the Aussie did not earn its name “the battler” for nothing, and we’ve not seen it dip below 50c in over twenty years. Furthermore, there are some indications that the downside could be limited and it could be due a bounce.
Last week’s nine-week low briefly traded beneath trend support, projected from the March 2020 low. Given it marked the pandemic low ahead of a bullish ‘liquidity injection’ fuelled rally, it is significant to say the least. But we also saw the RSI (2) reach overbought last week to warn of a near-term inflection point, and it fell for five consecutive weeks into those lows – a bearish sequence rarely beaten.
Of course, we have the Jackson Hole symposium with Jerome Powell’s speech being the usual highlight. If it is to peddle the ‘higher for longer narrative’, perhaps the US dollar can regain its footing and send AUD/USD back towards 64c. But even then, it ‘the battler’ may not simply roll over and die. But what if Powell is to deliver a less-hawkish-than-expected speech, following the weaker PMIs? Then we’ve expect some more Aussie bears to get squeezed, and help AUD/USD rebound further from that key trendline.

Audusd BuyAnalyzing AUD/USD: Anticipating Potential Buy or Sell Signal Tomorrow, with a Neutral Outlook for the Following 2 Days.

Buy AUDUSDLooking at the AUD/USD chart, we can notice that the price has made a new high. Right at that high, we witnessed a downward price reaction. The price gathered liquidity from the lowest peak and broke through the support back upwards. In my opinion, this suggests that we might see a continuation of the price rise to 0.64884 .

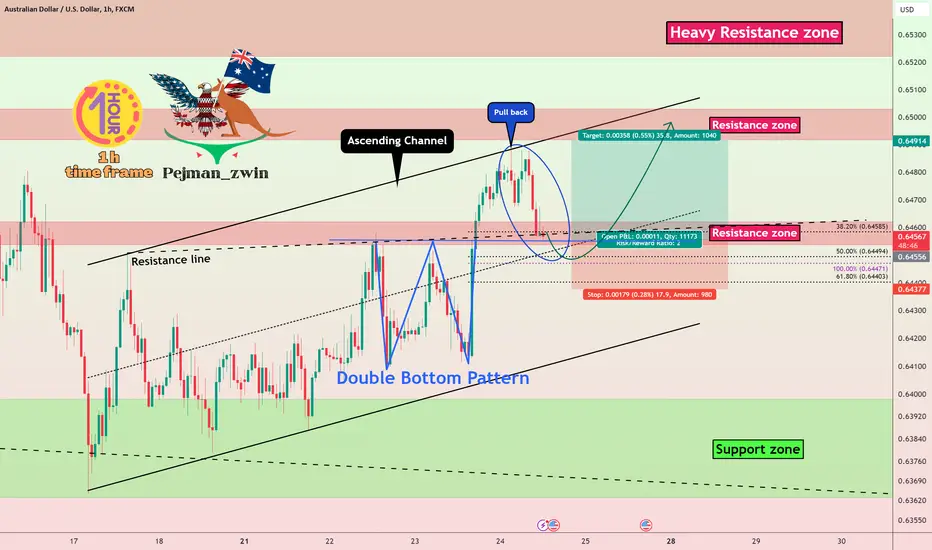
AUDUSD will go UP by Double Bottom Pattern🚀AUDUSD was able to break the 🔴 resistance zone($0.64620-$0.64530) 🔴.
Now, we are watching the pull back to the resistance zone .
Also, we can find the Double Bottom Pattern(Standard) .
🔔I expect AUDUSD will go UP at least to the upper line of the Ascending Channel and next 🔴 resistance zone($0.65030-$0.64920) 🔴.
🔅Australian Dollar/U.S.Dollar Analyze ( AUDUSD ) 1-hour time frame⏰.
Do not forget to put Stop loss for your positions (For every position you want to open).
Please follow your strategy; this is my idea, and I will be glad to see your ideas in this post.
Please do not forget the ✅ ' like ' ✅ button 🙏😊 & Share it with your friends; thanks, and Trade safe.
audusd buy Don't forget about stop-loss.
Write in the comments all your questions and instruments analysis of which you want to see.
Friends, push the like button, write a comment, and share with your mates - that would be the best THANK YOU.
P.S. I personally will open entry if the price will show it according to my strategy.
Always make your analysis before a trade

AUDUSD Long Term Trading IdeaHello Traders
In This Chart AUDUSD HOURLY Forex Forecast By FOREX PLANET
today AUDUSD analysis 👆
🟢This Chart includes_ (AUDUSD market update)
🟢What is The Next Opportunity on AUDUSD Market
🟢how to Enter to the Valid Entry With Assurance Profit
This CHART is For Trader's that Want to Improve Their Technical Analysis Skills and Their Trading By Understanding How To Analyze The Market Using Multiple Timeframes and Understanding The Bigger Picture on the Charts

audusd signal buy. Don't forget about stop-loss.
Write in the comments all your questions and instruments analysis of which you want to see.
Friends, push the like button, write a comment, and share with your mates - that would be the best THANK YOU.
P.S. I personally will open entry if the price will show it according to my strategy.
Always make your analysis before a trade

DREAMS FOREX | AUDUSDHello Traders..
First buy 90 pips profit and then sell with 100 pips profit..
Use good trade management only thing important in Trading is how you manage your trade...
Enjoy...

AUDUSD: Great area to BUY BIG :)Dear Traders, hope you are doing great, we have an excellent opportunity to buy AUDUSD, like other USD PAIRS we still believe prices to be bullish.

AUDUSD BUY STOP AUDUSD BUY STOP
Entry point :- 0.65730
Stop lose :- 0.64953
Target 1 :- 0.6651
Target 2 :- 0.6728
Target 3 :- 0.6806
Target 4 :- 0.6884
Target 5 :- 0.6961

AUDUSD Possible LongAUDUSD might be on it's way up after very long downtrend. As of now price is trapped inside a falling wedge.

audusd buy analysisi elliot. Don't forget about stop-loss.
Write in the comments all your questions and instruments analysis of which you want to see.
Friends, push the like button, write a comment, and share with your mates - that would be the best THANK YOU.
P.S. I personally will open entry if the price will show it according to my strategy.
Always make your analysis before a trade

AUDUSD Signal 7Aug2023I have noticed a correction in the H1 timeframe. The most recent HH was unable to reach the SND area, resulting in a FTR (Failed to Return) and a subsequent drop in corrected prices. For this AUDUSD analysis, we can set up a buy limit in the SND area with a ratio of RR reaching 1:6. It is important to use a good MM.

audusd buy. Don't forget about stop-loss.
Write in the comments all your questions and instruments analysis of which you want to see.
Friends, push the like button, write a comment, and share with your mates - that would be the best THANK YOU.
P.S. I personally will open entry if the price will show it according to my strategy.
Always make your analysis before a trade
