AUDUSD Updates
Looks pretty clear here.
COngrats to thos who follow this pair.
Thank you for new followers.
We keep learning everyday, lets goo..
Audusdlong

AUDUSD - Daily Trade Idea - 13-Jan-23AUDUSD (LONG)- If all the support holds in place.
If we see the Support broken out then we could see the shift in the trend.
I marked the TP 1 (20 pips), TP 2 (50 pips) , TP 3 (100 pips) and EXIT (SL - 60 pips) on the chart.
(THIS IDEAS VALID NEXT 24 HOURS)
Please note this is only the Trade Idea base on S & R and not a signal, the market can react differently during the session due to News Impact and only enter if we have the final confirmation for entry.
- Rejection Candle Formation - Green Candle after the Red Candle.
- Stochastic - Oversold Area
- Timing of entry Prior / during UK / US Market Session.

AUDUSD LONG TRADE BASED ON MY STRATEGY AND RULE1. Am not trading against the 4hrs time am following the trend on the lower timeframe ENTRY OFF______
2. My levels/zones are marked correctly so I know were price can
reverse from before taking profit/entry.
3. Waited for candle to close on the_________ before entering this trade
4. This trade is not off a 4hrs Bullish/Bearish (OVERBOUGHT/OVERSOLD) candle
5. There is no News in the next 1hr during the time this trade was
taken
6. Am risking 2% /1% of my account this trade______
7. Am reacting am not predicting

AUDUSD - Long from bullish orderblock ✅Hello traders!
‼️ This is my analysis of AUDUSD .
Here we are bullish from H4 timeframe perspective, so I am looking for longs. I expect price to make a retracement to fill the imbalance lower and then to reject from bullish orderblock.
Like, comment and subscribe to be in touch with my content!

AW Aussie Dollar Analysis - The Big One Could Be Starting Now...It's looking more and more like the small weak 5-Wave move down for Wave E has completed.
I believe once we see a break of the last minor high at .69502, the Aussie Dollar will explode higher.
Check out the Dow Jones long trade video below if you haven't which is another sign of an incoming bull market.
These moves will be limited with targets and they will be significant but nothing compared to what comes afterwards.
Remember to use Disciplined Money Management Principles to ensure longevity as a trader.
If you don't know the long term pattern shouldn't you be doing your research instead of just following the crowd?
Just remember: I am not a financial adviser; I suggest using this only as a guide. Always do your own research.

AudUsd could rise above 0.7As I said 2 days ago, AudUsd is consolidating in a range and there is a high chance of a break above resistance.
On Monday the pair indeed has broken above this horizontal level and yesterday corrected and confirmed this level as support.
The structure is very constructive and up continuation is probable.
The technical target for the next leg up is 0.7150, with a close eye from bulls at 0.7 psychological level.
I remain bullish as long as support holds

AUDUSD, Correction after Breakout to take price higher.AUDUSD had a strong breakout of reversal structure which we can expect further growth in the next coming days. I will wait to see if we get a correction to confirm a buy entry.
Thanks
Trade Safe


AUDUSD M30: Bearish outlook seen, further downside below 0.6910On the M30 time frame, prices are showing bearish order flow with lower highs and lower lows being formed. A pullback to the resistance zone at 0.6910, in line with the graphical resistance zone and 38.2% Fibonacci retracement could present an opportunity to play the drop to the support zone at 0.6850. Stochastic is testing resistance and seeing a bearish divergence as well, where we could see further downside in prices.

AudUsd- Next stop to 0.7150?Since the beginning of December, AudUsd has traded in a range between 0.67 and 0.69.
Now the pair looks ready for an up break and the target for this leg up is 0.7150 resistance.
I'm bullish AudUsd as long as 0.67 is intact and traders should look for buying dips in search for a good R:R

AUD/USD :: price increase .AUD/USD :::
The middle line of the channel defines the trend well. In general, the channel is ascending and the price is moving towards the middle line of the channel.
The 0.7 range can be the next destination.
<<< Good luck >>>

AUDUSD - Daily Trade Idea - 9-Jan-23AUDUSD (LONG)- If all the support holds in place.
If we see the Support broken out then we could see the shift in the trend.
I marked the TP 1 (20 pips), TP 2 (50 pips) , TP 3 (100 pips) and EXIT (SL - 60 pips) on the chart.
(THIS IDEAS VALID NEXT 24 HOURS)
Please note this is only the Trade Idea base on S & R and not a signal, the market can react differently during the session due to News Impact and only enter if we have the final confirmation for entry.
- Rejection Candle Formation - Green Candle after the Red Candle.
- Stochastic - Oversold Area
- Timing of entry Prior / during UK / US Market Session.

AUDUSDAccording to the counting of Elliott waves, we can expect the price to go up to complete wave C

AW Aussie Dollar Analysis - Why? Because I can...This video is just a shit talk video about why I like the current state of things...
Does anyone actually care? Well, I certainly don't lol
Well actually I do I was just checking on you.
Comment or subscribe, make a big deal out of it. Whether you care or not. Let it be heard!
Remember to use Disciplined Money Management Principles to ensure longevity as a trader.
If you don't know the long term pattern shouldn't you be doing your research instead of just following the crowd?
Just remember: I am not a financial adviser; I suggest using this only as a guide. Always do your own research.

AUD LONG TRADE BASED ON MY STRATEGY AND RULE1. Am not trading against the 4hrs time am following the trend on the lower timeframe ENTRY OFF_____1HRS_
2. My levels/zones are marked correctly so I know were price can
reverse from before taking profit/entry.
3. Waited for candle to close on the______4HRS___ before entering this trade
4. Am not taking a full 4hrs Bullish/Bearish (OVERBOUGHT/OVERSOLD) candle
5. There is no News in the next 1hr during the time this trade was
taken
6. Am risking 2% /1% of my account this trade__2%____

AUD USD LONG TRADE BASED ON MY STRATEGY AND RULE1. Am not trading against the 4hrs time am following the trend on the lower timeframe ENTRY OFF______
2. My levels/zones are marked correctly so I know were price can
reverse from before taking profit/entry.
3. Waited for candle to close on the___4h______ before entering this trade
4. Am not taking a full 4hrs Bullish/Bearish (OVERBOUGHT/OVERSOLD) candle
5. There is no News in the next 1hr during the time this trade was
taken
6. Am risking 2% /1% of my account this trade______

Looking at AUDUSD LongOB Strat, AUDUSD cam down short this morning, now inside a Bullish OB on 4h chart, now down to 15m to look at the entry point. Awaiting US session + for price action to show 2 breaks of structure to the upside before entering.

AUD/USD LongCurrently we are dealing with a messy pair. In the beginning when i started to share my ideas , i was bullish on this pair which I had a loss , then i decided to short where it hit the entry level leaving me stalemate.
Now completing a SHS pattern, i think it will go upside even-though is a risky trade .
My targets are :
Third : 0.6926
Second: 0.69
First: 0.68730

AUDUSD top-down analysisHello traders, this is a complete multiple timeframe analysis of this pair. We see could find significant trading opportunities as per analysis upon price action confirmation we may take this trade. Smash the like button if you find value in this analysis and drop a comment if you have any questions or let me know which pair to cover in my next analysis.

$AUD - 2023 🐂$AUD - 2023 🐂
Happy New Year! May this year ahead of yours be full of trading opportunities and most importantly great health.
$AUDUSD - C&H (Cup & Handle pattern) If this carries on playing out we have great zones we can take opportunities on. Watch out for 2023 I am bearish the dollar and bullish all commodity FX pairs! However, don't forget about your trading plan and most important implement your risk management skills. It's going to be a very volatile year with CB's divergences and various other factors, but again with great volatility gives us traders opportunities! Fear not.
Key tip: Get a good R/R.
Have a great year ahead.
All the best,
Trade Journal
Disclaimer: Not Investment Advice

AUD USD LONG TRADE BASED ON MY STRATEGY AND RULE1. Am not trading against the 4hrs time am following the trend on the lower timeframe ENTRY OFF___1hr___
2. My levels/zones are marked correctly so I know were price can
reverse from before taking profit/entry.
3. Waited for candle to close on the____4hr_____ before entering this trade
4. Am not taking a full 4hrs Bullish/Bearish (OVERBOUGHT/OVERSOLD) candle
5. There is no News in the next 1hr during the time this trade was
taken
6. Am risking 2% /1% of my account this trade____2%__
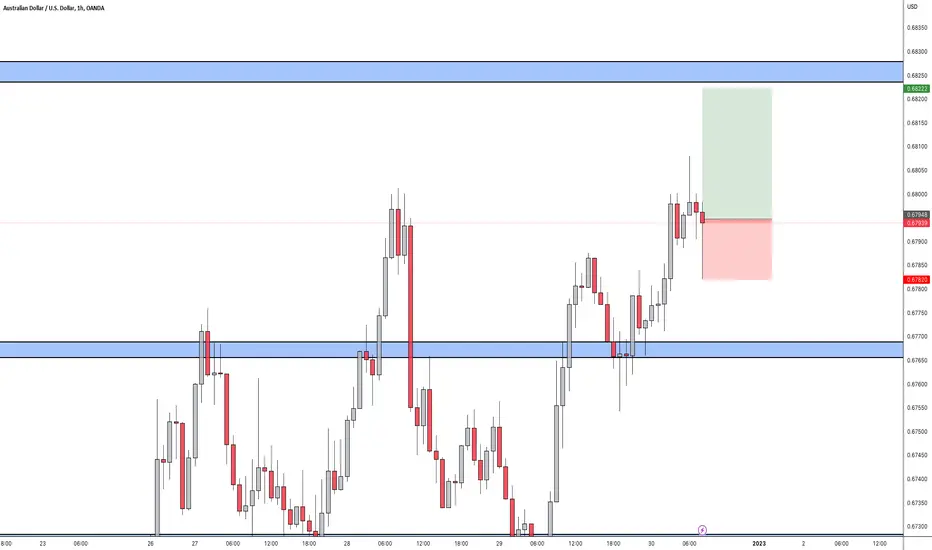
AUDUSD | Push Up ExpectedHi fellow risk-takers,
I hope the year has been good in terms of growth both equity-wise and mindset-wise, and are super excited and ready for 2023.
My last post of 2022 features AUDUSD in which I have a long position opened already. Expectations is for the pair to heads up a bit in a 90-pip move.
Good luck for next year and trade well.

AW Aussie Dollar Analysis - Contrarian Bull Market Chart...This chart highlights what is happening at the small degree for the bull view.
I can see the first few waves of what should result in a break above the magenta dotted line for confirmation at around .69 cents.
This wouldn't be the first time I have observed such patterns.
During the 2020\2021 EURUSD at the beginning of on the bull run I noticed a very similar pattern occur right before it went higher.
It is definitely an interesting time, but I will not be quick to assume everything else will rise although certain markets may.
The bond yields and interest rates may experience a temporary correction, but the past rate rises may still be having its effects on some markets.
There could however be something similar occur that resembles the 2020\2021 period (after March 2020) all over again.
For the full AUDUSD video breakdown see below.
Remember to use Disciplined Money Management Principles to ensure longevity as a trader.
If you don't know the long term pattern shouldn't you be doing your research instead of just following the crowd?
Just remember: I am not a financial adviser; I suggest using this only as a guide. Always do your own research.
