AUDUSD - Expect filling the imbalance ✅Hello traders!
‼️ This is my analysis on AUDUSD.
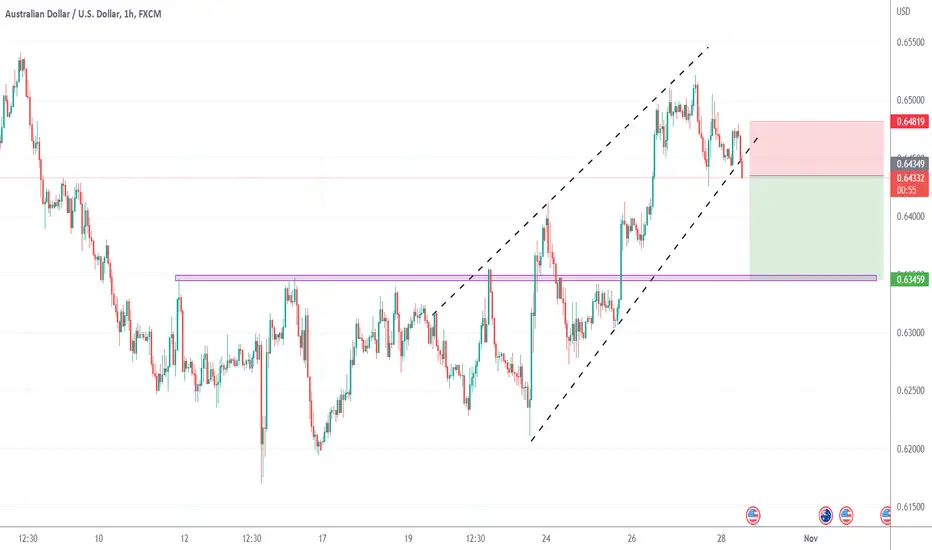
Here we are bullish from H4 timeframe perspective, so I am looking for longs. I expect price to continue the retracement to fill the imbalance below and then to continue bullish price action.
Like, comment and subscribe to be in touch with my content!
Audusdlong

AUDUSD BUY LONGAUD/USD (Australian Dollar - US Dollar) is one of the most frequently-traded currency pairs in the world. The AUD/USD rate, as shown in the real-time price chart, tells traders how many US Dollars are needed to buy a single Australian Dollar. Follow the AUD/USD live with the interactive chart and read the latest forecast and AUD/USD news to boost your technical and fundamental analysis when trading this pair.

Buying AUDUSD close to market.AUDUSD - 13h expiry - We look to Buy at 0.6400 (stop at 0.6355)
Previous support located at 0.6368.
Buying pressure from 0.6377 resulted in prices rejecting the dip.
Further upside is expected although we prefer to buy into dips close to the 0.6400 level.
Although the anticipated move higher is corrective, it does offer ample risk/reward today.
Our profit targets will be 0.6530 and 0.6650
Resistance: 0.6650 / 0.6770 / 0.6910
Support: 0.6400 / 0.6170 / 0.5945
Disclaimer – Saxo Bank Group.
Please be reminded – you alone are responsible for your trading – both gains and losses. There is a very high degree of risk involved in trading. The technical analysis , like any and all indicators, strategies, columns, articles and other features accessible on/though this site (including those from Signal Centre) are for informational purposes only and should not be construed as investment advice by you. Such technical analysis are believed to be obtained from sources believed to be reliable, but not warrant their respective completeness or accuracy, or warrant any results from the use of the information. Your use of the technical analysis , as would also your use of any and all mentioned indicators, strategies, columns, articles and all other features, is entirely at your own risk and it is your sole responsibility to evaluate the accuracy, completeness and usefulness (including suitability) of the information. You should assess the risk of any trade with your financial adviser and make your own independent decision(s) regarding any tradable products which may be the subject matter of the technical analysis or any of the said indicators, strategies, columns, articles and all other features.
Please also be reminded that if despite the above, any of the said technical analysis (or any of the said indicators, strategies, columns, articles and other features accessible on/through this site) is found to be advisory or a recommendation; and not merely informational in nature, the same is in any event provided with the intention of being for general circulation and availability only. As such it is not intended to and does not form part of any offer or recommendation directed at you specifically, or have any regard to the investment objectives, financial situation or needs of yourself or any other specific person. Before committing to a trade or investment therefore, please seek advice from a financial or other professional adviser regarding the suitability of the product for you and (where available) read the relevant product offer/description documents, including the risk disclosures. If you do not wish to seek such financial advice, please still exercise your mind and consider carefully whether the product is suitable for you because you alone remain responsible for your trading – both gains and losses.


AUDUSD 3 options for entry ,waiting for CHoCH on 1-15m tf and open long or short, follow the risk management and don't forget to put stop loss

AUDUSD buy Took this AUDUSD buy with a generous SL. Risking a smaller amount on this trade since the RR isnt the best, + US news release is coming up and I will manage my trade accordingly. AUD isnt performing that great across the board, which is another reason this is trade im risking lesser than I normally would on. Lets see how it plays out.
Took some great trades during London and some losses as well. Will share shortly!

AudUsd LongI am currently going long on AudUsd as it has broken the previous trendline & retested the previous resistance,which is now support. I will look for short opportunities once it bounces off the next trend line or if it breaks the last marked support.
Should it fail to bounce off the top trendline and instead breaks it, I will be looking for long continuations.

AUDUSD inverted head and shoulders AUDUSD has just displayed a inverted head and shoulders and we will be looking for buys on a 4hr timeframe

AUDUSD | New perspectiveThe U.S. dollar appears to be handing back some of its gains as buying traction was predominant during the course of last week's trading session.
It is also worth noting here that the Dollar Index, which tracks the Greenback against a basket of major currencies fell by 0.1% to suggest the possibility of a retracement in the nearest future. Will the breakout of the $0.66300 turn out to be bullish for the new week?
Risk Disclaimer:
Margin trading in the foreign exchange market (including commodity trading, CFDs, stocks etc.) has a high risk and is not suitable for all investors. The content of this speculation (including all data) is organized and published by me for the sole purpose of education and assistance in making independent investment decisions. All information herein is for your reference only and I take no responsibility.
You are hereby advised to carefully consider your investment experience, financial situation, investment objective, risk tolerance level, and consult your independent financial adviser as to the suitability of your situation prior to making any investment.
I do not guarantee its accuracy and is not liable for any loss or damage which may result directly or indirectly from such content or the receipt of any instruction or notification therewith.
Past performance is not necessarily indicative of future results.

AUDUSD H1: Bullish outlook seen, further upside above 0.6390On the H1 time frame, prices are testing the support zone at 0.6390, in line with the Fibonacci confluence levels where we could see further upside to the resistance zone at 0.6480. The 0.6480 resistance zone coincides with the graphical resistance and 78.6% Fibonacci retracement. Stochastic is bouncing off the support at 8.24 support as well and seeing a bullish divergence as highlighted in green, supporting the bullish bias.

AUDUSDAfter the european inflation rate, which scored the highest in its history, the bank of Australia's so-called rate starts tomorrow according to charts and fundamentals, the Australian currency shows the goal of rising.

AUDUSD2 options for entry ,waiting for CHoCH on 1-15m tf and open long, follow the risk management and don't forget to put stop loss

Buy AUDUSDbeautiful zone break & retest
BUY AUDUSD Now @Market
SL: 50 pips
TP: 200 pips
Money management really important!
@mdrtrader

AUDUSD Long Bias - ICT ConceptHey traders, here is the analysis for the AUDUSD. If you guys like my analysis please hit like👍 and follow. Thanks. DISCLAIMER:- This is not financial advice.

AUDUSD long two options for entry ,waiting for CHoCH on 1-5m tf and open long , follow the risk management and don't forget to put stop loss

AUDUSD SELL LONGThe Australian Dollar and the US Dollar pair belong the Majors, a group of the most popular traded pairs in the world. This pair's popularity soared because traders were attracted to the interest rate differential of the pair. This has waned in recent years due to economic volatility worldwide.
AUDUSD Short BiasHey traders, here is the analysis for the AUDUSD. If you guys like my analysis please hit like👍 and follow. Thanks. DISCLAIMER:- This is not financial advice.

Bullish outlook on AUDUSD: 27 October 2022On the H4 time frame, prices are approaching the support zone at 0.64000 which coincides with the 38.2% Fibonacci retracement where a pullback to this zone could present an opportunity to play the bounce to the next resistance zone at 0.67200, in line with the graphical resistance level and 61.8% Fibonacci retracement. Prices are holding above the 30 EMA as well, supporting the bullish bias.

AUDUSD Chart H4Here is my view for AUDUSD on H4. The price could go up, you can put a pending order on the Order block or find an entry on LTF within OB Zone. Trade Safe!

AUDUSD - Daily Trade Idea - 27-Oct-22AUDUSD (LONG)- If all the support holds in place.
If we see the Support broken out then we could see the shift in the trend.
I marked the TP 1 (20 pips), TP 2 (50 pips) , TP 3 (100 pips) and EXIT (SL - 60 pips) on the chart.
(THIS IDEAS VALID NEXT 24 HOURS)
Please note this is only the Trade Idea base on S & R and not a signal, the market can react differently during the session due to News Impact and only enter if we have the final confirmation for entry.
- Rejection Candle Formation - Green Candle after the Red Candle.
- Stochastic - Oversold Area
- Timing of entry Prior / during UK / US Market Session.

AUDUSD : Elliot Price Action 1Hr Aussie Dollar AnalysisRBA appears less hawkish after shock 25 bps hike in OctoberDiverging pace of future rate hikes may leave AUD susceptible to the downside into year endAUD/NZD, AUD/USD price action setups analyzedRBA Appears Less Hawkish after Shock 25 Bps Hike in OctoberThe RBA shocked markets on the 4th of October when it decided to hike the target cash rate by a mere 25 basis points after 4 consecutive clips of 50 bps prior, citing sizeable frontloading.But in the one-hour chart of this currency, we see an ABC correction wave, and now we are on the path of wave c and the third and fifth wave of this correction, and we continue to expect this currency to fall again.

AUDUSD - New expansion expected ✅Hello traders!
‼️ This is my analysis on US30 .
Here we are still in the bearish market structure, so I am looking only for shorts. I expect price to continue the retracement as imbalance wasn't fill fully and then to reject from bearish orderblock + institutional big figure 0.65000.
Like, comment and subscribe to be in touch with my content!

AUDUSD 1d - 4h Bear trend , but every movement has a correction, 4 options for entry ,waiting for CHoCH and open short , follow the risk management and don't forget to put stop loss
