AUD/USD Made Inverted Head And Shoulders,But Still Not ConfirmedThis Is An Educational + Analytic Content That Will Teach Why And How To Enter A Trade
Make Sure You Watch The Price Action Closely In Each Analysis As This Is A Very Important Part Of Our Method
Disclaimer : This Analysis Can Change At Anytime Without Notice And It Is Only For The Purpose Of Assisting Traders To Make Independent Investments Decisions.
Audusdlong

AUDUSD M30: Bullish outlook seen, further upside above 0.6260On the H1 time frame, prices are approaching the support zone at 0.6260 which coincides with the 61.8% Fibonacci retracement level. A throwback to this 0.6260 support zone presents an opportunity to play the bounce to the next resistance zone at 0.63600. This resistance zone is also a graphical resistance zone in line with the Fibonacci confluence levels. Prices are holding above the Ichimoku cloud as well, supporting the bullish bias.

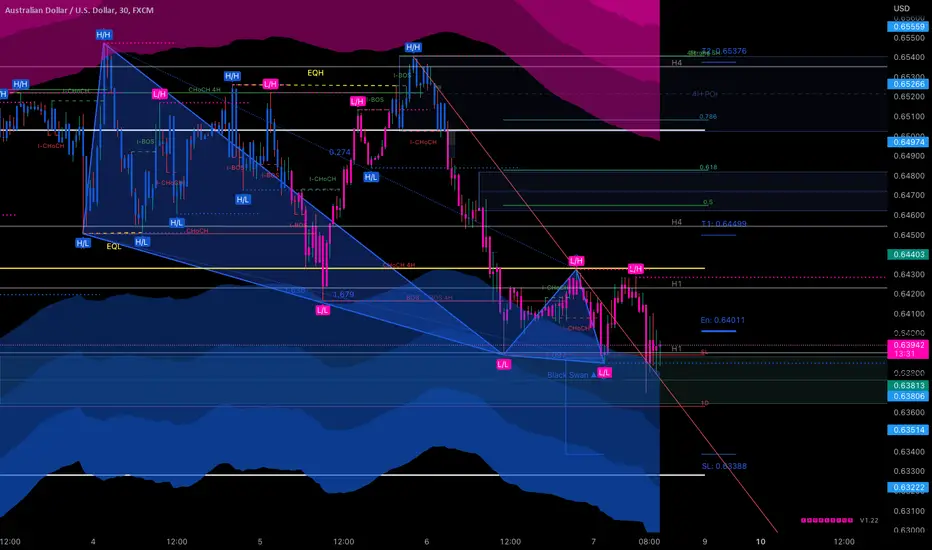
AUDUSD AKA AUSSIEnice change of character here also in a 4hr sell zone push below this level bears in control a safer entry would be waiting for another higher low

AUDUSD - Daily Trade Idea - 18-Oct-22AUDUSD (LONG)- If all the support holds in place.
If we see the Support broken out then we could see the shift in the trend.
I marked the TP 1 (20 pips), TP 2 (50 pips) , TP 3 (100 pips) and EXIT (SL - 60 pips) on the chart.
(THIS IDEAS VALID NEXT 24 HOURS)
Please note this is only the Trade Idea base on S & R and not a signal, the market can react differently during the session due to News Impact and only enter if we have the final confirmation for entry.
- Rejection Candle Formation - Green Candle after the Red Candle.
- Stochastic - Oversold Area
- Timing of entry Prior / during UK / US Market Session.

AUDUSD Wyckoff Ccumulation # 1 and forming Bat Pattern on 4H TfAUDUSD Wyckoff Ccumulation Schematic # 1 Found on 4 Hour timeframe
same time Timeframe
AUDUSD is forming BAT Pattern (harmonic) ..4 hr timeframe
Not a financial advice just for learning Purpose
like follow for my profile support thanks

AUD/USD likely to move Up!Hey tradomaniacs,
well... market is crazy so be cautious with all trades as market doesnt really know what to price in.
So far the previous CPI data were first shocking but voerall showing the we could have seen the peek which is good for stocks & Co.
Nontheless there is still much to look at so I dont expect clear risk-on or risk-off the next weeks.
Technically we see a fakeout, breakout and now a nice retracement to go long.
What do you think?

AUDUSD - Daily Trade Idea - 14-Oct-22AUDUSD (LONG)- If all the support holds in place.
If we see the Support broken out then we could see the shift in the trend.
I marked the TP 1 (20 pips), TP 2 (50 pips) , TP 3 (100 pips) and EXIT (SL - 60 pips) on the chart.
(THIS IDEAS VALID NEXT 24 HOURS)
Please note this is only the Trade Idea base on S & R and not a signal, the market can react differently during the session due to News Impact and only enter if we have the final confirmation for entry.
- Rejection Candle Formation - Green Candle after the Red Candle.
- Stochastic - Oversold Area
- Timing of entry Prior / during UK / US Market Session.

AUDUSD M30: Bullish outlook seen, limited upside above 0.62650On the M30 time frame, prices are approaching the support zone at 0.62650 which coincides with the Fibonacci confluence levels. A throwback to this 0.62650 support zone presents an opportunity to play the bounce to the next resistance zone at 0.63300. This resistance zone is also a graphical resistance zone in line with the 100% Fibonacci extension. Prices are holding above the 50 EMA as well, supporting the bullish bias.

Expectation on AUDUSDSince there was rejection sign on price zone 0.6250, the price likely to change trend from bearish to bullish, expected to jump until previous current high at 0.63303.

AUDUSD This my own view on AUDUSD, earlier price has done its first extension from 0.6248 to 0.6343. and dropped back down
our major area of support here is 0.6248 and price is currently trading above it, if this continues i will be looking for Buying opportunities at this region back up to 0.6343
then on getting to the resistance which is 0.6343 the reaction there will determine if the trend will continue upwards to 0.6430
the last scenario here is if the current support fails to hold expect further drop downwards

Where Too Start Buying AUDUSD ??We are quickly approaching key areas on the AUDUSD with a huge Monthly DEMAND/BUY zone that was created in 2020 after the flash crash at the start of this zone we also have a untested Weekly DEMAND/BUY zone starting around 0.616 this is where i will look to start buying this pair.
I will wait for my indicator to give a BUY signal on daily charts as we enter this price area and target the previous MONTHLY support around 0.662 this will be a first easy target for buyers and will also be an area that could attract large sellers to come back into the markets to push lower into the 2020 Monthly DEMAND/BUY.
The intial stop loss will be under the weekly DEMAND/BUY zone its a tight weekly level that if the signal occurs good risk/reward.

AUDUSD AKA AUSSIEif this bullish ob level hold we can see a nice push up atleast 40-50 pips short term then when it gets to that bearish ob ill see what it does but this level is holding nicely looking like nice buy setups short term
AUDUSD AUDUSD is currently at a support zone, but if u look close i have to price tags there, this simply means price has a high probability of breaking 0.6390 and going down to the lower support which is at 0.6364.
if price continue to trade above 0.6364 then i will be looking for buying opportunities at the point to the upside, targeting 0.6510 as my first target.
if price gets to 0.6542 and breaks it, then i will continue to hold till thee second target 0.6650
am generally looking out for 200pips to 270pips from this trade set up and you will be risking very little for a huge reward
36pips stoploss

AUDUSD Will it Raise?This is for short term
And this is risky too.
Please DYOR before entering the trade.

AUSTRALIAN DOLLAR / U.S. DOLLARThe Australian Dollar and the US Dollar pair belong the Majors, a group of the most popular traded pairs in the world. This pair's popularity soared because traders were attracted to the interest rate differential of the pair. This has waned in recent years due to economic volatility worldwide.
AUDUSD - Daily Trade Idea - 5-Oct-22AUDUSD (LONG)- If all the support holds in place.
If we see the Support broken out then we could see the shift in the trend.
I marked the TP 1, TP 2 , TP 3 and EXIT (SL) on the chart.
(THIS IDEAS VALID NEXT 24 HOURS)
Please note this is only the Trade Idea base on S & R and not a signal, the market can react differently during the session and only enter if we have the final confirmation for entry.

AUD/USD Full Analysis ,Best Places To Buy This Pair For New TripThis Is An Educational + Analytic Content That Will Teach Why And How To Enter A Trade
Make Sure You Watch The Price Action Closely In Each Analysis As This Is A Very Important Part Of Our Method
Disclaimer : This Analysis Can Change At Anytime Without Notice And It Is Only For The Purpose Of Assisting Traders To Make Independent Investments Decisions.

Tue 4th October 2022 AUD/USD Daily Forex Chart Buy SetupGood morning fellow traders. On my Daily Forex charts using the High Probability & Divergence trading methods from my books, I have identified a new trade setup this morning. As usual, you can read my notes on the chart for my thoughts on this setup. The trade being a AUD/USD Buy. Enjoy the day all. Cheers. Jim

AUDUSD - Daily Trade Idea - 4-Oct-22AUDUSD (LONG)- If all the support holds in place.
If we see the Support broken out then we could see the shift in the trend.
I marked the TP 1, TP 2 , TP 3 and EXIT (SL) on the chart.
(THIS IDEAS VALID NEXT 24 HOURS)
Please note this is only the Trade Idea base on S & R and not a signal, the market can react differently during the session and only enter if we have the final confirmation for entry.

AUD/USD BUYRBA hike Interest Rates by 50bp - Shark Tank aim October 90/10 Long - 300m @ 0.66 - Set Pending Orders above Structure

AUDUSD - Daily Trade Idea - 29-Sep-22AUDUSD (LONG)- If all the support holds in place.
If we see the Support broken out then we could see the shift in the trend.
I marked the TP 1, TP 2 , TP 3 and EXIT (SL) on the chart.
(THIS IDEAS VALID NEXT 24 HOURS)
Please note this is only the Trade Idea base on S & R and not a signal, the market can react differently during the session and only enter if we have the final confirmation for entry.

AUDUSD finsh its downward trendThe Aussie should have ended its downtrend with yesterday's low and now headed towards 0.8854. However, there is a possibility that the downward movement will resume after a major correction. However, this would just be my second option.

AUDUSD - Long OpportunityGood evening traders! (Well, it's evening here in the UK),
The market opens soon, and I've been looking into this pair for a potential long opportunity.
Not the most confirmation- a fairly risky trade. But I'm still going to take the punt with low risk, entering with a tight SL and risking 1%.
The reason for entry has been explained in the chart using annotations- I hope this is clear for everyone!
We'll see how this works out.
Thanks for taking the time to read!
- SilencedTrader
*Disclaimer*
I am not a financial advisor. This post is strictly for educational purposes only. Trading involves substantial risk of loss and is not suitable for every investor. Protect your capital at all costs.
Enter anything I post at your own risk and discretion.
