AUDUSD - Look for a short !!Hello traders!
‼️ This is my perspective on AUDUSD.
Technical analysis: Here we are in a bearish market structure from 4H timeframe perspective, so I look for a short. As we can see price took buy side liquidity and now it's in bearish OB, I expect to see BOS on lower timeframe to open the trade.
Fundamental news: Upcoming week on Tuesday (GMT+2) we will see results of Cash Rate on AUD and on Thursday (GMT+2) we have Unemployment Rate. News with high impact on currency.
Like, comment and subscribe to be in touch with my content!
Audusdlong

#AUDUSD 1DAYAUDUSD (4H Timeframe) Analysis
Market Structure:
The price has been in a downtrend but has now broken above the downtrend resistance, signaling a potential shift in market direction. A breakout from this level suggests that buyers are gaining strength, possibly leading to further bullish movement.
Forecast:
A buy opportunity may arise as the breakout indicates a change in trend. Waiting for a retest of the breakout level for confirmation can provide a stronger entry point.
Key Levels to Watch:
- Entry Zone: A buy position can be considered after a successful breakout and retest of the previous resistance as support.
- Risk Management:
- Stop Loss: Placed below the breakout level to minimize risk.
- Take Profit: Target key resistance zones where price may face selling pressure.
Market Sentiment:
The breakout of the downtrend resistance suggests that bullish momentum is increasing. A confirmed retest with strong price action can provide better confirmation for an upward move.

AUDUSD Bullish AUD/USD has successfully broken a strong resistance level, signaling bullish momentum. After the breakout, we may see a retracement to the previous resistance area, which could now act as support before the next leg up. If buyers continue stepping in, further upside movement is expected.
🔹 Key Levels to Watch:
✅ Support: Retesting the previous resistance zone
✅ Bullish Confirmation: Holding above support could fuel further upside
Always follow proper risk management and wait for confirmation before entering trades

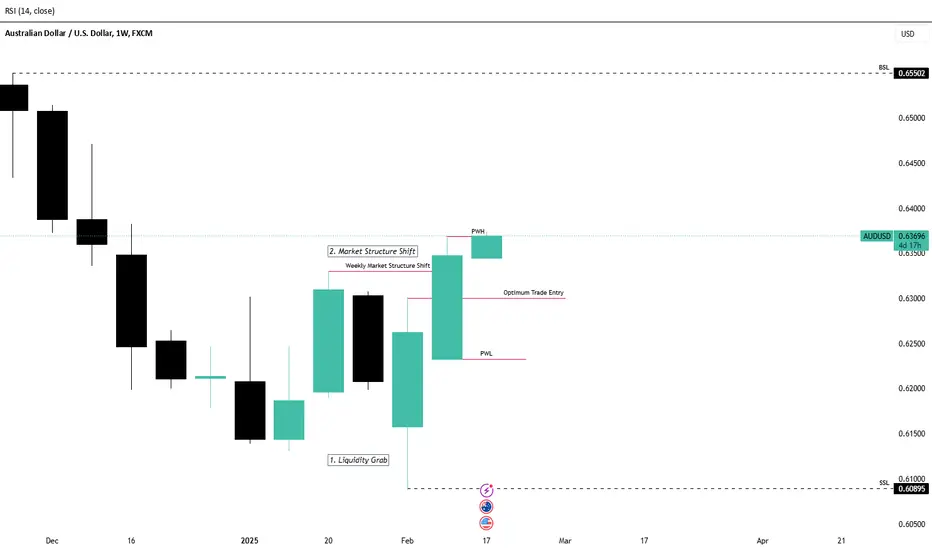
AUDUSD Weekly BiasThis pair is now on a bullish run considering that;
1. We had a liquidity grab at 0.61 Zone.
2. Market Structure Shift at 0.633.
The pair might aim towards the Buyside Liquidity at 0.655 and our entry positions might be around the 0.63 Zone.
Ghost's AUD/USD Setup [LONG/SHORT]I believe at the moment shorts and longs are valid, shorts on the short-term, longs for the long-term no pun intended.
We have an equal low created leaving behind internal liquidity I am expecting to be swept before price can continue higher, 0.617 to me seems to be a strong & critical area of price for the current environment and as such, could be tapped before price continues to .65+.
RBA interest rate decision is around the corner & COT positioning is indicating profit take so be careful gang.
As it stands right now GTFX is on a 22 win streak, almost 300 pips acquired for 2025 already and a lot more to come.

AUDUSD: Another 300+ Pips In Making, Use Proper Risk Management AUDUSD price has broken through the bearish inducement and currently on the way to make another high. Strong bullish presence is likely to pressure the price to create another high. Use accurate risk management.

Scenario on AUDUSD 13.2.2025I would see AUDUSD like this, if it were to be a short, then the first place I would be willing to enter is the sfp above the high around poc 0.63378 long positions are the first acceptable until the sfp around the support at the level of 0.616-0.613 and then only after the building sfp

Audusd long I am long with tight stop loss of 4 pip and a 30 pips take profit target a very good risk to reward

AUDUSD LONG: ISM SERVICES PMI ON TAPUS January ISM services 52.8 vs 54.3 expected. This indicates a slowdown in the US service sector. The service sector in the United States includes many industries that provide services to consumers, such as financial services, education, healthcare, entertainment, technology, construction, and housekeeping. As a result, we expect the dollar to become weaker than the Australian dollar.

Potential Diamond Bottom Pattern on AUD/USDFollowing a 12% plunge since topping out at US$0.6942 at the beginning of October 2024 – with pullbacks few and far between – the AUD/USD (Australian dollar versus the US dollar) is pencilling in what appears to be a diamond bottom pattern around US$0.6150ish (made up of a broadening formation and a possible symmetrical triangle).
What’s technically interesting from the daily chart is that the diamond bottom is forming from monthly support coming in at US$0.6094. Following at least two tests of the symmetrical triangle outer edges on each side, should this pattern complete – price breakout to the upside – strong moves higher could be prompted once established.

AUDUSD - Weekly forecast, Technical Analysis & Trading IdeasMidterm forecast:
0.63475 is a major resistance, while this level is not broken, the Midterm wave will be downtrend.
Technical analysis:
A peak is formed in daily chart at 0.63295 on 01/24/2025, so more losses minimum to Trend Hunter Buy Zone (0.61710 to 0.61000) is expected.
Take Profits:
0.62874
0.63475
0.64388
0.65385
0.66210
0.66846
0.67965
0.69410
0.71541
__________________________________________
❤️ If you find this helpful and want more FREE forecasts in TradingView,
. . . . . Please show your support back,
. . . . . . . . Hit the 👍 BOOST button,
. . . . . . . . . . . Drop some feedback below in the comment!
🙏 Your Support is appreciated!
Let us know how you see this opportunity and forecast.
Have a successful week,
ForecastCity Support Team

Audusdclean traffic ,right now were at historic lows ,expecting a nice push from here ,looking at previous highs and using them as guide for targets..

Ghost's AUD/USD LTF Setup [LONG]Trump is signing executive orders in 3 hours, price has been very choppy today and looks at face value like it's about to mirror the move down back up, however, the risk of trump mentioning or doing anything with Tariffs is high and for that reason I think it's possible the liquidity below around .621 may get manipulated before the move up.

AUD/USD "The Aussie" Forex Market Bullish Heist Plan🌟Hi! Hola! Ola! Bonjour! Hallo!🌟
Dear Money Makers & Robbers, 🤑 💰
Based on 🔥Thief Trading style technical and fundamental analysis🔥, here is our master plan to heist the AUD/USD "The Aussie" Forex market. Please adhere to the strategy I've outlined in the chart, which emphasizes long entry. Our aim is the high-risk Red Zone. Risky level, overbought market, consolidation, trend reversal, trap at the level where traders and bearish robbers are stronger. Be wealthy and safe trade.💪🏆🎉⭐
Entry 📈 : Traders & Thieves with New Entry A Bull trade can be initiated at any price level.
however I advise placing sell limit orders within a 15 or 30 minute timeframe. Entry from the most recent or closest high level should be in retest.
Stop Loss 🛑: Using the 4H period, the recent / nearest low or high level.
Goal 🎯: 0.64700 (or) Escape Before the Target
Scalpers, take note 👀 : only scalp on the Long side. If you have a lot of money, you can go straight away; if not, you can join swing traders and carry out the robbery plan. Use trailing SL to safeguard your money 💰.
📰🗞️Fundamental, Macro, Sentimental Outlook
The AUD/USD (The Aussie vs U.S Dollar) market is expected to move in a bullish direction, driven by several key factors.
🟤Improving Australian Economic Data
- Employment Data: Australia's employment data has been strong, with the unemployment rate decreasing to 3.5%.
- GDP Growth: Australia's GDP growth rate has been steady, with a 2.2% annual growth rate.
- Inflation Rate: Australia's inflation rate has been within the Reserve Bank of Australia's (RBA) target range, which could lead to a rate hike.
🟣Rising Commodity Prices
- Iron Ore Prices: Iron ore prices have been rising due to strong demand from China and supply disruptions.
- Coal Prices: Coal prices have been increasing due to strong demand from Asia and supply constraints.
- Gold Prices: Gold prices have been rising due to safe-haven demand and central bank buying.
🟢Weakening US Dollar
- US Dollar Index: The US Dollar Index (DXY) has been weakening due to a decline in US bond yields and a decrease in US economic growth expectations.
- Federal Reserve Policy: The Federal Reserve has been dovish, with a pause in rate hikes, which could weaken the US dollar.
🟡Technical Factors
- Trend Line Breakout: The AUD/USD pair has broken above a key trend line, which could indicate a bullish trend.
- Moving Average Crossover: The 50-day moving average has crossed above the 200-day moving average, which could indicate a bullish trend.
🟠Sentimental Factors
AUD/USD sentiment analysis and market positioning are indicating a slightly bullish tone. Here's the breakdown:
- Bullish Sentiment: 55% of traders and investors are bullish on AUD/USD, expecting the pair to rise ¹.
- Bearish Sentiment: 35% of traders and investors are bearish on AUD/USD, expecting the pair to fall.
- Neutral Sentiment: 10% of traders and investors are neutral on AUD/USD, expecting the pair to trade sideways.
In terms of market positioning, the AUD/USD pair has seen a decrease in short positions, with CAD and AUD shorts decreasing, as reported by Rabobank ¹. This could indicate a potential bullish trend. However, it's essential to note that market sentiment can change rapidly and may not continue to drive the AUD/USD pair higher.
Trading Alert⚠️ : News Releases and Position Management 📰 🗞️ 🚫🚏
As a reminder, news releases can have a significant impact on market prices and volatility. To minimize potential losses and protect your running positions,
we recommend the following:
Avoid taking new trades during news releases
Use trailing stop-loss orders to protect your running positions and lock in profits
🚨Please note that this is a general analysis and not personalized investment advice. It's essential to consider your own risk tolerance and market analysis before making any investment decisions.
🚨Keep in mind that these factors can change rapidly, and it's essential to stay up-to-date with market developments and adjust your analysis accordingly.
💖Supporting our robbery plan will enable us to effortlessly make and steal money 💰💵 Tell your friends, Colleagues and family to follow, like, and share. Boost the strength of our robbery team. Every day in this market make money with ease by using the Thief Trading Style.🏆💪🤝❤️🎉🚀
I'll see you soon with another heist plan, so stay tuned 🫂

Ghost Traders FX AUD/USD Continuation on Range Fill [LONG]Bias: Long
Reasons: Last week we got the close above .63 on the daily/weekly I was looking for to signal strength coming back into AUD/USD. This doesn't mean we're long-term bullish just yet as Trump stimulated price up here through hurting the DXY with dovish comments on Tariffs - he's already strengthened it to start the week discussing Tariffs on Colombia. It's likely to me that price fills the range up to .636 before clearing out the long sentiment retail has, which could be as low as .6 - 611 before price turn long-term bullish.
Considerations: Trump being president makes longer trades more dangerous so keep this in mind, you may want to just be in and out.

Audusd bullish continuation ✔ We've seen a change in trend for #AUDUSD to the upside.
✔ There's been a breakout.
✔ A wedge has formed.
👁 Now we're waiting for a retest before entering a position on the upside.
NOTE: This analysis is based on technical factors only. ❣✌
Wishing you a fruitful week ahead!

AUDUSD - Long from bullish OB !!Hello traders!
‼️ This is my perspective on AUDUSD.
Technical analysis: Here we are in a bullish market structure from 4H timeframe perspective, so I look for a long. My point of interest is imbalance filled + rejection from bullish OB.
Like, comment and subscribe to be in touch with my content!

AudUsd could rise to 0.65AUD/USD is another USD major pair that I’m bullish on.
As shown in the posted chart, AUD, like many other currencies, faced a challenging time during the final quarter of 2024.
However, after hitting a new low at the beginning of 2025, the pair has reversed course and broken back above the falling trendline.
Additionally, a combination of bullish reversal candles and the formation of an inverted head and shoulders pattern further supports the bullish outlook.
In this context, my strategy is to buy on dips, aligning with the positive technical setup.

AUD/USD "The AUSSIE" Forex Market Heist Plan on Bullish🌟Hi! Hola! Ola! Bonjour! Hallo!🌟
Dear Money Makers & Robbers, 🤑 💰
Based on 🔥Thief Trading style technical and fundamental analysis🔥, here is our master plan to heist the AUD/USD "The AUSSIE" Forex market. Please adhere to the strategy I've outlined in the chart, which emphasizes long entry. Our aim is the high-risk Red Zone. Risky level, overbought market, consolidation, trend reversal, trap at the level where traders and bearish robbers are stronger. Be wealthy and safe trade.💪🏆🎉
Entry 📈 : Traders & Thieves with New Entry A bull trade can be initiated at any price level.
However I advise placing Buy limit orders within a 15 or 30 minute timeframe. Entry from the most recent or closest low or high level should be in retest.
Stop Loss 🛑: Using the 4H period, the recent / nearest low or high level.
Goal 🎯: 0.63800 (or) Escape Before the Target
Scalpers, take note 👀 : only scalp on the Long side. If you have a lot of money, you can go straight away; if not, you can join swing traders and carry out the robbery plan. Use trailing SL to safeguard your money 💰.
Fundamental Outlook 📰🗞️
The AUD/USD pair is looking interesting right now, with some mixed signals from the latest analysis. On one hand, the pair has stabilized at its horizontal support area, which could lead to a bullish continuation, with the price potentially breaking above the range's resistance. On the other hand, some experts are warning of a potential reversal, with the pair showing signs of exhaustion and a possible shift in momentum.
In terms of fundamentals, the Australian Consumer Inflation Expectations for July increased 6.3% annualized, while the Australian Employment Change for June came in at 88.4K and the Unemployment Rate at 3.5% . The US Initial Jobless Claims for the week of July 9th are predicted at 235K, and US Continuing Claims for the week of July 2nd are predicted at 1,383K. The US PPI for June is predicted to increase 0.8% monthly and 10.7% annualized.
The forecast for the AUD/USD turned bullish after the pair stabilized at its horizontal support area, with short-term volatility likely to rise as bulls and bears fight for control. However, the Ichimoku Kinko Hyo Cloud continues to apply downside pressure, suggesting a rocky path higher. Traders should monitor the CCI after it has formed a positive divergence in extreme oversold territory followed by a breakout above -100.
Overall, it's a bit of a mixed bag, but the bullish scenario is gaining traction. The AUD/USD pair could move in a bullish direction.
BULLISH FACTORS:
Strong US Economy: A strong US economy could lead to an increase in demand for the US dollar, which could put upward pressure on the AUD/USD pair.
Interest Rate Differentials: The interest rate differential between the US and Australia is expected to remain positive, which could support the US dollar and put upward pressure on the AUD/USD pair.
Commodity Prices: A rise in commodity prices, particularly iron ore, could put upward pressure on the Australian dollar and support the AUD/USD pair.
Trading Alert⚠️ : News Releases and Position Management 📰 🗞️ 🚫🚏
As a reminder, news releases can have a significant impact on market prices and volatility. To minimize potential losses and protect your running positions,
we recommend the following:
Avoid taking new trades during news releases
Use trailing stop-loss orders to protect your running positions and lock in profits
Please note that this is a general analysis and not personalized investment advice. It's essential to consider your own risk tolerance and market analysis before making any investment decisions.
Keep in mind that these factors can change rapidly, and it's essential to stay up-to-date with market developments and adjust your analysis accordingly.
💖Supporting our robbery plan will enable us to effortlessly make and steal money 💰💵 Tell your friends, Colleagues and family to follow, like, and share. Boost the strength of our robbery team. Every day in this market make money with ease by using the Thief Trading Style.🏆💪🤝❤️🎉🚀
I'll see you soon with another heist plan, so stay tuned 🫂

AUDUSD Potential 1:3 up to 1:11 RR | POSITION | LONGAs seen in the chart, it was expected that the ideal "supply" zone was swept. As a retailer, your normal reaction is to buy on that support area; however, looking at the bigger picture, due to the momentum of the bears, there was no clear indication for us to buy in that area, hence using SMC, we should be buying at our actual discount/supply zone. By buying in this area, we can potentially reach 1:11 RR with a minimum RR of 1:3, a reward I am sure that most of us would like, especially for those trading with big lots.
Reminder: Do not risk more than 1-3% of your port so you can make up your losses.
Disclaimer: I am not a guru or a professional trader, I am simply sharing my insight based on my understanding of the market.

#AUDUSD WEEKLYAUDUSD (Weekly Timeframe) Analysis
Market Structure:
The price is currently testing a channel support level that has consistently acted as a strong base for upward movements in the past. This indicates a potential area for bullish momentum to emerge if the support holds.
Forecast:
A buy opportunity is anticipated if the price confirms a bounce from the channel support, signaling a potential move toward the upper boundary of the channel.
Key Levels to Watch:
- Entry Zone: Near the channel support level after confirmation of a bounce.
- Risk Management:
- Stop Loss: Placed below the channel support to limit downside risk in case the pattern fails.
- Take Profit: Target the midline or the upper boundary of the channel for potential upside gains.
Market Sentiment:
The price action at the channel support reflects a possible bullish sentiment, with buyers likely to regain control if the support remains intact. Waiting for confirmation of a bounce is recommended before entering the trade to ensure alignment with market direction.

AUDUSD Retest of Key breakout area at 0.62060-Fakeout or Retest.Following US CPI coming out as expected, (showing a slight uptick in inflation for December) TVC:DXY pushed back to 108.6-108.4 area:
-> A rising wedge was identified on AUD/USD with an exit on the upside following CPI release.
-> Aussie is trading at a key area around 0.6260, whether it will be a retest of the top of the wedge or a reclaim of this resistance and become a fakeout is still to be determined.
Bulls narrative:
-> Bulls see the current set up as a breakout from a wedge followed by a three leg pullback (5 min the time frame), they want a retest of 0.6260 followed by a follow through buying around 0.6260 and a reclaim of the 5 min EMA. bulls need to see follow through buying and consecutive bull bars. Previous 4H close above 0.62070 shows the market is willing to go above.
Bears narrative
-> After breakout there was no significant follow through buying followed by 5 consecutive bear bars on the 30 min. >A reclaim of the 0.62025 on the 4H timeframe would open the door to downside targets for at least a test of the bottom of the wedge at 0.61700. W
-> Bears want weak buying around the 0.6260 and trap bulls for follow through selling and put them in a loosing trade
For now, trade favors bulls with potential for upside targets around the daily 20EMA and a retest of the 0.62800 and 0.63000 area. If none of these scenarios play out in the coming hours, market will go sideways to down.

AUDUSD BUY SIGNAL. Don't forget about stop-loss.
Write in the comments all your questions and instruments analysis of which you want to see.
Friends, push the like button, write a comment, and share with your mates - that would be the best THANK YOU.
P.S. I personally will open entry if the price will show it according to my strategy.
Always make your analysis before a trade
