AUDUSD Bearish Breakout – Macro and Technicals AlignAUDUSD has broken below a rising wedge formation on the 4H chart, signaling a bearish continuation. With the Reserve Bank of Australia pausing rates and weak local data weighing on sentiment, while the Federal Reserve maintains a hawkish hold due to sticky labor costs, this trade sets up well both technically and fundamentally. I'm watching for downside continuation toward 0.6379 and potentially 0.6350. The bearish bias is invalidated on a move above 0.6475.
🔍 Technical Analysis
Structure: Price broke down from a rising wedge and continues forming bear flags — each followed by further selling pressure.
Current Price Action:
Rejected sharply at ~0.6475 (last swing high)
Confirmed breakout with downside momentum
Key Support Levels:
0.6379 – minor structural support
0.6350 – major support zone from April
Resistance / Invalidation:
Above 0.6475 – would break the bearish structure and negate the setup
Bias: Bearish — clean structure, breakout momentum, and sustained lower highs
🌏 Fundamental Context
🇦🇺 Bearish AUD Drivers:
Weak domestic data:
Building Approvals: -8.8% vs -1.7% forecast
RBA on hold:
No rate hike in sight; cautious due to housing and China concerns
China slow-down:
PBOC cut rates and reduced reserve requirements — signals broader economic softness
🇺🇸 Bullish USD Drivers:
Fed holding firm:
Benchmark rate held at 4.25–4.50%
Labor costs surged +5.3% q/q
Productivity dropped -0.4%, reinforcing inflation concerns
Market repricing rate cuts:
Cuts now expected later in 2025 or even 2026
Political pressure from Trump:
Despite attacks on Jerome Powell, Fed appears unmoved
Trump teasing a “major trade deal” — potentially USD-positive if credible
🎯 Trade Setup
Entry Area: Watching 0.6420–0.6435 as a pullback zone for potential shorts
Target Levels:
First target: 0.6379
Second target: 0.6350
Stop Loss: Placed above 0.6475 (last swing high) to protect against false breakouts
Trade Thesis:
Technical structure supports downside continuation
Macro fundamentals favor USD strength and AUD weakness
Clean reward-to-risk if structure holds
🧭 Conclusion
AUDUSD setup is supported by a strong confluence of technical breakdown and macro divergence. With the Fed staying firm and the RBA cautious amid weak data, the fundamentals validate the bearish trend. As long as price stays below 0.6475, the outlook remains bearish, with 0.6379 and 0.6350 as the next logical levels. Caution around U.S. data releases or trade deal news is advised, but the path of least resistance remains downward.
Audusdshort

AUDUSD BEARISH(SELL) TECHNICAL SCENARIO.AUD/USD Market Analysis Scenario
Pair: AUD/USD
Bias: Bearish
Entry Consideration: Upon confirmation of rejection or reversal near the resistance zone.
Key Levels
Resistance: 0.64960 (critical supply zone)
1st Target: 0.64200
Final Target: 0.63800
Technical Scenario
The AUD/USD pair is currently trading below a strong resistance at 0.64960, which has acted as a key reversal zone in the recent past. Price action near this level indicates a potential bearish reversal pattern, such as a bearish engulfing, double top, or rejection wicks on higher time frames (H4 or D1).
If the pair fails to break above 0.64960, we can expect a downward movement toward the first support target at 0.64200, where minor demand might provide temporary consolidation. If bearish momentum continues, the pair could head further down to the final target at 0.63800, a previous swing low and stronger demand area.

Fri 9th May 2025 AUD/USD Daily Forex Chart Sell SetupGood morning fellow traders. On my Daily Forex charts using the High Probability & Divergence trading methods from my books, I have identified a new trade setup this morning. As usual, you can read my notes on the chart for my thoughts on this setup. The trade being a AUD/USD Sell. Enjoy the day all. Cheers. Jim

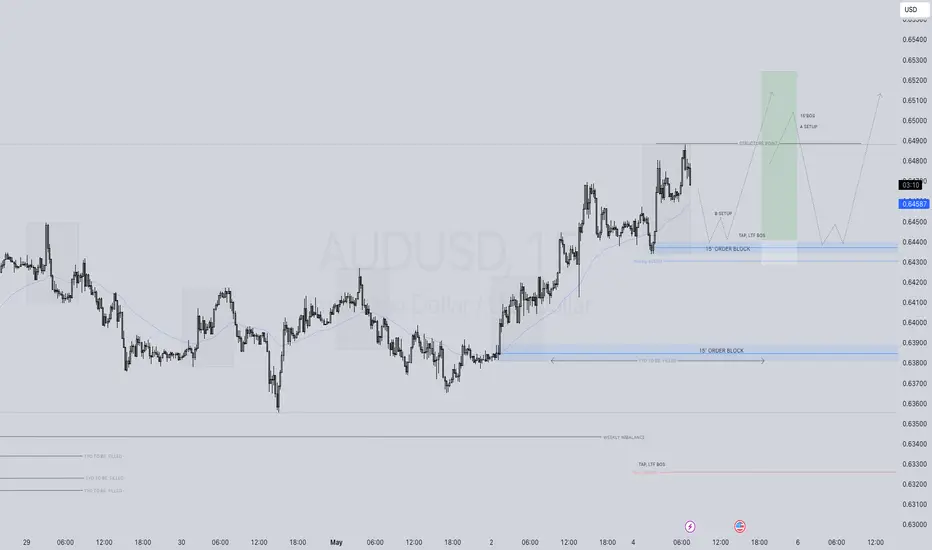
AUDUSD LONG FORECAST Q2 W19 D5 Y25
AUDUSD LONG FORECAST Q2 W19 D5 Y25
Professional Risk Managers👋
Welcome back to another FRGNT chart update📈
Diving into some Forex setups using predominantly higher time frame order blocks alongside confirmation breaks of structure.
Let’s see what price action is telling us today!
💡Here are some trade confluences📝
✅Weekly 50 EMA
✅Intraday 15' order block
✅Tokyo ranges to be filled
✅Intraday bullish breaks of structure to be confirmed
🔑 Remember, to participate in trading comes always with a degree of risk, therefore as professional risk managers it remains vital that we stick to our risk management plan as well as our trading strategies.
📈The rest, we leave to the balance of probabilities.
💡Fail to plan. Plan to fail.
🏆It has always been that simple.
❤️Good luck with your trading journey, I shall see you at the very top.
🎯Trade consistent, FRGNT X
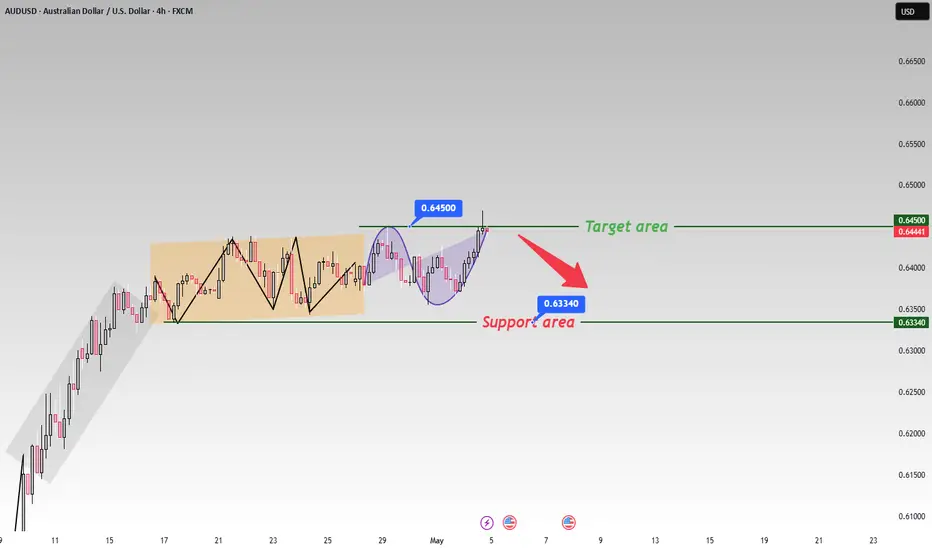
The trend next weekJudging from the price trend presented in the chart, the current market is clearly in a bearish state 📉. Previously, after the price reached the key resistance level of 0.64500, it failed to break through effectively and continue the upward trend. Instead, it entered a consolidation pattern 📊. This indicates that the bullish forces encountered strong resistance near this price level and found it difficult to push the price higher 👎.
It is expected that in the coming period, without significant positive news stimuli, the price is highly likely to continue its downward trend 📉. Investors should closely monitor whether the support level of 0.63340 holds 👀. If this support level is broken, they may consider selling short on rallies ⏬.
⚡⚡⚡ AUDUSD ⚡⚡⚡
🚀 Sell@0.6500 - 0.6450
🚀 TP 0.6350 - 0.6300
Accurate signals are updated every day 📈 If you encounter any problems during trading, these signals can serve as your reliable guide 🧭 Feel free to refer to them! I sincerely hope they'll be of great help to you 🌟
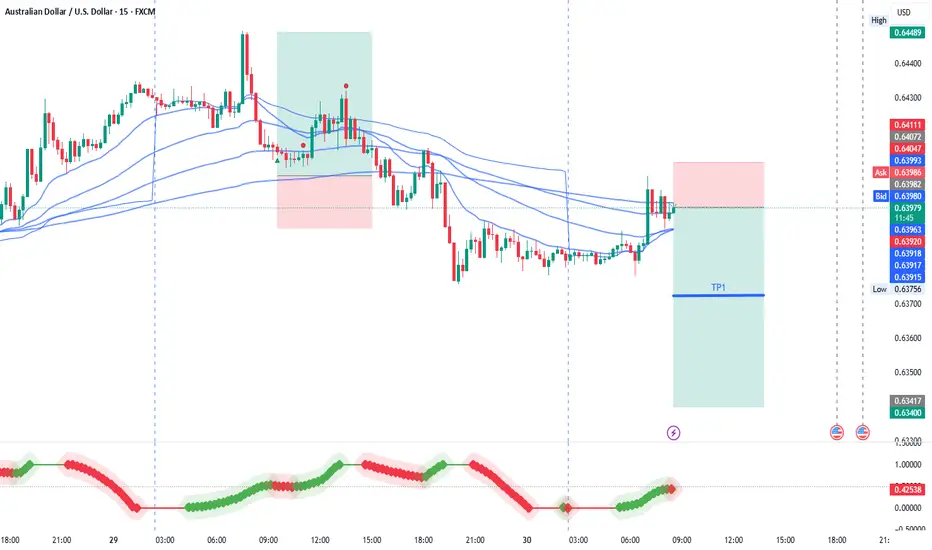
AUD/USD Opening Trends and Trading Strategies Next WeekThe AUD/USD has been in a range - bound fluctuation recently. 📈 In the short term, if the price can stay above the support level of 0.63340 and market risk - appetite sentiment rises, the AUD/USD is expected to challenge the target level of 0.64500. 🎯 However, if it breaks below the support level, it may trigger further downward adjustments. 📉
⚡⚡⚡ AUDUSD ⚡⚡⚡
🚀 Buy@0.6350 - 0.6380
🚀 TP 0.6400 - 0.6450
Accurate signals are updated every day 📈 If you encounter any problems during trading, these signals can serve as your reliable guide 🧭 Feel free to refer to them! I sincerely hope they'll be of great help to you 🌟

AUDUSD SHORT FORECAST Q2 W18 D2 Y25AUDUSD SHORT FORECAST Q2 W18 D2 Y25
Professional Risk Managers👋
Welcome back to another FRGNT chart update📈
Diving into some Forex setups using predominantly higher time frame order blocks alongside confirmation breaks of structure.
Let’s see what price action is telling us today!
💡Here are some trade confluences📝
✅Weekly 50 EMA
✅Intraday 15' order block
✅Tokyo ranges to be filled
✅Intraday 15' order block trading levels
🔑 Remember, to participate in trading comes always with a degree of risk, therefore as professional risk managers it remains vital that we stick to our risk management plan as well as our trading strategies.
📈The Xrest, we leave to the balance of probabilities.
💡Fail to plan. Plan to fail.
🏆It has always been that simple.
❤️Good luck with your trading journey, I shall see you at the very top.
🎯Trade consistent, FRGNT

AUDUSD SELL (USD NFP NEWS FRDAY TOMORROW)As the chart looks its building resistance with many wicks, we can most likely see AUDUSD will drop tomorrow as Non-Farm Payroll from USD. It does not seem it will push up as I thought to expect to break the resistance, but still keep a good watch on it.
Take Profit: 0.634 or below

AUDUSD(20250430)Today's AnalysisTechnical analysis:
Today's buying and selling boundaries: 0.6402
Support and resistance levels:
0.6475
0.6447
0.6430
0.6374
0.6356
0.6329
Trading strategy:
If the price breaks through 0.6402, consider buying, the first target price is 0.6430
If the price breaks through 0.6374, consider selling, the first target price is 0.6356

AUDUSD SHORT FORECAST Q2 W18 D30 Y25AUDUSD SHORT FORECAST Q2 W18 D30 Y25
Professional Risk Managers👋
Welcome back to another FRGNT chart update📈
Diving into some Forex setups using predominantly higher time frame order blocks alongside confirmation breaks of structure.
Let’s see what price action is telling us today!
💡Here are some trade confluences📝
✅Weekly 50 EMA
✅Intraday 15' order block
✅Tokyo ranges to be filled
✅Intraday 15' order block trading levels
🔑 Remember, to participate in trading comes always with a degree of risk, therefore as professional risk managers it remains vital that we stick to our risk management plan as well as our trading strategies.
📈The Xrest, we leave to the balance of probabilities.
💡Fail to plan. Plan to fail.
🏆It has always been that simple.
❤️Good luck with your trading journey, I shall see you at the very top.
🎯Trade consistent, FRGNT

AUDUSD SHORT IDEAUnder current market conditions, the area near 0.6398 has been identified as a critical resistance zone, where the AI model detects a high-probability trade setup.
From a technical perspective, a clear directional bias based on recent price action patterns. Suppose the market demonstrates increased volume and price stability above key moving averages in the 0.6398 area. In that case, traders are advised to monitor for trend-continuation entry opportunities in alignment with the prevailing momentum.
Profit targets are defined at 0.6372 and 0.6344, corresponding to logical technical support zones. These levels are designed for staged profit-taking across different trade management styles. Stop-loss should be strictly enforced at the designated level; once breached, the strategy is considered invalidated in order to limit potential downside.
AUDUSD Short Position IdeaUnder current market conditions, the area near 0.6407 has been identified as a critical resistance zone, where the AI model detects a high-probability trade setup.
From a technical perspective, a clear directional bias based on recent price action patterns. If the market demonstrates increased volume and price stability above key moving averages in the 0.6407 area, traders are advised to monitor for trend-continuation entry opportunities in alignment with the prevailing momentum.
Profit targets are defined at 0.6367 and 0.6333, corresponding to logical technical support zones. These levels are designed for staged profit-taking across different trade management styles. Stop-loss should be strictly enforced at the designated level; once breached, the strategy is considered invalidated in order to limit potential downside.

AUDUSD(20250425)Today's AnalysisMarket news:
Federal Reserve-①Hamack: If economic data is clear, the Fed may cut interest rates in June
②Waller: It will take until July to get a clearer understanding of how tariffs affect the economy. If tariffs lead to higher unemployment, interest rate cuts may be initiated. ③The Atlanta Fed GDPNow model predicts that the US GDP growth rate in the first quarter will be -2.5%. ④Kashkari: The frequent announcements from Washington have brought challenges to policymakers and everyone.
Technical analysis:
Today's buying and selling boundaries:
0.6387
Support and resistance levels:
0.6454
0.6429
0.6413
0.6361
0.6344
0.6319
Trading strategy:
If the price breaks through 0.6413, consider buying, the first target price is 0.6429
If the price breaks through 0.6387, consider selling, the first target price is 0.6361

AUDUSD SHORT FORECAST 5' ORDER BLOCK Q2 W17 D25 Y25 AUDUSD SHORT FORECAST Q2 W17 D25 Y25
Professional Risk Managers👋
Welcome back to another FRGNT chart update📈
Diving into some Forex setups using predominantly higher time frame order blocks alongside confirmation breaks of structure.
Let’s see what price action is telling us today!
💡Here are some trade confluences📝
✅Weekly 50 EMA
✅Intraday bearish breaks of structure
✅Tokyo ranges to be filled
✅5' order block point of interest
✅Previous daily candle bearish close
🔑 Remember, to participate in trading comes always with a degree of risk, therefore as professional risk managers it remains vital that we stick to our risk management plan as well as our trading strategies.
📈The rest, we leave to the balance of probabilities.
💡Fail to plan. Plan to fail.
🏆It has always been that simple.
❤️Good luck with your trading journey, I shall see you at the very top.
🎯Trade consistent, FRGNT X

AUDUSD SHORT FORECAST Q2 W17 D25 Y25AUDUSD SHORT FORECAST Q2 W17 D25 Y25
Professional Risk Managers👋
Welcome back to another FRGNT chart update📈
Diving into some Forex setups using predominantly higher time frame order blocks alongside confirmation breaks of structure.
Let’s see what price action is telling us today!
💡Here are some trade confluences📝
✅Weekly 50 EMA
✅Intraday bearish breaks of structure
✅Tokyo ranges to be filled
✅Daily highs rejection
✅Previous daily candle bearish close
🔑 Remember, to participate in trading comes always with a degree of risk, therefore as professional risk managers it remains vital that we stick to our risk management plan as well as our trading strategies.
📈The rest, we leave to the balance of probabilities.
💡Fail to plan. Plan to fail.
🏆It has always been that simple.
❤️Good luck with your trading journey, I shall see you at the very top.
🎯Trade consistent, FRGNT X

AUD/USD IS BEARISH STRUCTUREHowdy Traders,
AUD/USD has experienced a bearish rally for the past nine days, during which it found strong support at 0.65735 . This support level has proven reliable in the past, as it successfully held the market. Furthermore, a subsequent bullish rally was observed.
In terms of the target, the market has confirmed a bearish outlook by breaking the 100-day EMA. This indicates that the market is likely to continue selling.
If the market sustained its support level so good movement is seen on the upside.
The target is- 0.66220 , 0.66047

SHORT ON AUD/USDAUD/USD has given us a double top at a major resistance area/zone.
It has currently formed a lower high after giving us a change of character (choc) to the downside.
I expect price to drop to the next demand level for 200-300 pips.
Dxy News for the rest of the week should help fuel the move if positive for the dollar.

AUDUSD SHORT FORECAST Q2 W17 D23 Y25AUDUSD SHORT FORECAST Q2 W17 D23 Y25
Professional Risk Managers👋
Welcome back to another FRGNT chart update📈
Diving into some Forex setups using predominantly higher time frame order blocks alongside confirmation breaks of structure.
Let’s see what price action is telling us today!
💡Trade confluences
- Weekly 50 EMA rejection
- 5’ order block created
- Intraday bearish breaks of structure
- Tokyo ranges to be filled
🔑 Remember, to participate in trading comes always with a degree of risk, therefore as professional risk managers it remains vital that we stick to our risk management plan as well as our trading strategies.
📈The rest, we leave to the balance of probabilities.
💡Fail to plan. Plan to fail.
🏆It has always been that simple.
❤️Good luck with your trading journey, I shall see you at the very top.
🎯Trade consistent, FRGNT X

audusd sell signal. Don't forget about stop-loss.
Write in the comments all your questions and instruments analysis of which you want to see.
Friends, push the like button, write a comment, and share with your mates - that would be the best THANK YOU.
P.S. I personally will open entry if the price will show it according to my strategy.
Always make your analysis before a trade

AUDUSD SHORT FORECAST Q2 W17 D22 Y25AUDUSD SHORT FORECAST Q2 W17 D22 Y25
SUMMARY
- Weekly 50 exponential moving average
- Daily high rejection
Requirements
- 15' Break of structure short! Non negotiable.
- 15' order block creation to short from once price action pulls back.
🔑 Remember, to participate in trading comes always with a degree of risk, therefore as professional risk managers it remains vital that we stick to our risk management plan as well as our trading strategies.
📈The rest, we leave to the balance of probabilities.
💡Fail to plan. Plan to fail.
🏆It has always been that simple.
❤️Good luck with your trading journey, I shall see you at the very top.
🎯Trade consistent, FRGNT X

AUDUSD(20250418)Today's AnalysisMarket news:
The European Central Bank cut interest rates by 25 basis points as expected, the seventh rate cut in the past year, and this decision was unanimous.
Technical analysis:
Today's buying and selling boundaries: 0.6369
Support and resistance levels:
0.6430
0.6407
0.6392
0.6346
0.6331
0.6309
Trading strategy:
If the price breaks through 0.6392, consider buying, the first target price is 0.6407
If the price breaks through 0.6369, consider selling, the first target price is 0.6346

AUDUSD SHORT FORECAST Q2 W18 D18 Y25AUDUSD SHORT FORECAST Q2 W18 D18 Y25
Fun Coupon Friday !
SUMMARY
- IMO, if this shorts, it's a slippy slide !
- Daily order block setup
- Daily highs confluence
- Weekly 50 Ema forecast to provide resistance for the short.
- Required to await 15' breaks of structure as price is bullish/ ranging at the moment .
- upon intra day breaks of structure, anticipating a creation of 15' order block to provide an area of interest to short from.
FRGNT X

AUD/USD) Resistance level pullback Short Read The ChaptianSMC Trading point update
analysis of the AUD/USD pair on the 2-hour timeframe, showing a possible bearish setup. Here's a breakdown of the idea behind it:
Key Observations:
1. Current Trend:
The pair was in an uptrend, as indicated by the rising channel (parallel trendlines). However, it has now broken out of that channel.
2. Resistance Level:
The price has reached a resistance zone around 0.64000, and it seems to be rejecting this level.
3. 2 Timeframe Demand Zone:
Around the 0.63300 – 0.63400 range, this area previously acted as a demand zone (support), and the chart suggests price might retest it.
4. Projected Move:
First, a pullback up into the resistance zone could occur.
Then a drop to the demand zone.
If the demand zone fails to hold, the price could head down toward the key support/FVG (Fair Value Gap) around 0.61000 – 0.61500.
5. EMA (200):
The 200 EMA is below the price, suggesting longer-term bullish pressure, but it's starting to flatten, which could signal weakness in the uptrend.
6. RSI Indicator:
RSI is around 52, showing neutral momentum—neither overbought nor oversold, allowing room for movement in either direction.
Mr SMC Trading point
---
Idea Summary:
The chart suggests a potential reversal from the uptrend into a downtrend, triggered by a failure to break above resistance. The two key targets for a bearish move are:
First: the 2TF demand zone
Final: the key support/FVG zone
Pales support boost 🚀 analysis follow)
