AUDUSD 1D Death Cross formed. Any bounce is a sell opportunity.The AUDUSD pair is forming today a 1D Death Cross, as the 1D MA50 (blue trend-line) is crossing below the 1D MA200 (orange trend-line), for the first time in 11 months (since April 14 2023). Obviously it is a major technical sell signal and in fact the price action since the start of the year (Channel Down), is very similar to the one of early 2023.
The 1D RSI fractals are virtually identical and in relative terms we are at the point where the (blue) Bear Flat is about to break downwards. Any rebound at this stage is a sell opportunity and our Target is just above the 1.236 Fibonacci extension at 0.63750.
-------------------------------------------------------------------------------
** Please LIKE 👍, FOLLOW ✅, SHARE 🙌 and COMMENT ✍ if you enjoy this idea! Also share your ideas and charts in the comments section below! This is best way to keep it relevant, support us, keep the content here free and allow the idea to reach as many people as possible. **
-------------------------------------------------------------------------------
💸💸💸💸💸💸
👇 👇 👇 👇 👇 👇
Audusdsignals

Audusd daily time forecast with simple strategyAudusd daily time forecast with simple strategy.audusd bias is bullish we expecting market bullish from daily fvg .when market retest your fvg use smaller time frame confirmation .

AUDUSD: Bullish Outlook For Next Week Explained 🇦🇺🇺🇸
We see a local confirmed bullish reversal on AUDUSD.
The pair violated a key horizontal resistance and a resistance line
of a falling wedge pattern.
We can anticipate a growth.
Next resistance - 0.661
❤️Please, support my work with like, thank you!❤️

AUDUSD: Classic Bullish Patterns 🇦🇺🇺🇸
I see 2 bullish price action patterns on AUDUSD.
On a daily time frame, the price broke and closed above
a resistance line of a falling wedge pattern.
On a 1h time frame, the market violated a neckline
of an inverted head and shoulders pattern.
I think that the pair may keep growing.
Next resistance - 0.6588
❤️Please, support my work with like, thank you!❤️

AudUsd- I expect a strong reversalFebruary has been marked by two significant breaks for FX:AUDUSD : one below the 0.6525 technical support and another below the psychological barrier of 0.65.
With the pair now trading back above both levels, there is a strong likelihood that these breaks were false.
As typically observed with false breaks, a robust reversal in the opposite direction may follow.
Furthermore, if the price surpasses 0.66, we can interpret the 0.6480 zone as a higher low, indicating potential momentum for the pair to test the resistance at 0.69.
I maintain a bullish stance on the Aussie dollar as long as the price remains above the recent low, and I am looking to buy on dips.

AUD/USD Trade alert: Strong USD vs RBA's rate decisionAUD/USD Trade alert: Strong USD vs RBA's rate decision
Talk of a US$278 billion (1 trillion yuan) rescue package for Chinese shares might not be enough to support AUD/USD.
Countering this positive signal for the AUD is general US dollar strength, caused by a shift in the market regarding the likelihood of a March rate cut. At the turn of the year, it was priced above 80% probability, but that's now fallen to 42%.
On the daily chart, we can see the AUD/USD testing on the key support zone at 0.6550 with some consolidation just above this level before the next move.
Looking a little further ahead, AUD might find the upwards momentum it needs with Australia's inflation rate data released on January 30 next week, followed closely by the Reserve Bank of Australia's interest rate decision on February 5.
The inflation figure is the last major report the RBA will have to consider before it meets next week for its first interest rate decision of 2024. Will they keep their rate unchanged on February 5 or surprise the market with another 25-basis-points hike and give a pop to the AUD/USD?

AUDUSD Channel Down still intact. Bullish if broken.The AUDUSD pair completed the bullish leg that we caught on our last call (October 24) and hit our 0.66000 1D MA200 (orange trend-line) target (see chart below):
The price has made a initial rejection at the top (Lower Highs trend-line) of the Channel Down, so the pattern remains intact. Technically this is the start of the Bearish Leg towards Support 1 and 2 eventually near the Lower Lows trend-line. The bearish break-out signal will be given when the 1D RSI breaks below its Higher Lows. As a result until Resistance 1 (0.66900) breaks, we will target 0.62715 (Support 1) and upon a 1D candle closing below, 0.61715 (Support 2).
If however Resistance 1 (hence the Lower Highs trend-line) breaks first, we will take the short's loss and instead buy, targeting first the 1W MA100 (red trend-line) at 0.67800 (+4.00% as the November 06 High) and upon a 1D candle closing above, extend to 0.68800 (+5.50% as the December 04 High).
-------------------------------------------------------------------------------
** Please LIKE 👍, FOLLOW ✅, SHARE 🙌 and COMMENT ✍ if you enjoy this idea! Also share your ideas and charts in the comments section below! This is best way to keep it relevant, support us, keep the content here free and allow the idea to reach as many people as possible. **
-------------------------------------------------------------------------------
💸💸💸💸💸💸
👇 👇 👇 👇 👇 👇

Possible opportunity in Aussie vs USD this week?US dollar
Attention will be paid to key economic indicators that roll out over the course of the week such as the Non-farm Payrolls jobs report, JOLTs job openings, and the ISM Services PMI survey.
Moody's analysis suggests a cooling down of various labor market measures. The uptick in November jobs growth is attributed to the impact of the United Auto Workers strikes in October rather than a substantial resurgence in the labor market.
Aussie Dollar
The Reserve Bank of Australia (RBA) is anticipated to maintain its interest rate in its upcoming meeting on Wednesday, with a 97% probability for the rate to stay at 4.35%. There is only a 3% chance of a 25bps hike to 4.60%. This expectation follows the RBA's decision to raise the Cash Rate by 25bps in the last November meeting.
A surprise decision by the RBA (or even a change in outlook) could see the Aussie dollar spike like the NZ dollar did last week. Look for weak preliminary job numbers coming from the US for extra confirmation of a bullish Aussie outlook.

AUD/USD: The impact of Xi-Biden's San Fran face-offThe AUDUSD and NZDUSD led the rally against the US dollar yesterday and are doing the same again today.
The surprising low inflation number from the US is what caused the rally yesterday. But today we have a new event that could be driving sentiment in these pairs. This event is still underway, so it still to play out completely, and its consequences still to be digested and figured into the market: This event is the meeting of Chinese President Xi Jinping and US President Joe Biden in San Francisco.
The meetings represent a cooling of trade (and otherwise) tensions between the two countries.
What next?
A weak support has been established around 0.64828. I would like to see the pair probe for a close closer to 0.65400 before concluding that there is a definite bullish bias. We will be watching news reports about the mood of the meeting and any outcomes to gain an understanding of the fundamental drivers for the AUD.

Short Opportunity for AUD/USDThe AUD/USD pair currently exhibits a strong bearish trend. The price has breached the weekly support level, although the candle has not yet closed below it. Additionally, it has broken the 4-hour support level and the Friday low of the day. While there is no immediate entry confirmation, a potential short trade opportunity emerges.
For a safer entry, consider waiting for a price pullback to the 0.64342 and 0.63357 zone or at least the 4-hour support level (which would then act as resistance). A successful bearish confirmation at this level would be a strong signal to enter the short trade. This area is significant as it aligns with 15-minute and 5-minute resistance levels, adding to its importance.
The target for this short trade is set at 0.63747, a daily support level. This target represents a potential gain of at least 60 pips.
Please exercise caution and ensure proper risk management in your trading strategy. Keep in mind that trading involves risks, and this idea is not financial advice. Conduct your own research, consider your risk tolerance, and consult with a professional financial advisor if needed.

AUDUSD Buy confirmed if the 1D MA50 breaks.The AUDUSD pair has been trading within a Channel Down pattern since February 02. Yesterday it hit again Support 1 (0.62885) for the 3rd time in October and held it. The first hit was also on the Diverging Lower Lows trend-line of the Channel Down and even though there is still room before it hits the hard bottom of the pattern, the Bullish Divergence (Higher Lows) on the 1D RSI in the past 2 months, indicates that this is already a strong buying candidate.
If a 1D candle closes above the 1D MA50 (blue trend-line), something we haven't seen since July 31 2023, buying will be confirmed. Our target it at least the 0.5 Fibonacci retracement level at 0.66000. The June 16 rebound even hit the 0.618 Fibonacci retracement level, which currently is above the 1D MA200 (orange trend-line), a key long-term Resistance.
-------------------------------------------------------------------------------
** Please LIKE 👍, FOLLOW ✅, SHARE 🙌 and COMMENT ✍ if you enjoy this idea! Also share your ideas and charts in the comments section below! This is best way to keep it relevant, support us, keep the content here free and allow the idea to reach as many people as possible. **
-------------------------------------------------------------------------------
💸💸💸💸💸💸
👇 👇 👇 👇 👇 👇

AUDUSD Bullish Divergence on RSI hints to a rise.The AUDUSD pair delivered us an excellent sell signal on Aug 02 (see chart below), hitting our 0.6400 target:
The price has now been consolidating at the bottom of the 7-month Channel Down on Lower Lows and with the 1D RSI on Higher Lows at the same time, we have a strong Bullish Divergence at hand.
The Lower Highs leg that bottomed on March 08, reached the 0.382 Fibonacci retracement level and the 1D MA50 (blue trend-line). As a result we are bullish, targeting 0.65600.
-------------------------------------------------------------------------------
** Please LIKE 👍, FOLLOW ✅, SHARE 🙌 and COMMENT ✍ if you enjoy this idea! Also share your ideas and charts in the comments section below! **
-------------------------------------------------------------------------------
💸💸💸💸💸💸
👇 👇 👇 👇 👇 👇

AUDUSD Open trade based on today's candle closing.The AUDUSD pair has been trading within a Channel Down pattern since the February 02 2023 High and the rejection on the 1W MA100 (red trend-line). Since June 16 however, it formed a short-term Rectangle pattern, which today broke below its 0.65950 Support 1.
We will trade this depending on today's 1D candle closing. If it closes above the 0.65950 Support and back inside the Rectangle, then it will remain bullish towards the Channel Down's top (Lower Highs) with the targeted zone being 0.68000 - 0.68350. If it closes below 0.65950, it will be a confirmed bearish break-out, thus a sell signal for us, targeting 0.6400 (just above Support 2).
-------------------------------------------------------------------------------
** Please LIKE 👍, FOLLOW ✅, SHARE 🙌 and COMMENT ✍ if you enjoy this idea! Also share your ideas and charts in the comments section below! **
-------------------------------------------------------------------------------
💸💸💸💸💸💸
👇 👇 👇 👇 👇 👇

AUDUSD Trade PlanAUDUSD testing strong support area again, let's wait if support breaks or resist from the area.
Manage your risk according to account size!
Potential swing trade long on AUD/USD 1-hour chartAUD/USD pulled back for a second day on Monday thanks to weak data from China and rising geopolitical tensions as Russia have backed to of a key gain deal. Support was found around the weekly pivot point, RBA ‘pause’ high and 38.2% Fibonacci retracement level, and the subsequent rally suggests a swing low is in place.
The RBA minutes are due in ~2 hours, and we’d welcome any pullback towards 68c which could help improve the potential reward to risk ratio for longs. Of course, if the minutes are as dovish as hoped then AUD runs the risk of breaking beneath yesterday’s low and invalidating the near-term bullish bias.
But we suspect the minutes may be a little more hawkish than liked, which leaves the potential for it to pop higher. We have a target near the upper 1-day implied volatility band around 0.6850.

32,600 Jobs Added! Aussie Dollar Skyrockets!The Australian dollar has surged, driven by an impressive employment report that far exceeded expectations. In the month of June, Australia's net employment rose by a staggering 32,600 compared to the previous month, surpassing estimates by more than double.
This development propelled the Aussie currency up by over 0.9%, reaching an intra-day high of $0.6834. The New Zealand dollar also rode the wave, gaining 0.57% to reach $0.6299. Both Antipodean currencies are now poised to reverse the losses incurred over four consecutive trading sessions.
The current market sentiment favors the bulls, with both short and long-term momentum in their favor. Price action is trading above the 50 and 200-day moving averages, reinforcing the positive outlook for the Australian dollar.
Elsewhere in the currency market, the sterling is doing its best to counter deep losses following a sharp fall in the previous session. The decline was prompted by Britain's inflation data, which fell short of market expectations.
The British pound managed a modest recovery, trading 0.15% higher at $1.2958 in the latest session.

AUDUSD Channel Down approaching its bottom. Time your buy.The AUDUSD pair is trading within a Channel Down pattern since the February 14 High and currently is close to completing the Bearish Leg to the new Lower Low. Our target is 0.64000, just above Support 1, where we will turn bullish again. The 1D RSI below 30.00 will be the ideal buy signal. The buy's target will be 0.66250, always below the 1D MA100 (green trend-line).
-------------------------------------------------------------------------------
** Please LIKE 👍, FOLLOW ✅, SHARE 🙌 and COMMENT ✍ if you enjoy this idea! Also share your ideas and charts in the comments section below! **
-------------------------------------------------------------------------------
💸💸💸💸💸💸
👇 👇 👇 👇 👇 👇

AUDUSD Top-down analysisHello traders, this is a complete multiple timeframe analysis of this pair. We see could find significant trading opportunities as per analysis upon price action confirmation we may take this trade. Smash the like button if you find value in this analysis and drop a comment if you have any questions or let me know which pair to cover in my next analysis.

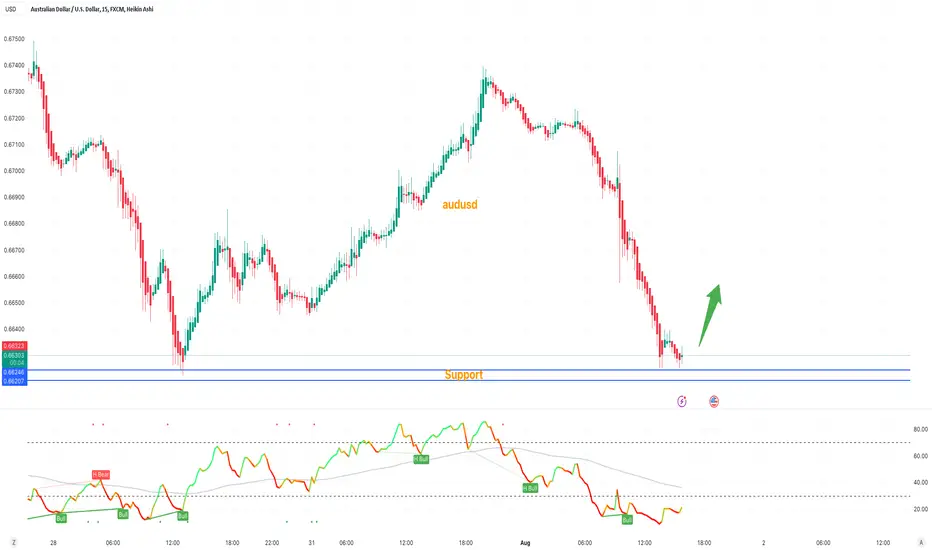
AUDUSD Bulls CampAs AUDUSD approaches 0.66260, look out for bullish candles suggesting a bullish move.

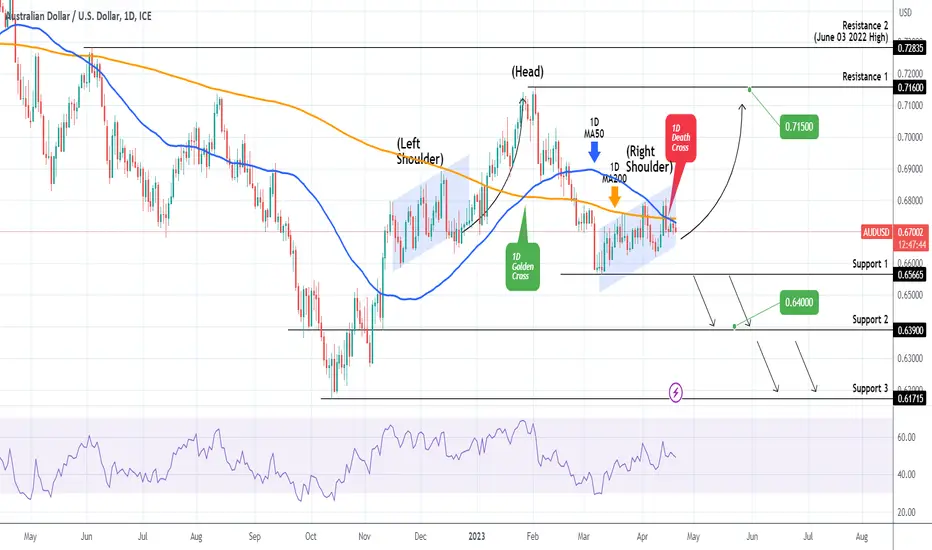
AUDUSD Head & Shoulders but don't sell until the Support breaksThe AUDUSD pair is forming a Head and Shoulders (H&S) pattern on the 1D time-frame, having also completed a Death Cross (1D MA50 crossing below the 1D MA200) three days ago. This is a technically bearish pattern. We will stay bullish however, targeting 0.71500 until Support 1 (0.65665) breaks. In that case we will target 0.64000.
-------------------------------------------------------------------------------
** Please LIKE 👍, FOLLOW ✅, SHARE 🙌 and COMMENT ✍ if you enjoy this idea! Also share your ideas and charts in the comments section below! **
-------------------------------------------------------------------------------
💸💸💸💸💸💸
👇 👇 👇 👇 👇 👇
AUDUSD BuyAUD seems more bullish against the USD. As we all knows that the market condition of USA is not good and the politics instability decreasing the value of USD.

Audusd ready to big drop Audusd ready to big drop are you ready for next move i m expecting big droping

AUDUSD 24 Feb 2023Short Call on the biases of Dow Theory Series of Lower Highs and Lower lows.
Trade Plan
Short Call
Entry Price : 0.68114
Stop Loss : 0.70321
Target Price 1 : 0.66144
Target Price 2 : 0.64159
( Lot Size 0.05 as per Capital of USD 10000 1% Risk)
