AUDUSD ready to test the bottom of the channelThe aussie dollar pair dropped farther this week and it's ready for another drop down to test the bottom of the channel. If the channel fails to hold, we think that we can see farther down side. The coming week should be rather choppy as the market finds direction.
BEAR CASE
One more drop down to test the bottom of the channel at 0.725 is needed before consolidation to find next big move. This move can be either to the downside or upside.
BULL CASE
From here, the correction upwards may be stronger before the dump comes, 0.73711 is good for a short if this scenario plays out.
Audusdsignals

AUDUSD Buy Signal long-termThis pair got rejected recently on the 1D MA200 (orange trend-line) as it was rising from August lows but right now is ahead of a strong bullish signal, which last time started a very strong multi-month rally.
That is the 1D MA50 (blue trend-line) / MA100 (green trend-line) Bullish Cross, which last time it happened on June 09 2020 started a Channel Up and never revisited that low. Based on this fractal I am expecting AUDUSD to hit the 1.5 Fibonacci extension by the end of this year and set a long-term Target Zone within the 2.0 - 2.5 Fib Zone by mid 2022.
So far this is in line with my multi-year view as posted in July:
--------------------------------------------------------------------------------------------------------
** Please support this idea with your likes and comments, it is the best way to keep it relevant and support me. **
--------------------------------------------------------------------------------------------------------

AUDUSD | Perspective for the new week | Follow-up detailsSince my last publication on this pair, the price moved 150pipos in our direction before the reversal began (see link below for reference purposes). The Greenback 5-months winning streak appears to have come to end. The appearance of a Double Bottom pattern coupled with the relaxation of COVID-19 restrictions in Sydney, Australia’s most populated city after a four-month lockdown appears to bring hopes for the Aussie in the coming week(s).
Tendency: Uptrend (Bullish)
Structure: Supply & Demand | Trendline | Reversal pattern (Double Bottom)
Observation: i. The visual representation of a line drawn over pivot highs revealed the momentum and prevailing direction of price action in the last 5 months.
ii. Since the beginning of the year 2021 (February to be precise), we witnessed a downward spiral in price action until the price hit a bottom around $0.71 - a level that appears to be difficult for sellers to break down.
iii. Following the test of $0.71 on the 20th of August 2021; the price found a higher low to signal the possibility of a reversal, the beginning of a potential uptrend and at the same time raise the expectation of a Double Bottom structure.
iv. The appearance of a Double Bottom pattern is an extremely strong reversal pattern that describes a change in trend and a momentum reversal from prior leading major or minor downtrend.
v. The Breakout of Bearish Trendline on the 11th of October 2021, gives more credibility to the Bullish bias as we anticipate a Breakout of Neckline @$0.74000 in the coming week(s) for confirmation details.
vi. In case a correction happens in the early hours/days of the new week, I have identified a window on the chart for buying opportunities between $0.73000 7 $0.74000 with an opportunity to add to our existing position at Breakout/Retest of Neckline... Trade consciously!😊
Trading plan: BUY confirmation with a minimum potential profit of 250 pips.
Risk/Reward : 1:4
Potential Duration: 5 to 10days
NB: This speculation might be considered to make individual decisions on the lower timeframe.
Watch this space for updates as price action is been monitored.
Risk Disclaimer:
Margin trading in the foreign exchange market (including commodity trading, CFDs, stocks etc.) has a high risk and is not suitable for all investors. The content of this speculation (including all data) is organized and published by me for the sole purpose of education and assistance in making independent investment decisions. All information herein is for your reference only and I take no responsibility.
You are hereby advised to carefully consider your investment experience, financial situation, investment objective, risk tolerance level, and consult your independent financial adviser as to the suitability of your situation prior to making any investment.
I do not guarantee its accuracy and is not liable for any loss or damage which may result directly or indirectly from such content or the receipt of any instruction or notification therewith.
Past performance is not necessarily indicative of future results.

AUDUSD Technical Analysis
⏳ Forex
💎 AUDUSD has formed a Bullish Flag. It has been rejected from the bottom of the flag and we see a large green candle which indicates we might see a Bullish move soon. After the breakout we will see a Bullish move.
💵 Invest Only 2% of your Portfolio
🎳 Entry at market or 0.73300
☕️ TP1 0.74090
🍺 TP2 0.75000
🚫 SL 0.72500
Check the Links in Description and If you LIKE this analysis, Please support our page and Ideas by hitting the LIKE 👍 button. ❤️ Your Support is really appreciated! ❤️
Traders, if you have your own opinion about it, please write your own in the comment box. We will be glad for this.
Feel free to request any pair/instrument analysis or ask any questions in the comment section below.
We will have more FREE forecasts in TradingView soon
Have a Profitable Day

AUDUSD | Perspsective for the new weekThe Aussie suffered the most on Tuesday after the Reserve Bank of Australia announced its decision to maintain its tapering plans, reducing its bond-buying purchases from A$5 billion to A$4 billion per week. Reaction after this decision is evident on the market as the price rejected $0.748000 to drop 1.81% during the course of last week trading session. In this regard, I am anticipating that the Aussie might turn bearish in the mid-term on a break below $0.73300.
Tendency: Downtrend (Bearish)
Structure: Breakdown | Supply & Demand | Trendline
Observation: i. The Demand zone which has held price "supported" since the beginning of the year 2021 was finally broken to the downside in June/July 2021 to set a bearish tone on the market.
ii. The line drawn above pivot highs is a visual representation that reveals the prevailing direction of price action since May 2021 and it appears price will continue to respect this line considering the current market structure.
iii. This been said, it is pertinent that I state here that the early hours/days of the new week might see a price climb to test either the Trendline (forming a Double Top) or extend beyond to reject Key zone at around $0.75300 and $0.76000 (61.8% retracement of Impulse leg) to incite a risk of further decline in price.
iv. And it is possible that this declination might transpose into a Harmonic pattern (AB = CD) with parameters explained below;
a. Impulse A-to-B is expected to be in harmony with the potential C-to-D leg.
b. The B- to-C is currently at a 50% retracement with the possibility of extending into 61.8% Fibonacci retracement of the A-to-B leg.
c. The C-to-D leg is expected to fall within 127.2 - 1.414% Fib. ext. of the A-to-B leg @ around $0.68800.
v. So, at this juncture patience is indeed required as the market open will help us determine when it is most appropriate to hop in the decline train.
NB: Below Key level appears to be the safest area to take on a short position... Trade consciously!😊
Trading plan: SELL confirmation with a minimum potential profit of 350 pips.
Risk/Reward : 1:5
Potential Duration: 10 to 20days
NB: This speculation might be considered to make individual decisions on the lower timeframe.
Watch this space for updates as price action is been monitored.
Risk Disclaimer:
Margin trading in the foreign exchange market (including commodity trading, CFDs, stocks etc.) has a high risk and is not suitable for all investors. The content of this speculation (including all data) is organized and published by me for the sole purpose of education and assistance in making independent investment decisions. All information herein is for your reference only and I take no responsibility.
You are hereby advised to carefully consider your investment experience, financial situation, investment objective, risk tolerance level, and consult your independent financial adviser as to the suitability of your situation prior to making any investment.
I do not guarantee its accuracy and is not liable for any loss or damage which may result directly or indirectly from such content or the receipt of any instruction or notification therewith.
Past performance is not necessarily indicative of future results.

AUDUSD Testing the 1W MA200AUDUSD is testing the MA200 on the 1W time-frame (orange trend-line). Since the pair is coming off a Lower Highs rejection following the impressive rally since the March 2020 "COVID" bottom, the sequence displays many similarities to the last major rally off a bottom back in the aftermath of the 2008/2009 Mortgage Crisis.
As you see on the chart, following the October 2008 bottom, after a 1W Golden Cross, the price got rejected on the Lower Highs trend-line and pulled-back. It did find Support however just below the 1W MA200.
Today the situation seems quite similar. The 1W Golden Cross of early April formed a top on the Lower Highs trend-line and the price is currently testing the 1W MA200. Since the RSI is near the Symmetrical low trend-line of the 2010 bottom, it is very possible to find a Support around the current levels. A fair target zone is the 1.236 - 1.382 Fibonacci extension levels, which was where AUDUSD peaked in July 2011.
** Please support this idea with your likes and comments, it is the best way to keep it relevant and support me. **
--------------------------------------------------------------------------------------------------------
!! Donations via TradingView coins also help me a great deal at posting more free trading content and signals here !!
🎉 👍 Shout-out to TradingShot's 💰 top TradingView Coin donor 💰 this week ==> CryptoCreatin
--------------------------------------------------------------------------------------------------------

AUDUSDwhen u get analysis and what is tell had about u take entry but its purely price action pattern and i already post my analysis head and shoulder pattern but its gonna have to running in profit this take profit not over which go side my suggestion is sell side take profit 0.72194

AUDUSD | Perspective for the new week | Follow-upPrice has moved over 200pips in our direction since my last publication (see link below for reference purposes) and it appears there is still room for a rally in the nearest future!
The Aussie flourished against the Greenback on Friday by breaking the existing Supplication barrier @ $0.78000 to hit a new high in over a month. Figures were driven higher by surging commodity prices and a plunge in U.S. Treasury yields coupled with reports from U.S. jobs data release for April coming in well below expectations resulting in the Greenback hitting its lowest in more than two months. Current development suggests that the Breakout of Channel during last week trading session raises hopes of further rise in the coming week(s).
Tendency: Uptrend ( Bullish )
Structure: Breakout | Supply & Demand | Channel | Trendline
Observation: i. Following the Impulse leg (13th April 2021); The appearance of a Channel graphically represents the peaks and troughs of price action over the last 22 days.
ii. The Channel is also a clue to the indecision that prevailed in the market before culminating in a Breakout during last week trading session.
iii. I am of the opinion that this Breakout is a signal that a Bullish continuation is imminent hence the need to look out for an opportunity to take advantage of the rally.
iv. In this regard, I am anticipating that a correction into the $0.77400/0.78000 area in the coming week(s) could incite a trigger.
v. To be on the safe side for a rally continuation, anywhere above the Key level @ $0.77700 should be an appropriate zone to join the train and should price decide to dip further, I have identified Buy window II for buying opportunity.
Trading plan: BUY confirmation with a minimum potential profit of 180 pips.
Risk/Reward : 1:5
Potential Duration: 4 to 7 days
NB: This speculation might be considered to make individual decisions on the lower timeframe.
Watch this space for updates as price action is been monitored.
Risk Disclaimer:
Margin trading in the foreign exchange market (including foreign exchange trading, CFDs, etc.) has a high risk and is not suitable for all investors. The content of this speculation (including all data) is organized and published by me for the sole purpose of education and assistance in making independent investment decisions. All information herein is for your reference only and I take no responsibility.
You are hereby advised to carefully consider your investment experience, financial situation, investment objective, risk tolerance level, and consult your independent financial adviser as to the suitability of your situation prior to making any investment.
I do not guarantee its accuracy and is not liable for any loss or damage which may result directly or indirectly from such content or the receipt of any instruction or notification therewith.
Past performance is not necessarily indicative of future results.

AUDUSD | Perspective for the new week | Follow-upMy last publication on this pair witnessed price moved over 100pips in our direction before the Bullish run began (see link below for reference purposes).
The Aussies started the week knocking against major Resistance at AU$0.76300 (Selling pressure) for 3 consecutive days before the breakthrough on Thursday. Considering the long-term Bullish expectation; The Aussie could be on the verge to recover ground as we might be in for a LONG Bullish ride as the price appears to Breakout of a Reversal pattern during last week trading session with emphatic moves from a very strong Demand level @ AU$0.7600 (check weekly chart).
Tendency: Uptrend ( Bullish )
Structure: Breakout | Supply & Demand | Reversal Pattern (DB)
Observation: i. The Bearish run that began mid-month appears to have found bottom @ AU$0.75800 as the continuous rejection of this level resulting in the appearance of a Double Bottom (a strong reversal pattern) followed by Highers Highs culminating in a Breakout of AU$0.72600 last week.
ii. AU$0.72600 level shall be my Key level and a zone having the tendency to pronounce a New Demand level for future buys.
iii. AU$0.7600/0.76200 appears to be an area to look out for completion of Correction of the last Breakout to buy; However, should price decide it's not dipping to this level, an area above Key level @ AU$0.726000 on lower time frames should be a good opportunity to join the rally.
iv. This been said, I and my team shall be looking for levels above key level to join the rally in the coming week... Trade consciously!:)
Trading plan: BUY confirmation with a minimum potential profit of 400 pips.
Risk/Reward : 1:8
Potential Duration: 7 to 12days
NB: This speculation might be considered to make individual decisions on the lower timeframe.
Watch this space for updates as price action is been monitored.
Risk Disclaimer:
Margin trading in the foreign exchange market (including foreign exchange trading, CFDs, etc.) has a high risk and is not suitable for all investors. The content of this speculation (including all data) is organized and published by me for the sole purpose of education and assistance in making independent investment decisions. All information herein is for your reference only and I take no responsibility.
You are hereby advised to carefully consider your investment experience, financial situation, investment objective, risk tolerance level, and consult your independent financial adviser as to the suitability of your situation prior to making any investment.
I do not guarantee its accuracy and is not liable for any loss or damage which may result directly or indirectly from such content or the receipt of any instruction or notification therewith.
Past performance is not necessarily indicative of future results.

AUDUSD SELL @ BREAKOUTHELLO FRIENDS AS I CAN SEE AUDUSD IS REACHED @ 3 YEARS HIGHS AND HIT 0.8000 AS WE PREDICT IN OUR BUYING ANALYSIS ON THIS PAIR SUCCESSFUL ACHIEVE TPS
NOW ITS SHOWING US SOME BEARS IN HOUSE AND MAKING A $ GREEN BACK WITH SUPPORT OF US PASSING 1.9 TRILLIONS SHOWING US BEARS WILL PUSH THIS PAIR
TO MORE LOWER TILL DESIGN OUR NEW LEVELS
SO SELL ON CONFIRMATION OF TREND LINE AND A STRONG SUPPORT BROKEN ON LAST FRIDAY CLOSING AND TODAY IS NEW MONTH OPENING HOPE SO THIS MONTHLY CANDLE
AUSSIE PAIRS PUSH TO DOWN SIDE MORE FOR A LITTLE RETRACE CHART IS BASED ON 4 HR FRIENDS PUSH LIKE AND COMMENT IT HELP ALOTE TO PROMOTE THE IDEA TO MANY OTHER PEOPLES
FOLLOW US FOR MORE UPDATES

AUDUSD SELL AFTER CONFIRMATION As i am watching this pair is trading near a resistance level and if it rejected from this level
and break the trend line then on confirmation of retested brokered support start sell on dips
with a small risk and aiming for a higher rewards
Friend push likes and comments we appreciate Ur love and support
Follow us for more updates

AUD/USD: ELLIOT WAVE THEORY (EWT)AUD/USD started to rise from the support trendline. And it's made the Elliott wave pattern on the daily time frame. After the ABC correction, now it's trying to hit 0.7660 - 0.7700 - 0.7800 .
But what if it breaks the support trendline?
If it starts to fall, the targets will be 0.7400 - 0.7360 .

AUDUSD | Perspective for the new weekThere are possibilities that the Greenback might gain some ground against the Aussie in the coming week... Following the Bullish run; Price finally hits a peak @ $0.78200 at the beginning of the new year followed by successive Lower Lows channelled through a descending range culminating into a successful Breakdown of Key level @ $0.76800 last week.
Tendency: Downtrend ( Bearish )
Structure: Reversal pattern | Breakdown | Supply & Demand | Channel
Observation: i. Breakdown of key level @ $0.78600 during the course of last week trading session followed by an immediate rejection of this level signals risk of further decline in the coming week(s).
ii. The sharp rejection of $0.77000 level makes this level a new Supply zone to watch out for Shorting opportunity in the coming week.
iii. It is also worthy to note that the Breakdown of Descending channel @ $0.76000 reveals the strong tendency of Sellers at this juncture in the market and might also be a strong area for rejection after a successful Breakdown in the nearest future.
iv. Conscious trading might scream "patience" allowing a Breakdown to happen hereby looking forward to taking advantage of the rejection.
Trading plan: SELL confirmation with a minimum potential profit of 150 pips.
Risk/Reward : 1:3
Potential Duration: 1 to 5 days
NB: This speculation can be considered to make decisions on lower timeframes.
Watch this space for updates as price action is been monitored.
Risk Disclaimer:
Margin trading in the foreign exchange market (including foreign exchange trading, CFDs, etc.) has a high risk and is not suitable for all investors. The content of this speculation (including all data) is organized and published by me for the sole purpose of education and assistance in making independent investment decisions. All information herein is for your reference only and I take no responsibility.
You are hereby advised to carefully consider your investment experience, financial situation, investment objective, risk tolerance level, and consult your independent financial adviser as to the suitability of your situation prior to making any investment.
I do not guarantee its accuracy and is not liable for any loss or damage which may result directly or indirectly from such content or the receipt of any instruction or notification therewith.
Past performance is not necessarily indicative of future results.

Is AUD/USD in a Short Time Fall?Here's the AUD/USD 15m chart. It started to rise from the 19th of March,2020. The actual trend is positive. Right now, it's trying to hit 0.7732 , and for that, it has to cross 0.7728 . If AUD/USD keeps moving upward, then a target for the uptrend will be 0.7740 - 0.7749 .
But there is an absolute possibility of the reversal from 0.7732 (nearby level). And if there is a reversal or a fall, then a target for the short time downtrend is as following 0.7705 - 0.7690 - 0.7680 .

AUDUSD STILL BULLISHAs i can see Aud $ is still in bullish trend and closedd weekly above support zone
so we expect it will continue the bullish trend and we are buying from support till design levels
friend its a great love to support us Push like and comment
Follow us for more updates

AUD/USD is Going To Hit The Support Soon.If you see AUD/USD on the daily timeframe, it's an uptrend. Here is the 15m chart of the AUD/USD, and it's moving upside with the fluctuations in the trend. It will fall to the following levels 0.7640 - 07630 - 0.7625 , and then it will take a reversal from the support. And after that, it will rise to the support level, and the targets are following 0.7635 - 0.7650 - 0.7670 - 0.7679 .
But if AUD/USD does not take reversal from the support and starts to fall by breaking the support( 0.7627 ), then the trend will hit the following levels 0.7610 - 0.7600 - 0.7580 .

Will AUD/USD Breaks the Support?Currently, AUD/USD is moving upward. It started to rise from the 19th of March 2020 and still moving upside. Right now, It's moving a little downside, and then it will again start to rise. The trend will rise to the following targets 0.7621 - 0.7635 - 0.7641 - 0.7700 - 0.7800 .
But what if it breaks the support and fall?
If it starts to fall by breaking the support then the targets for the fall will be 0.7598 - 0.7592 - 0.7580 .

AUDUSD SELL FROM WEEKLY RESISTANCE As i can see this pair has reached weekly @strong resistances level now expected a retrace from this zone
so we are entering on sell this pair for a small risk and higher rewards
friend push likes and support us we love ur comments
follow us for more updates to stay updated

AUD/USD is Moving DownwardsIt is the AUD/USD 2hr chart. At present, it's rising by taking the support of the minor support trendline. The trend moves the same as the previous then, it will touch the following targets 0.7390 - 0.7422 .
But if we analyze the trend, it's trying to break the minor support. RSI also shows the downtrend. So, if it falls, the trend will reach the following targets 0.7340 - 0.7324 .

Is Aussie ready for a breakout ?Click the link in the "Yellow circle" to see the previous forecasts
As long as if it rejects the upper "white line," I reckon AUD will fall to the target, which could be below depends on the fundamental. Keep in mind; there are a few minor support in between.
This analysis fails if the candle breakout and close above the upper "white line."
Catalyst:
- AUD PMI
- US Flash Manufacturing PMI
- US CB Consumer Confidence
- AUD Construction Work Done
- US Prelim GDP
- US Unemployment Claims
- US Consumer sentiment
- FOMC
- AUD Private Capital Expenditure
- Covid-19 breaking news

AUDUSD | Perspective for the new weekIt has really been a while since I visited this pair but the current structure appears to be promising as I see a defiant level packed with selling pressure @ $0.73400.
The AUD/USD pair has continued in a predictive pattern with a second consecutive week in a tight 100 pips’ range since hitting its highest level in recent times @ $0.73400. Despite rallying during the trading session on Friday, we are still stuck in the same range giving the impression that Buyers at this juncture lack the momentum to push the price above its previous high @ $0.73400 hereby opening a window for a counter-trend possibility.
Tendency: Downtrend ( Bearish )
Structure: Channel | Reversal pattern | Supply & Demand | Trendline
Observation: i. Despite structure screaming "Bullish!", we might be in for a correction phase this week in anticipation of a rally continuation.
ii. $0.73400 level has been respected since the beginning of this month at six different occasions making this a strong Supply zone.
ii. A sharp rejection of $0.73200 level on Friday despite a rally insinuates there might be a Breakdown of Trendline in the coming week.
iii. With the high expectation of a Trendline breakdown @ $0.72700, I shall be keeping tabs on my Demand area @ $0.72200 for a significant Breakdown which shall confirm Correction of the Impulse leg.
Trading plan: SELL confirmation with a minimum potential profit of 200 pips.
Risk/Reward: 1:5
Potential Duration: 5 to 10 days
NB: This speculation can be considered to make decisions on lower timeframes.
Watch this space for updates as price action is been monitored.
Risk Disclaimer:
Margin trading in the foreign exchange market (including foreign exchange trading, CFDs, etc.) has a high risk and is not suitable for all investors. The content of this speculation (including all data) is organized and published by me for the sole purpose of education and assistance in making independent investment decisions. All information herein is for your reference only and I take no responsibility.
You are hereby advised to carefully consider your investment experience, financial situation, investment objective, risk tolerance level, and consult your independent financial adviser as to the suitability of your situation prior to making any investment.
I do not guarantee its accuracy and is not liable for any loss or damage which may result directly or indirectly from such content or the receipt of any instruction or notification therewith.
Past performance is not necessarily indicative of future results.

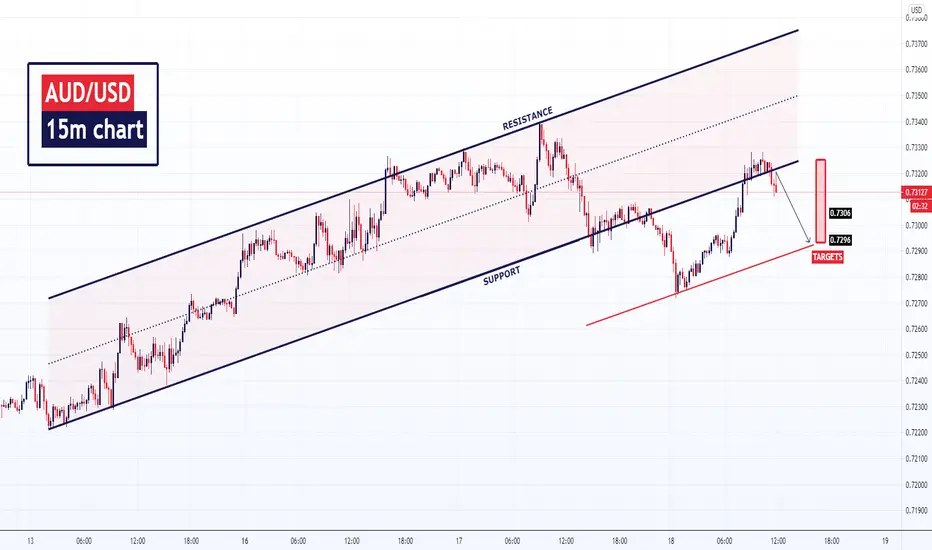
AUD/USD is moving downwardAUD/USD is indicating a fall right now. The trend crosses the support trendline, and it will touch the following targets 0.7306 - 0.7296 . Overall it's an uptrend. After a fall of short period, there will be a continuation of the uptrend.