Audusdtrade

AUDUSD SHORT FOR Risk : reward of 1:3
As per the Daily chart we clearly see that Price has violated Demand Zones and we have a Fresh Daily Supply Zone formed, Price is aleady coming from a Monthly Supply in the higher timeframes and hence the Target is a Monthly Demand formed at 0.65512.
Once Price violates a Demand in lower timeframes like 1H and 4H we will have another trade with an amazing Risk: Reward ratio. But for now 1:3 is also a considerable Risk to reward ratio hence shorting.
Happy Money Making !!!

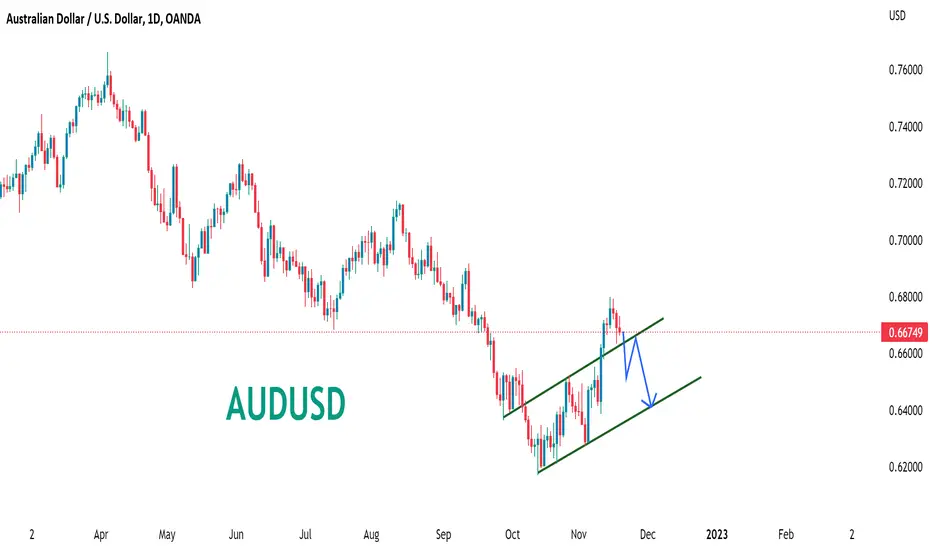
AUDUSD Will Fall! AUD-USD broke out of the rising wedge
And the breakout is confirmed
So after the pullback and retest
I will be expecting a move down

AUDUSD - CURRENT SITUATION AND FUNDA & TECHNICAL BIAS#AUDUSD
- Currently the MARKET SENTIMENT for AUD is slightly UP SIDE according to the MARKET SENTIMENT. Due to RISK ON for AUDUSD, there is currently an UPSIDE BIAS for it.
AUD CASH RATE is about to be released. And the USD has become STRONG in the short term. Therefore, STOCKS and COMMODITIES MARKETS are going up a bit now. It is heavily influenced by the Australian dollar. And the AUSTRALIA INFLATION DATA was very POSITIVE that day. Due to this, the RBA made a RATE HIKE.
- The FED MEETING is scheduled to be held today. So be careful while trading USD CROSS PAIRS.
- It is definitely possible to break the AUDUSD STRUCTURE and go up to the higher RESISTANCE LEVEL. Accordingly, AUDUSD can go up to 0.7100 0EVEL. After that, if the MARKET RISK OFF, AUDUSD can SELL to the AUDUSD 0.6723 LEVEL if the MARKET SENTIMENT changes and STOCKS and COMMODITIES start to fall further. For that, the MARKET STRUCTURE should be BREAK. And RISK should be OFF. audusd

AUDUSDHi traders, watch AUDUSD with your own according strategy and look for a short position opportunity for a short term trade setup GOOD LUCK.

AUDUSD Breakout Long!AUD-USD is trading in an uptrend
And the pair has formed a bullish pennant
we saw a breakout From the flag to the upside
So we are now bullish biased
And I think the price will go up

AUDUSD SELLAUDUSD loose its strength on Friday and in other hand Dollar Currency Index takes strength. I believe AUDUSD will fall more.
🔴 AUDUSD - 4H (08.11.2022)🔴 AUDUSD
TF: 4H
Side: Short
SL: $0.64907
TP 1: $0.64391
TP 2: $0.64072
TP 3: $0.63814
AUDUSD is due for a correction. We short 4H until the correction is over and then long again.

AUDUSD LongThe AUDUSD pair first will fall then it will take buy setup by taking support. Better to wait for the support zone to buy it.

AUDUSD Resistance Cluster! AUD-USD is trading in a downtrend
And the pair is going up now
In a bullish correction
But after the price hits the
Resistance cluster I would be
Expecting a move down
Towards the target below

AUDUSD - CURRENT SITUATION AND FUNDA & TECHNICAL BIAS#AUDUSD
- Currently the MARKET SENTIMENT for AUD is slightly UP SIDE according to the MARKET SENTIMENT. Due to RISK ON for AUDUSD, there is currently an UPSIDE BIAS for it. The main reason for that is that the US ELECTION was won by the REPUBLICANS and the US CPI DATA is NEGATIVE. Therefore, STOCKS and COMMODITIES MARKETS are going up a bit now. It is heavily influenced by the Australian dollar. And the AUSTRALIA INFLATION DATA was very POSITIVE that day. Due to this, the RBA made a RATE HIKE.
- It is definitely possible to break the AUDUSD STRUCTURE and go up to the higher RESISTANCE LEVEL. Accordingly, AUDUSD can go up to the 0.6850 level. And before that, AUDUSD can SELL to the 0.6447 LEVEL if the MARKET SENTIMENT changes and STOCKS and COMMODITIES start going down. For that, the MARKET STRUCTURE should be BREAK. And RISK should be OFF.

AUD/USD Short Term SELL ....AronnoFX will not accept any liability for loss or damage as a result of
reliance on the information contained within this channel including
data, quotes, charts and buy/sell signals.
If you like this idea, do not forget to support with a like and follow.
Traders, if you like this idea or have your own opinion about it,
write in the comments. I will be glad.

AUDUSD RE-ENTRY R:R 1:18This is for Long Term
And this is risky too.
Enter form the Marked Area.
Please DYOR before entering the trade.

🎁BUY AUDUSD at the best place and price🚀🔰You can see the analysis of Australian dollar to US dollar in one hour time frame (AUDUSD_ 1H) 🔍🧨
💥Considering that the price was able to break the Down trend line🖤 and pullback🧡 to it three times, and also considering the price movement in a bullish parallel channel💜, if the price can reach the DEMAND zone, it can experience an increase up to the SUPPLY1 zone🚀🔺
Do you think this analysis can be profitable❓
I hope the analysis was useful for you🤍🌹
_______📈TRADER STREET📉_______

AUDUSD is in sell zone!!AUDUSD 4h has formed a strong bearish price action after multiple liquidity grab, the price has started to drop from the resistance. Also on the 4h, the price formed a reversal pattern which is broken and now the price is rejected to the downside with a retest of the previous support turned resistance. As the long-term price is bearish, upon candle close we may have the opportunity to sell AUDUSD!
Press the like button if you enjoy this content :)

AUDUSD Wyckoff Ccumulation # 1 and forming Bat Pattern on 4H TfAUDUSD Wyckoff Ccumulation Schematic # 1 Found on 4 Hour timeframe
same time Timeframe
AUDUSD is forming BAT Pattern (harmonic) ..4 hr timeframe
Not a financial advice just for learning Purpose
like follow for my profile support thanks

AUDUSD Bearish Breakout! AUD-USD broke out of the bearish wedge
Reinforcing our bearish bias on the pair
And making us expect a further
Bearish move down
after retest horizontal resistance at 0.64016

AUDUSDAUD looks bearish in terms of dollar, we have seen from the past few weeks dollar getting stronger. Now AUD is reaching towards the weekly support which is near 0.61020. Meanwhile we are bearish on Australian Dollar.

AUDUSD Will it Raise?This is for short term
And this is risky too.
Please DYOR before entering the trade.

AUDUSD top-down analysisHello traders, this is a complete multiple timeframe analysis of this pair. We see could find significant trading opportunities as per analysis upon price action confirmation we may take this trade. Smash the like button if you find value in this analysis and drop a comment if you have any questions or let me know which pair to cover in my next analysis.

AUDUSD Risky Long! AUD-USD is trading in a falling channel
And the husband re-tests Channel support level at 0.65073
I think it's followed by a bounce from existing areas
By the bullish correction is possible
So we will be waiting for the reversal signs
To be able to enter a long trade BUY

AUDUSD FOMC update!!
Hello traders, on FOMC we could see a significant movement on AUDUSD.
this is complete multiple timeframe analysis of this pair. We see could find significant trading opportunity as per analysis upon price action confirmation we may take this trade. Smash the like button if you find value in this analysis and drop a comment if you have any questions or let me know which pair to cover in my next analysis.

AUDUSD Idea H4Here is my view for AUDUSD on H4. The price could go down, you can put a pending order on the Order block or find an entry on LTF within OB Zone. Trade Safe!
