AUDUSD: Sell The Rip!Welcome back to the Weekly Forex Forecast for the week of July 21-25th.
In this video, we will analyze the following FX market:
AUDUSD
AUDUSD has been difficult to trade, as it chops its slow grind upwards. Last week it gave a bearish close. With the USD expected to continue to gain strength, look for sells directed to the liquidity lows in AUDUSD.
Enjoy!
May profits be upon you.
Leave any questions or comments in the comment section.
I appreciate any feedback from my viewers!
Like and/or subscribe if you want more accurate analysis.
Thank you so much!
Disclaimer:
I do not provide personal investment advice and I am not a qualified licensed investment advisor.
All information found here, including any ideas, opinions, views, predictions, forecasts, commentaries, suggestions, expressed or implied herein, are for informational, entertainment or educational purposes only and should not be construed as personal investment advice. While the information provided is believed to be accurate, it may include errors or inaccuracies.
I will not and cannot be held liable for any actions you take as a result of anything you read here.
Conduct your own due diligence, or consult a licensed financial advisor or broker before making any and all investment decisions. Any investments, trades, speculations, or decisions made on the basis of any information found on this channel, expressed or implied herein, are committed at your own risk, financial or otherwise.
Aussiedollar

AUDUSD Cautiously Bullish As US PI Data Looms This is the Weekly FOREX Forecast for the week of July 14 - 18th.
In this video, we will analyze the following FX market: AUDUSD
The AUDUSD has been grinding higher for weeks. Only Friday closed with a hint of a pullback starting. The RBA is looking for the US CPI Data to post. If the inflation numbers are a bit hot, this will strengthen the USD against the AUD. A soft CPI should see the market pricing back in higher chances of a third cut by year-end and weigh on the US dollar.
We'll see how the market reacts on Tuesday.
Enjoy!
May profits be upon you.
Leave any questions or comments in the comment section.
I appreciate any feedback from my viewers!
Like and/or subscribe if you want more accurate analysis.
Thank you so much!
Disclaimer:
I do not provide personal investment advice and I am not a qualified licensed investment advisor.
All information found here, including any ideas, opinions, views, predictions, forecasts, commentaries, suggestions, expressed or implied herein, are for informational, entertainment or educational purposes only and should not be construed as personal investment advice. While the information provided is believed to be accurate, it may include errors or inaccuracies.
I will not and cannot be held liable for any actions you take as a result of anything you read here.
Conduct your own due diligence, or consult a licensed financial advisor or broker before making any and all investment decisions. Any investments, trades, speculations, or decisions made on the basis of any information found on this channel, expressed or implied herein, are committed at your own risk, financial or otherwise.

AUSSIE BANK ROBBERY: AUD/USD Bullish Breakout Confirmed!🔥 AUD/USD BANK HEIST: The Ultimate Bullish Robbery Plan (Thief Trading Style) 🔥
🌟 ATTENTION, MONEY MAKERS & MARKET ROBBERS! 🌟
💸 MISSION BRIEF:
Based on Thief Trading Style (technical + fundamental analysis), we’re executing a bullish heist on AUD/USD ("The Aussie")—time to steal those pips like a pro!
📈 ENTRY STRATEGY (The Heist Begins!)
Long Entry Trigger: Wait for Dynamic Resistance MA crossover + candle close above 0.65300 (bullish confirmation).
Pro Tip: Use Buy Stop orders above MA or Buy Limit orders on pullbacks (15m/30m timeframe).
🔔 SET AN ALERT! Don’t miss the breakout—alert up, gloves on!
🛑 STOP LOSS (Protect Your Loot!)
"Yo, rookie! 🗣️ If you’re entering on breakout, DO NOT set SL before confirmation!
📍 Thief SL Placement: Nearest 4H swing low (0.64800)—adjust based on your risk, lot size, & trade multiples.
⚠️ Warning: Deviate at your own peril—your risk, your rules!
🎯 TARGET (Cash Out & Run!)
Take Profit Zone: 0.65800
Scalpers: Long-only plays! Use trailing SL to lock profits.
Swing Traders: Ride the wave—big money moves require patience!
📰 FUNDAMENTAL BACKUP (Know Why We Robbin’!)
Bullish momentum fueled by macro trends, COT data, sentiment shifts.
🚨 Breaking News Alert: Avoid high-impact news spikes—trail SL or stay out!
💥 BOOST THE HEIST!
Hit 👍 LIKE, 🔄 SHARE & 🚀 BOOST—strengthen the robbery squad! More heists = more profits!
🤑 NEXT HEIST COMING SOON… STAY TUNED! 🐱👤

AUDUSD – Bearish Breakdown Below EMA Support🚀👆 Boost it if you like it...👆🚀
Price has broken decisively below the EMA cluster after consolidating in a tight range. The strong bearish candle suggests momentum toward lower support levels.
Trade Plan:
✅ Entry:
Current price ~0.65545
✅ Stop Loss:
Above 0.657722 (last minor swing high)
✅ Target:
0.65340 – 0.6500 area (previous demand and round number support)
Context:
• EMA confluence failure
• Clear bearish momentum candle
• Clean risk-to-reward setup
Risk Management:
Risk per trade: 1%
Hashtags:
#AUDUSD #ForexSignals #PriceAction #Breakdown #MJTrading #TradingIdea #Forex

AUDUSD - Resistance Test Points to Imminent Price CorrectionThe AUD/USD pair has shown impressive upside momentum in recent days, recovering sharply from its early April lows near 0.5900 to now testing the key resistance zone highlighted in blue around 0.6400. After such a substantial rally of approximately 500 pips, technical indicators suggest the pair is becoming overextended in the short term. We anticipate a corrective pullback as price encounters this significant resistance level, which previously acted as support in mid-March. This correction would be a healthy development within the broader market structure, potentially setting up better entry opportunities for those still bullish on the Australian dollar in the medium term.
Disclosure: I am part of Trade Nation's Influencer program and receive a monthly fee for using their TradingView charts in my analysis.

AUDUSD 110 buy setup!!The current market structure shows a strong alignment for a potential upward movement, forming a double bottom at a significant support level. This pattern respects both the structural levels and Fibonacci retracement levels. With important news scheduled for release today at 8 PM, particularly positive developments for the dollar could influence market direction. Given the risk-to-reward ratio, it appears favorable to consider positioning for an upward trend.
follow me for more breakdown

Short Idea - AUDUSDTrade entered. Entry rules met.
Confluences:
✅ Bearish overall bias
✅ Bearish demand zone
✅ Bearish ABCD extension pattern
✅ Bearish divergence
✅ Bearish break of structure
✅ Entering London close zone
✅ Price is in entry zone
✅ Required risk:reward met
⭐ I shared this watch zone in my weekly forex outlook this week, you can subscribe by clicking the link in my bio.
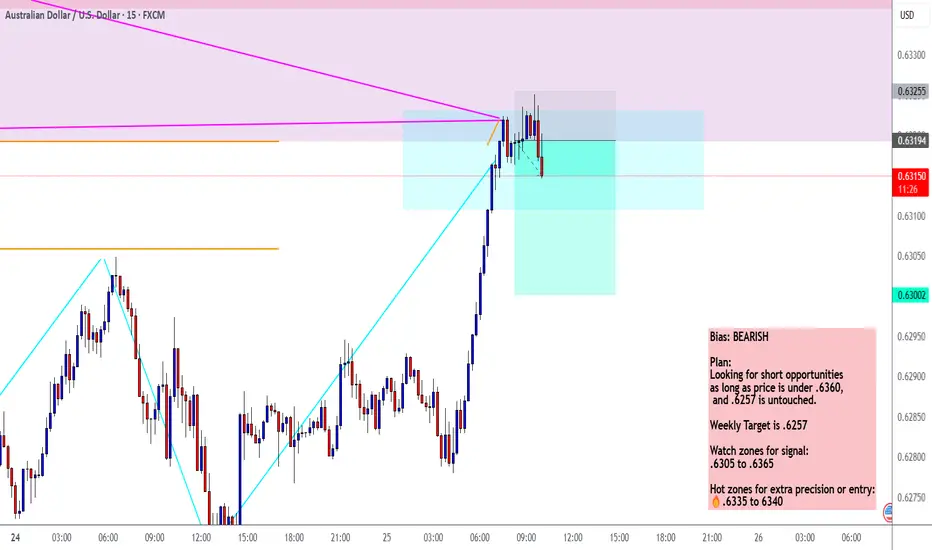
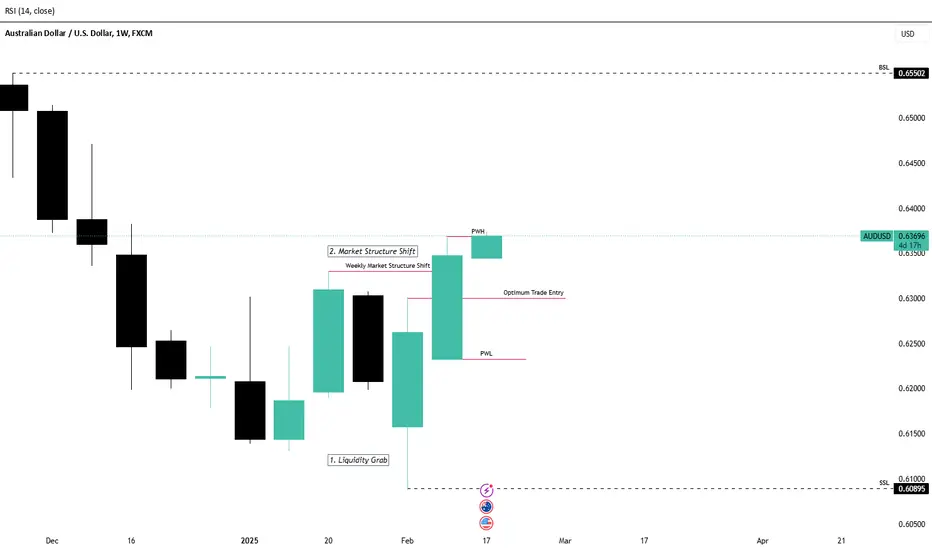
AUDUSD Weekly BiasThis pair is now on a bullish run considering that;
1. We had a liquidity grab at 0.61 Zone.
2. Market Structure Shift at 0.633.
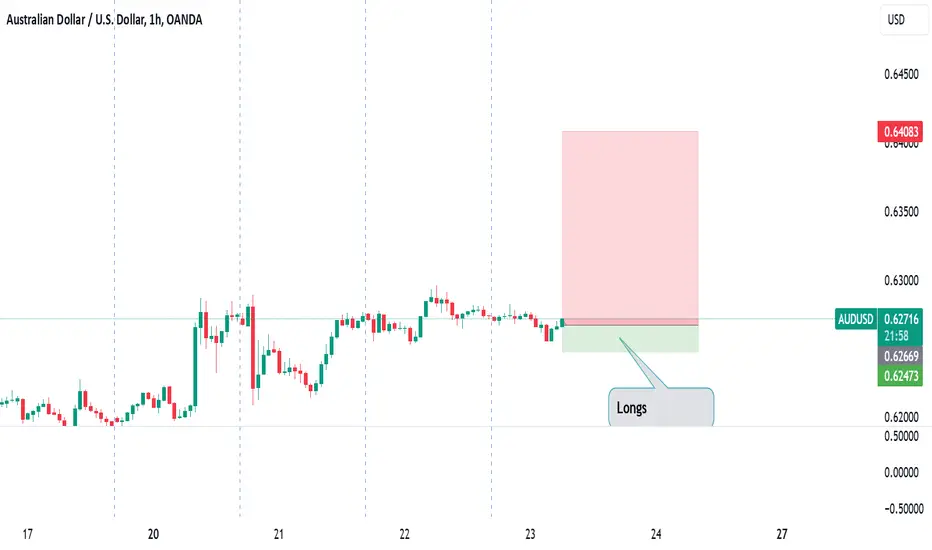
The pair might aim towards the Buyside Liquidity at 0.655 and our entry positions might be around the 0.63 Zone.

AUDUSD Weekly BiasThis pair is now on a bullish run considering that;
1. We had a liquidity grab at 0.61 Zone.
2. Market Structure Shift at 0.633.
The pair might aim towards the Buyside Liquidity at 0.655 and our entry positions might be around the 0.63 Zone.
Will AUDUSD limitedly recover amid mixed views?Macro:
- The aussie-dollar is rebounding after the bearish sentiment over Trump’s tariffs has pressured the currency.
- Expectations are rising that the RBA will cut interest rates this month due to easing inflation and weaker growth prospects.
- This theme may impair currency recovery if there are any further corrections.
Technical:
- AUDUSD is recovering from its swing low around the support at 0.6150. The price forms a potential double-bottom pattern, which may set an upward bias to the currency in the short term.
- If AUDUSD stays above its support at 0.6250, the price may continue to advance to retest at 0.6400, which confluences with the 38.2% level of the Fibonacci Retracement.
- On the contrary, closing below the support at 0.6250, confluence with EMA21 may prompt a retest of the previous swing low of around 0.6140.
Analysis by: Dat Tong, Senior Financial Markets Strategist at Exness

AUDUSD - 4H Why we need to Buy?!The FX:AUDUSD has shown strong bullish momentum after hunting liquidity below the 2022 low on the daily and weekly timeframes.
✅ Breakout & Retest: The pair successfully broke the descending channel's resistance and is now pulling back to the breakout zone, confirming its strength.
✅ Higher High Formation: A higher high structure supports the bullish bias, indicating potential continuation towards previous highs and beyond.
📌 I expect another bullish push from this key support zone.
🔔 Follow for real-time updates!

AUDUSD Long!AUDUSD Long!
Tight stop-loss, staying optimistic on the Aussie dollar long.
Remember to manage your risk diligently!
AUDUSD SHORTI believe the CPI data coming out will not be good news for the AUD. However we will have an initial shot to the bullish side followed by a move to the downside for the rest of the week. All my analysis shows that DXY is ready to pump back to that 111 range.

USDAUD - Aussie to fall 30% against the DXYLet's look at some FX pairs
First up the Aussie
We have a #HVF
@TheCryptoSniper
Already Triggered to the upside approaching target 1 ..
The full Target 3 ... (linear Target) lines up with the high's of peak dollar strength at the turn of the millennium

AUDUSD SHORTbased on the technicals of the 4h and 1h, I would expect this to approach the 0.63000 level once more before falling(asian session). At london open I will be looking for rejection of this level and will begin taking short positions when possible.

Bearish Setup in AUD/USDT: Trendline Support Under PressureAUD/USDT is currently moving in a classical bearish pattern, with the price taking temporary support at the lower trendline.
However, this support appears weak, and it is unlikely to hold for long. A breakdown from this level could lead to further downside momentum.
More bearish movement is expected as the structure remains in favor of sellers.
DYOR, NFA

AUDUSD - Very bearish for the Aussie Dollar!Very bearish for the AUDUSD. The Aussie dollar is coming under pressure.
Breakout from the aqua colored symmetrical triangle to the downside. Note the AUDUSD was already on a secular long term down trend (under the red downtrend line).
Potential price target of red arrow at 55 cents, or worse still the 48 cent target of the early 2000s (green arrow).

AUDUSDAt 0.63 we have a weekly strong support, just be careful for a reversal there at that area. I still believe that the US dollar is strengthening, so we might see more downside.

AUDUSDAt 0.63 we have a weekly strong support, just be careful for a reversal there at that area. I still believe that the US dollar is strengthening, so we might see more downside.

AUDUSD ShortAUD/USD remains in a bearish trend, with recent price action aligning with technical and fundamental signals. Traders are watching US PPI data today for potential market-moving insights.
Technical Setup
Using Smart Money Concepts (SMC) and Fibonacci retracement, the 0.71–0.79 Fibonacci zone stands out as a key resistance level, supported by a Fair Value Gap (FVG) from the last swing high. Price is testing the 50% Fibonacci level, creating an opportunity for a short trade.
Trade Plan
Entry: 0.7120 (near the 0.75 Fibonacci level).
Stop Loss: 0.64729 (above the 0.79 Fibonacci level for risk protection).
Take Profit: 0.63378 (targeting below the Fair Value Gap for a clean exit).
Risk/Reward Insights
This setup offers a Risk/Reward Ratio of 1:3, with a risk of 64.7 pips to potentially gain 192.1 pips.
Disclaimer
Trading involves significant risk. Always trade with a clear plan, implement stop-loss orders, and never risk more than you can afford to lose. This analysis is not financial advice—trade responsibly and stay informed.
Follow for more actionable trading insights and strategies!

AUD/JPY Clear breakthrough, trend trading.Hi guys, we are coming up with yet another fantastic opportunity, which we will express our attention onto Resistance and Support line. The AUD/JPY has been trading in a very tight range since the beginning of October up until now. There is an extremely strong resistance line which has been physically broken once sitting above the level of 101.700 , in between that time the pair has been trading just below the Resistance of 101.600 to it's lower end at the support of 99.778. For now my analysis would be targeting the lower end of 99.700 to 99.800 level and then for us to see another retest towards the two goals which I have set up as follows
As a pending order - BUY LIMIT at level of 99.778 with following take profits -
Take profit 1 : 101.161
Take profit 2 : 101.673
Enjoy this fantastic analysis which has brought me a lot of success the past two months, hence the fact that it was trading in a very obvious range and allowed for very easy entries to follow up and catch quite a few good pips of movement.

AU Index Rallies from Demand Area as Bullish Sentiment GrowsThe AU Index experienced a significant development yesterday as it reached a key demand area, showing a strong rejection today that indicates potential bullish momentum. This demand zone, identified through technical analysis, has historically served as a pivotal point for price action, suggesting an opportunity for a price turnaround. With the opening candle reflecting a robust rejection of lower levels, traders are increasingly optimistic about the possibility of a bullish trend emerging in the coming months.
From a technical standpoint, this demand area presents a solid foundation for potential upward movement. The absence of follow-through selling and the strength of the rejection signal that buyers are stepping in to support the price. When coupled with historical seasonality patterns, which indicate a likelihood of gains during this period, there is a compelling case for a bullish outlook on the AU Index. Historical trends suggest that this time frame has often led to price rallies, providing further confirmation for those considering long positions.
On the fundamental side, the insights from the Commitment of Traders (COT) report paint an interesting picture. While retail traders are predominantly bearish, indicating a cautious sentiment among the broader market participants, the smart money narrative tells a different story. Institutional investors appear to be either bullish or in the early stages of building long positions, which can be a telling signal for future price action. This divergence between retail bearishness and institutional buying often creates an environment ripe for a market reversal, particularly as the smart money tends to lead rather than follow market trends.
Given these dynamics, traders are now on the lookout for a long setup on the AU Index. Emphasizing risk management and entry strategies will be essential in this endeavor. With the price showing resilience at the demand area and fundamental signals suggesting a shift towards bullishness, there is a growing confidence that the AU Index may be poised for a sustained rally.
In conclusion, the confluence of technical indicators, seasonal patterns, and the contrasting sentiments present in the COT report presents an enticing opportunity in the AU Index. As traders position themselves for potential gains, the next few sessions will be crucial in determining whether this demand area will indeed act as a launchpad for a bullish trend in the months ahead. Investors will be closely monitoring price movements, looking for confirmation to validate their long strategies in what could be an exciting period for this index.
✅ Please share your thoughts about AU in the comments section below and HIT LIKE if you appreciate my analysis. Don't forget to FOLLOW ME; you will help us a lot with this small contribution.
