Aud/usd sell setup weekly forecast Hello traders aus/usd is in rally up to get the liquidity then we probably will have a nice sell setup on our order block to get to those bisi fvg and thin liquidity area it is 1 to 2.5 RR very good setup it can take a little bit longer can be short term swing trade let me know what think
Aussiedollar

AUDUSD Rising LONGOn the 4H chart, AUDUSD is rising over the intermediate term volume profile POC and ascending the anchorded
VWAP bands as well; Price rose from undervalued to fair-valued on the VWAP bands.
The Chris Moody RSI indicator flashed a a pair of buy signals and RSI rose over the 50% line.
Another good sign is price is approaching a volume void /gap on the volume profile. Finally
there was a mild volume spike when price reversed from the bottom of the high volume area on
the profile. I am looking for rising price action in the intraday upcoming once both London
and New York sessions are overlapping.


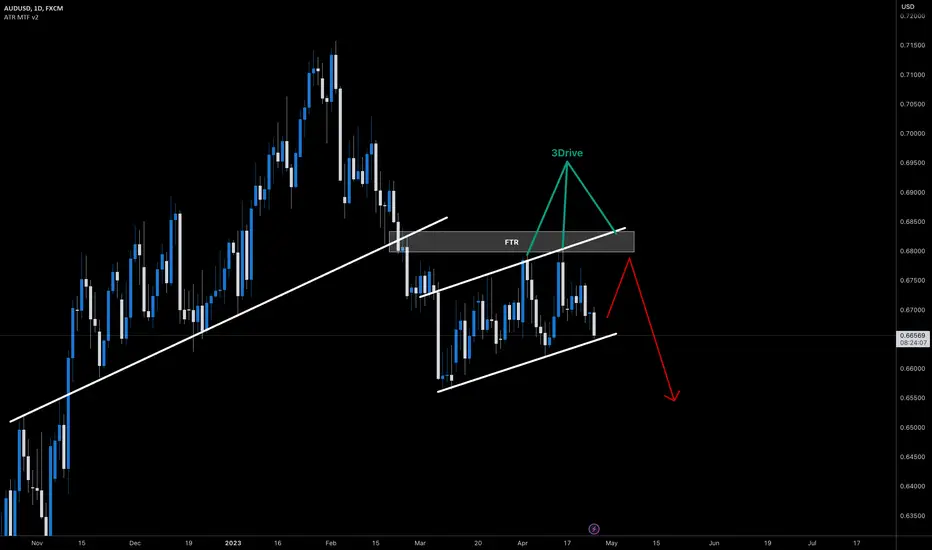
AUDUSD 4H AnalysisHey traders, we have bullish trendline + FTC Level + ABCD Pattern. Bullish movement as a third drive of 3D Pattern

AUD/CHF could be headed for the April 2020 lowAUD/CHF is within an established downtrend on the daily chart, and the current dynamics present a divergent theme which could send it lower from here.
Yesterday closed with a bearish engulfing candle at its lowest level since April 2020. The moving average remain 'within order' and fanning out, and the 10-day EMA is now capping as resistance as prices try to accelerate away from the averages. The monthly S1 pivot sits around 0.5975 and the RSI is oversold, so we may see a period of consolidation or minor rebound from S1. But the bias remains bearish below 0.6100 and for an eventual move towards the April 2020 low.

AUDUSD - Support area provides a buying opportunityConsidering lower NFP data on Friday, the odds on FED pause seem to be a bit increased even though it was not quite reflected on the FEDwatch tool. However, taking the holiday into account it is not that surprising to see such a low volume happen on the NFP data release. Thus, an indecision candle formed right at the support area.
This could pose a nice opportunity to either buy or sell the market as the guide is quite simple. Price breaks and closes above Friday high means buy opportunity, and the opposite also applies.
But since I am a dollar bear for now, I think I would prefer to do the buying instead of selling.
Entry: Above Friday's high
Stop: Below Friday's low
Target 1: Bullish engulfing candle high
Target 2: Daily resistance (blue box)

AUD/JPY - Tight RangeOANDA:AUDJPY
Tight range for this pair.
Started to watch this late yesterday and early into todays FX sessions as maybe, just maybe the Aussie's and Japanese market makers would make some moves before the holiday weekend as there were first up in line.
Didn't happen, tight range under 70 pips for most of the major pairs.
AJ couldn't break below this support area all night/morning long
Trade Smart
Trade well

AUD/JPY - Not BadOANDA:AUDJPY
These moves looking good, not bad not bad.
Safe entries for scalps.
Trade the trend until someone else breaks it.

AUDUSDhey everyone, the aususd pair is making a new uptrend... the price is currently above the 20&50ma... so we will likely see more bull moves...
0.67710 is the main resistance for now... it currently breaking this resistance... the previous high was 0.6782 so the next high could reach 0.68260 as shown in price chart... if more bullish then 0.68693
BE careful trading around news hour because price can fluctuate massively ...
good luck

EURAUD Long EODEuro Inflation data out this week, as well as the Aussie CPI.
From TD Securities, talking about the Euro HICP:
Softer energy inflation likely continued to weigh on headline inflation in the EZ. That
said, on a m/m basis, energy inflation likely stayed resilient, in part as subsidized
prices won't have declined by as much as wholesale prices. Core will be the main
focus though, and another strong print will add more pressure on the ECB to keep
hiking in 50bps clips after Mar.
Wednesday, March 1st, watch out for a drop in the Australian headline inflation data!

EUR/AUD Long-Term Idea 💡 EUR/AUD has been in an overall downtrend for weeks but has recently broken that trend line. I have condensed down to the 12hr chart to show both short and long term possibilities using a mixture of the dow Jones theory with market structure and fibonacci. It is still possible to see price push lower but in the events of a new uptrend, this is what I would expect to see according to confluence. Orange cycle is the lower time frame elliot wave which should form the larger time frame green cycle following the new uptrend. Green dashed line is the 1.382/1.618/2.0 fibonacci levels of cycle 1 completion highlighted. (Turquoise rectangle is 0.618 of cycle 1). Harmonic patterns are usually located in the correction for a trend continuation however i have not highlighted these for a cleaner chart. This is only a speculation, not to be considered as financial advice. Any positions taken should be done by your own discretion.

AUD/USD downside risk remains AUD/USD
Bearish price trend remains after the break below the 0.6630 key support level. Downside prospects for a further push lower towards 0.65 and perhaps even 0.64 as extension. Upside risk for short sellers seen above 0.6790.

AUDJPY - Finally Got it on This AJ pairOANDA:AUDJPY
Slow morning AGAIN during NYSE session on the currencies.
Thinking about adjusting my hours and watch Asian into London close action.
Got my hard 10pips short.
Slow morning, and brought my entry chart a bit lower to close it if price action went against me
Trade well

AUD/USD - Kangaroo ScalpOANDA:AUDUSD
The Aussie went down under against the US Dollar for a bit.
So took a scalp of 5pips, yes thats a small 5pip hard TP.
Price action moves 5pips up/down, and any given hour, ANY.
Do the math, Rinse and Repeat...
Trade smart
Trade well

AUD/CHF - I got a little slap on this one earlierOANDA:AUDCHF
Not sure why I took this one before my USD/JPY I posted earlier.
Entry was good, 3 times flirted around my hard TP 10pips around 8-9.5pips, but did not get filled.
Held on too long, stopped out, didn't get hurt though, all is good.
Cant win them all.
Trade management is keeping me alive and in this game.
Trade well

AUD/CHF Why Not?OANDA:AUDCHF
Sure, why not trade something I don't normally look at.
I have to start with this pair at some point.
After a couple of close TP misses prior/during the recent Asian session, took a short on the Aussie Swissy heading into a round number before NYSE open.
After the opening bell, it slowly chopped and hit my hard 10pip TP, right before the small whiplash "Pending Home Sales" USA release 10:00 am est (UTC-5).
My trades are not huge pip amounts, but consistency wins the race.
Think rabbit and the tortoise, and the amount of lots on each of my positions.
Trade well

AUD/USD long tradeWe enter a strong zone of support, this might give us some strength to go higher.
Short term, long trade. It also looks like we forgot to fill some short orders at the last down push.
Let's try to get these ;-)

AUDCAD ideaFX:AUDCAD
I'm waiting to see a reaction from the buyers
here is my approach on this.
kindly let me know your thought in the comment session

AW Aussie Dollar Analysis - Wave 2 Correction Incoming...Now that I have updated the analysis for the bigger picture, we have a better understanding of the overall structure.
That means I will continue to maintain the bullish view unless proven otherwise.
At the smaller degree we are looking for the start of Wave 2.
We may or may not have topped out so I will be paying close attention at the open.
The first expected move down will be Wave A so a strong impulsive move down will be expected.
From there we should be able to gauge further short-term trading opportunities throughout the corrective process.
Remember to use Disciplined Money Management Principles to ensure longevity as a trader.
If you don't know the long term pattern shouldn't you be doing your research instead of just following the crowd?
Just remember: I am not a financial adviser; I suggest using this only as a guide. Always do your own research.
***AriasWave is not the same as Elliott Wave so your counts may differ to mine if you happen to use it.***


AUDUSD SHORT TRADE EXPLAINED4H Timeframe:
Drop down to 1H to refine entry:
SL & TP:
AFTER:
RRR = 1:3

Joe Gun2Head Trade - AUDUSD looks ready to correctTrade Idea: Selling AUDUSD
Reasoning: Rallied into major resistance on the dialy chart. Smnall top on the 60min chart.
Entry Level: 0.7069
Take Profit Level: 0.6906
Stop Loss: 0.7122
Risk/Reward: 3.3:1
Disclaimer – Signal Centre. Please be reminded – you alone are responsible for your trading – both gains and losses. There is a very high degree of risk involved in trading. The technical analysis , like all indicators, strategies, columns, articles and other features accessible on/though this site is for informational purposes only and should not be construed as investment advice by you. Your use of the technical analysis , as would also your use of all mentioned indicators, strategies, columns, articles and all other features, is entirely at your own risk and it is your sole responsibility to evaluate the accuracy, completeness and usefulness (including suitability) of the information. You should assess the risk of any trade with your financial adviser and make your own independent decision(s) regarding any tradable products which may be the subject matter of the technical analysis or any of the said indicators, strategies, columns, articles and all other features.
