Trading the July RBA decision The Reserve Bank of Australia (RBA) will deliver its latest policy decision on Tuesday, 9 July. Markets are heavily positioned for a 25-basis point cut, which would bring the official cash rate down to 3.60%.
Major Australian banks including CBA, Westpac, NAB and ANZ are aligned in expecting a cut this month, with some anticipating further easing in August and November. A confirmed cut paired with dovish guidance could place further downside pressure on the Australian dollar, particularly against the US dollar and Japanese yen.
AUD/USD remains capped below the 0.6580–0.6600 region, with repeated rejections suggesting strong overhead resistance. A break above this zone would be needed to shift momentum higher. Conversely, a confirmed break below 0.6520 could open a move toward the 0.6450 area. Meanwhile, AUD/JPY has rebounded firmly off its May lows and is now testing resistance near 95.30. This area has repeatedly capped upside since mid-June, making it a key level to watch into the RBA decision.
Australia

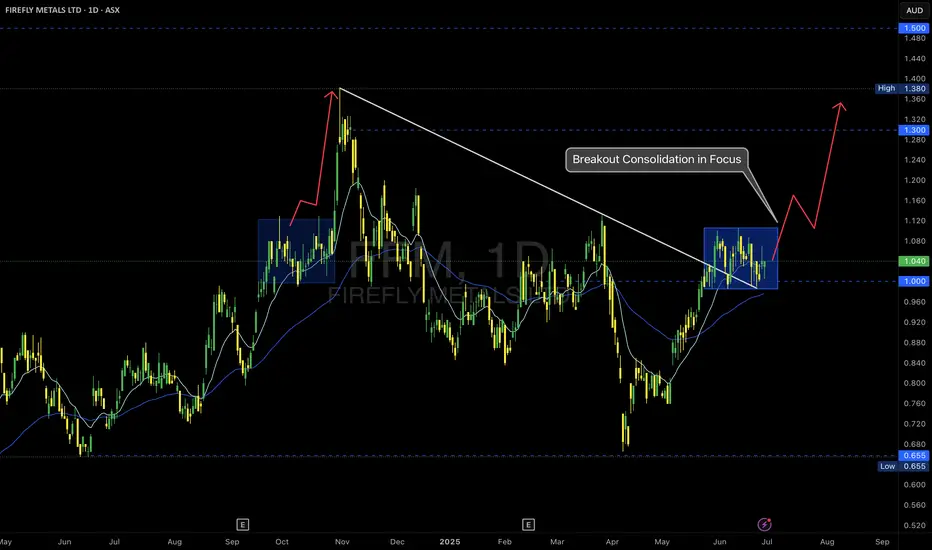
FFM -- ASX – Breakout Consolidation in Focus
📝 Description
Firefly Metals is setting up a classic breakout continuation scenario after reclaiming the $1.00 psychological level and breaking the long-term trendline resistance.
🔹 Key Observations:
• Trendline Break: The descending trendline from the prior high was decisively breached, signaling a structural shift.
• Accumulation Zone: Price has consolidated in a tight range above $1.00, forming a bullish flag or box accumulation.
• EMA Cluster Support: Both the 15 and 60 EMAs are aligned below the consolidation, providing dynamic support.
🔹 Potential Scenarios:
✅ Bullish Continuation:
A clean breakout above the top of the blue box could trigger a momentum rally toward $1.30 and ultimately the $1.38–$1.50 resistance levels.
✅ Deeper Pullback:
If price loses the $1.00 support decisively, a retracement to retest the breakout base is possible.
Trade Plan:
I am monitoring for a confirmed breakout candle with volume expansion to validate the continuation thesis.
• Entry trigger above the range high ($1.10 area)
• Stops below recent swing low / $1.00 level
• First target: $1.30 resistance
As always, risk management first—no breakout, no trade.
#MJTrading
#FFM #FireflyMetals #ASXTrading #BreakoutSetup #TechnicalAnalysis #PriceAction #TradingPlan #ChartOfTheDay #AustralianStocks #MomentumTrading #MJTrading
AUD/USD: The Rebound TradeThe Australian dollar (also known as the Aussie Battler) looks set to continue its recent bounce. Inflation is now under control and monetary easing will continue to support aggregate demand across the economy. While rate cuts are dovish, the underlying economy is still strong and, as we will explain below, the fiscal situation is shaping up better than expected. Stability is in.
The real action, though, is in the US. Unemployment is creeping up. Jobless claims are ticking higher. Existing home sales are falling. The US consumer is feeling the pinch. That puts pressure on the Fed. Rate cuts are back in the conversation. Markets are already pricing in the first move later this year. The US dollar is losing its grip.
AUD/USD recently tested its 200 day moving average and held firm. That’s more than just a technical level. It’s a psychological line in the sand. The Aussie held its ground.
There’s more. Australia’s fiscal position is likely to come in stronger than expected. Mining exports are holding up. Volumes are rising. That supports the budget bottom line and underpins the Aussie’s credibility as a resource backed currency. This is in stark contrast to most of the developed world, where peers are running large deficits.
This isn’t just about central banks. The global economy is shifting gears. China is stabilising. Industrial demand is returning. Commodity prices are finding a floor. That’s key for the Aussie. It’s still a commodity linked currency. As iron ore and copper pick up, the AUD should follow.
There’s a window here. Over the next twelve months, the AUD has room to move higher, testing the 0.7000 range. Not because Australia is booming, but also because the US is slowing. The Fed is running out of steam. That flips the dynamic. We’re moving from USD strength to USD softness.
The setup is clear. A soft landing in the US. A stable China. Commodities firming. And an RBA on hold. That’s a cocktail for AUD strength.
The bounce has just begun.
The forecasts provided herein are intended for informational purposes only and should not be construed as guarantees of future performance. This is an example only to enhance a consumer's understanding of the strategy being described above and is not to be taken as Blueberry Markets providing personal advice.

AUD/USD $AUDUSD update M1 D1 H4 - NO shorts in 2025Monthly SFP + Weakness of the main currency
Forget about short positions for the next year
This might be the best entry point for long of the year
H4
Without closing the imbalance, they shouldn't go up, so I expect such a scenario
Based on all the data, I expect a local strengthening of the dollar in May and only growth after that
Best regards, EXCAVO
_____________________
Disclosure: I am part of Trade Nation's Influencer program and receive a monthly fee for using their TradingView charts in my analysis.

Why the RBA should cut rates todayThe Reserve Bank of Australia should cut rates today, argues James Glynn in the Wall Street Journal .
Markets, however, expect the central bank to wait until May for its next move. RBA Governor Michele Bullock remains cautious, citing lingering inflation.
But Glynn contends that global uncertainty now outweighs the RBA’s desire to wait for marginal improvements in inflation data. That uncertainty is set to escalate this Wednesday, with the Trump administration announcing sweeping tariffs on U.S. trading partners—likely triggering retaliatory measures.
Andrew Boak, chief economist at Goldman Sachs Australia, appears to support Glynn’s view: “There are costs to waiting until May to cut. Waiting is not always a virtue.”
Is Glynn simply chasing a contrarian headline or is there actually a possibility the RBA could act today?

The RBA just cut by 25bp: Instant ViewThe RBA have just cut their cash rate for the first time since late 2020. Using their monetary policy statement and updated forecast, I provide my instant high-level view of what this could mean fir future policy - with an update to my AUD/USD outlook thrown in for good measure.
Matt Simpson, Market Analyst at City Index and Forex.com

ASX 200: Why I don't trust today's 'record high'The ASX 200 reached a record high in today's session, but it's not a convincing record high in my books. If anything, it could signal yet another false break. Using the ASX cash and futures market alongside Wall Street indices, I delve into why we need to be on guard for another bull trap before the real move potentially begins.
Matt Simpson, Market Analyst at City Index and Forex.com

AUDUSD - 4H Why we need to Buy?!The FX:AUDUSD has shown strong bullish momentum after hunting liquidity below the 2022 low on the daily and weekly timeframes.
✅ Breakout & Retest: The pair successfully broke the descending channel's resistance and is now pulling back to the breakout zone, confirming its strength.
✅ Higher High Formation: A higher high structure supports the bullish bias, indicating potential continuation towards previous highs and beyond.
📌 I expect another bullish push from this key support zone.
🔔 Follow for real-time updates!

EURAUDFor EURAUD I expect buys to the ray line above that will fill the wick seen on the daily. There is also a probability that price might come for a third touch on the trendline below before the buys happen.

AUDCAD SHORTPrice as it is on AUDCAD is expected to form a continuation pattern and continue its sell. However it is important to note that price might still go upwards for a third touch contact or an arc formation to sell.

ASX dragged lower by the DowThe Dow Jones futures market fell for an 8th consecutive day on Monday, a bearish sequence not seen in over 12 years. And that's not good news for ASX 200 bulls, as the index tends to track the Dow very closely.
The daily chart looks like it wants to head to 8200, and it just 1 - 2 bearish trading days away from it looking at a typical day's range. The 1-hour trend has favoured bearish swing traders, who could seek to fade into moves towards the 20-50 hour EMAs.

The RBA just made a small (but big) change to their statementThe RBA held rates at 4.35% as expected, but there were several changes to their December statement which warrant a closer look. I highlight the key differences to the November statement and provide my interpretation of what it means for the RBA's policy as we head into next year, then look at AUD/USD.
MS

Key Observations on Xero's Journey🔰 ASX:XRO Key Observations on Xero's Journey
1. The Big Rally: June 2018 to February 2021
Growth: Xero experienced a significant rally, climbing 243% from around $46 to $158.
Timeframe: The rally spanned 126 weeks (882 days).
Volume: Total trading volume during this period was 361.303 million.
Key Insight: This rally followed a long consolidation phase, a typical setup for strong upward momentum in stocks.
2. Support and Resistance Levels
Support Zones:
The $100–$110 range acted as a strong support level, with the stock bouncing multiple times before moving higher.
Resistance Zones:
The $171 level became a key area of resistance during its historical highs.
Key Insight: Understanding historical support and resistance levels can help identify areas where stocks may reverse or consolidate.
🔰 Lessons from Xero's Stock Performance
Patterns Repeat, But Not Predictably
Historical performance offers valuable insights but does not guarantee future results. Always focus on the bigger picture.
Volume Confirms Strength
Rising volume during rallies can be a strong signal of market confidence, while declining volume might indicate weakening momentum.
Support and Resistance Matter
Understanding key price levels can help identify potential turning points in stock movement.
Earnings Drive Volatility
Always pay attention to earnings seasons as they historically trigger significant price movements.
🔰 Conclusion: What Can We Learn?
Xero’s historical data tells a story of growth, retracement, and strong investor interest during key phases. By analysing these patterns, investors can better understand how price, volume, and market cycles interact. However, it’s crucial to remember that past performance is not a predictor of future results.
✅ Join the Discussion
What trends or insights do you observe from Xero’s historical performance? Share your thoughts in the comments below
Disc: no holding , no recommendation to buy or sell - may buy or sell without any notification , treat this post as learning only. consult with your financial advisor before taking any financial decision

AU Index Rallies from Demand Area as Bullish Sentiment GrowsThe AU Index experienced a significant development yesterday as it reached a key demand area, showing a strong rejection today that indicates potential bullish momentum. This demand zone, identified through technical analysis, has historically served as a pivotal point for price action, suggesting an opportunity for a price turnaround. With the opening candle reflecting a robust rejection of lower levels, traders are increasingly optimistic about the possibility of a bullish trend emerging in the coming months.
From a technical standpoint, this demand area presents a solid foundation for potential upward movement. The absence of follow-through selling and the strength of the rejection signal that buyers are stepping in to support the price. When coupled with historical seasonality patterns, which indicate a likelihood of gains during this period, there is a compelling case for a bullish outlook on the AU Index. Historical trends suggest that this time frame has often led to price rallies, providing further confirmation for those considering long positions.
On the fundamental side, the insights from the Commitment of Traders (COT) report paint an interesting picture. While retail traders are predominantly bearish, indicating a cautious sentiment among the broader market participants, the smart money narrative tells a different story. Institutional investors appear to be either bullish or in the early stages of building long positions, which can be a telling signal for future price action. This divergence between retail bearishness and institutional buying often creates an environment ripe for a market reversal, particularly as the smart money tends to lead rather than follow market trends.
Given these dynamics, traders are now on the lookout for a long setup on the AU Index. Emphasizing risk management and entry strategies will be essential in this endeavor. With the price showing resilience at the demand area and fundamental signals suggesting a shift towards bullishness, there is a growing confidence that the AU Index may be poised for a sustained rally.
In conclusion, the confluence of technical indicators, seasonal patterns, and the contrasting sentiments present in the COT report presents an enticing opportunity in the AU Index. As traders position themselves for potential gains, the next few sessions will be crucial in determining whether this demand area will indeed act as a launchpad for a bullish trend in the months ahead. Investors will be closely monitoring price movements, looking for confirmation to validate their long strategies in what could be an exciting period for this index.
✅ Please share your thoughts about AU in the comments section below and HIT LIKE if you appreciate my analysis. Don't forget to FOLLOW ME; you will help us a lot with this small contribution.

ASX to new highs, or fakeout in the making?The ASX 200 futures chart reached a record high on Wednesday, and momentarily traded above 8400. Yet repeatedly we see the market hold above this level (also note the weekly R3 pivot is within the area).
A bearish divergence is forming on the 1-hour chart, so the bias is for a false break of the highs and retracement lower ahead of its next sustained record high.
Bears could seek a move towards the 20-hour or 50-hour EMA, or bulls could wait for such a level to be respected as support before rejoining the bullish trend.
*Take note that AU employment data is released in just over 1hr*
MS

Are The Bulls Still Up To IT?On this pair, we see that the Weekly chart is ready to resume its long held bearishness. Over the past few days, we have witnessed prices rally all the way up (a Bullish retracement inside a bearish swing), driving prices into our marked out Weekly reversal zone. As expected, the zone held, and we began to see reversals, with prices turning bearish from that point.
But the thing is this, that bullish retracement on the weekly came as a result of a bullish extension on the daily chart. The pertinent question before us now is whether or not the bulls of the daily chart will be able to come in strongly enough to contain the current bearish push and hold prices in a bullish trend.
Here is my take.
It is common knowledge that the lower time frames move in consonance with (in obedience to) the higher timeframes... lol (the word "obedience" got me laughing for a bit. But let's cyt back to the chase)
Now we have seen the daily printing a bullish narrative. But we are all expected to believe that the bullish trend sustained by the daily has the primary intention and purpose of driving prices in the direction of the higher timeframe, which in this case is the weekly chart. We therefore believe that all of that bullish push was to drive prices into the Weekly reversal zone. With that being fulfilled, price is expected to move in the direction of the Weekly over and above the daily direction. This is the regular theory and philosophy of the forex market.
But will that narrative hold sway this time around?
We see prices now dipping bearish. This is an extension for the Weekly chart, and at the same time a retracement on the daily bullish swing.
In the event that the Daily zone holds (which is less likely), we will expect to see prices reverse bullish, begin totally and move to take out Daily liquidity target above. This will result in a deeper retracement inside the Weekyl zone, or a complete breach of the zone. Where the zone is breached, we will look to see the market print higher prices and go all the way up.
On the other hand, if the bearish perspective of the Weekly holds, we will expect to see the Daily zone breached, at which point we will expect prices to dip towards the weekly liquidity target below.
So guys, who do you thing is gonna win the day, the Bulls of the Daily or the Bears of the Weekly? share your thoughts in the comment section

Aussie Dollar expected to fatten against the China Yuan
The Australia / China economic dependency & reliance runs almost as deep as Australia's ongoing and upbeat relationship with the USA.
Australia is where it is in only 300 years of white settlement because of its strong resources sector and China is one of its biggest consumers.
Recent stimulus to prop-up a failing economy the past few years in China should restore this ying-yang existence and a secured one for the 2 nations over the next little while.
Technically, you can see the path of the 2 currency's on the weekly chart. On the weekly it looks to be a tight consolidated range which will only serve to aid its breakout soon before traders are aware and its too late to buy the Oze at the better price.

BHP, Rio Tinto (commodities): Highly exposed to the prices of miBHP, Rio Tinto (commodities): Highly exposed to the prices of minerals and metals (iron, copper, coal). Their performance is closely tied to global demand, particularly in China.
Rewards
Trading at 27.1% below our estimate of its fair value
Earnings are forecast to grow 4.76% per year
Risk Analysis
Profit margins (14.1%) are lower than last year (23.8%)
Dividend of 5.17% is not well covered by earnings

ASX 200 futures test their luck below resistanceI see a common connection when looking across Wall Street futures, ASX 200 and the Nikkei. They're all retracing higher after a large drop and grinding their way towards resistance levels. And that could appeal to bearish swing traders.
ASX 200 futures (SPI) are within their 8th day higher. And as they have only recouped around 2/3rds of the drop rom the fall the record high (and over a longer timeframe than the drop) I suspect a swing high is due. Note Tuesday's doji, and subsequent price action has traded in the upper wick of that doj.
A resistance cluster hovers around 7873 - 7900, and we favour fading into any moves towards it with a stop above 7700. Bears could target just above 7700 for a downside target.

Domino Effect -Australia's Exposure to a Sino-Taiwanese ConflictA potential armed conflict in the Taiwan Strait poses significant geopolitical risks with profound economic implications for Australia. As a key member of the Five Eyes intelligence alliance, Australia’s strategic interests are deeply intertwined with regional stability. The potential impact of such a conflict on the Australian economy.
Economic Impact Assessment
A Sino-Taiwanese conflict would likely trigger severe economic disruptions for Australia. The nation's reliance on China as a primary trading partner, particularly in the mining and agricultural sectors, would exacerbate the negative impacts. Key sectors and their potential implications are outlined below:
Mining: As a dominant contributor to Australia's GDP and a significant component of the S&P/ASX 200, the mining sector would face substantial challenges. Disruptions to iron ore and coal exports to China would negatively impact major mining companies such as BHP Group and Rio Tinto, collectively representing approximately 5% of the index.
Agriculture: Given China's status as a key market for Australian agricultural products, the sector would experience significant revenue losses. This would affect companies involved in grain, meat, and dairy production, although their overall weight in the S&P/ASX 200 is relatively smaller.
Tourism: The tourism industry, still recovering from the COVID-19 pandemic, would face renewed challenges due to decreased international travel. Qantas Airways, a prominent component of the S&P/ASX 200, would be directly affected by declining passenger numbers.
Financial Services: The broader financial system would likely experience increased volatility, credit rating downgrades, and elevated insurance claims. Australia's major banks, including Commonwealth Bank, Westpac, and ANZ, which collectively hold substantial weight in the S&P/ASX 200, would be exposed to these risks.
Implications for the S&P/ASX 200
The S&P/ASX 200, as a market-capitalization-weighted index, would undoubtedly reflect the economic challenges posed by a Sino-Taiwanese conflict. Given the significant weightings of mining and financial services in the index, a sharp decline is highly probable. The severity and duration of the market downturn would depend on the scale and duration of the conflict.
Historical Precedent
While direct comparisons are limited due to evolving economic structures and geopolitical contexts, historical data from World War II and the Korean War provide valuable insights. Both periods were characterized by significant market volatility, with sharp declines followed by varying recovery periods.
Conclusion
A Sino-Taiwanese conflict presents substantial economic risks for Australia, with the S&P/ASX 200 serving as a barometer of these challenges. The potential impact on the Australian economy and financial markets underscores the importance of robust risk management strategies and contingency planning.

ASX 200 hints at Turnaround TuesdayStock markets took quite the beating on Monday on fears of a US recession, and speculation that the Fed may be forced to cut rates as soon as next week. A stronger-than-expected ISM services report slowed the bleeding before Wall Street indices recouped some of their pre-session losses. Nikkei futures have since risen 10% from Monday's low, which could bode well for the ASX 200.
SPI 200 futures saw a false break of the April low and held above the Feb low. A bullish divergence has formed on the 1-hour chart and prices are trying to hold above the weekly S3 pivot. Dips towards 7500 could appeal to countertrend trend for a move up towards 7700.

ASX 200 futures hints at another leg higherThe sharp fall from its record high remains the dominant feature on the daily ASX 200 futures chart. Whilst this is likely to suppress appetite for risk for some time, Tuesday's bullish hammer suggests bears are in need of a break.
The false break of the April low has been followed by a higher low and higher high on the 1-hour chart. Prices are now trying to form another higher low, so dips look appealing for bullish setups down to 7555.
7700 is the next upside target near the 38.2% Fibonacci ratio, although there is also a resistance cluster between 7767 to 7794 which also seems reachable. Whether it can extend such a move really depends on appetite for risk elsewhere.

ASX 200 bulls eye 8000The ASX 200 futures contract (SPI 200) snapped a 3-day losing streak overnight, and with Wall Street trying to shed last week's losses and the Nikkei and Hang Seng finding support, we suspect a bounce could be due for the ASX today.
The daily chart found support at the 20-day EMA and monthly R1 pivot and closed back above the May high. It is now within 1-2 day's trade form the 8k level.
The 1-hour chart shows a liquidity gap between 7950 - 8000, and with bullish momentum behind it we could find that area acts as a magnet to fill the gap towards 8000. Bulls could seek dips back towards the May high for longs up to 8000, although without a fresh catalyst it seems like a tempting area for bulls to book profits.
