Symmetrical Triangle Setup on AUDJPY with a Target of 83.50Trend Analysis
The main view of this trade idea is on the 2-Hour Chart. The FX Cross AUDJPY appears to be in a symmetrical triangle setup with the support line along the higher lows of 77.87 and 78.80 while the resistance trend line is at 82 and 81.35. There appears to be a breakout in the resistance trend line. Expectations are for AUDJPY to rally towards 83.50. Failure of this move will be observed if AUDJPY declines towards 79.75.
Technical Indicators
AUDJPY had positive crossovers on its short (50-MA) medium (100-MA) and long (200-MA) fractal moving averages. The FX Cross is trading above these respective MAs. Technical indicators are also complementing the bullish nature of the current setup. The RSI is trading above 50 while the KST recently had a positive crossover.
Recommendation
The recommendation will be to go long at market, with a stop loss at 79.75 and a target of 83.50. This produces a risk/reward ratio of 1.35.
Disclaimer
The views expressed are mine and do not represent the views of my employers and business partners. Persons acting on these recommendations are doing so at their own risk. These recommendations are not a solicitation to buy or to sell but are for purely discussion purposes. Currently I have a position in AUDJPY.
Australia

Australia 10 year Yields At the Cusp of breaking out?Like the UK, Korea, Canada, Australian yields are testing LT trend resistance.
In this case, it is also a descending wedge. It needs to take out 1.85% before we get very excited

Two scenarios for AustraliaAccording to Fundamental News, there are two scenarios for the Australian dollar against the US dollar.
With the release of US unemployment data, the value of the dollar plummeted, and the devaluation of the dollar caused an upward trend in other currency pairs, where the US dollar was on the right.
Mr. Powell will begin his speech in a few minutes, which he says will either cause the dollar to depreciate further or the dollar to return to its uptrend.
Given this, two scenarios can be considered for the Australian dollar:
Scenario 1: The dollar will fall and the price chart will return to 0.726 and even higher by breaking the resistance.
Scenario 2: The dollar rises and the price chart returns to its previous level of 0.7172

CSL goes to next level at 356Based on the chart, we can see a breakout, retest point at around 307 with a huge volume.
CSL is sideway, if it break the resistance at 320, it'll go to the previous ATH then 356 based on Elliott Impulse Wave.
I think investors will taking profit, because appearing a doji candle on the top in 31 Aug and 23 Sep. Caution that!!!
Share with me about your thought.

$ERA Energy Resources Australia Wave 2 triangle breakout. Move above the 100% fib would be bullish and confirm wave 3 is in effect
Failure to breach 0.30 and make a new high will see it test the 0.618 extension

$PEN Peninsula Energy Bullish 3rd wave confirmed over 0.215 if it can move into that new high
Failure to do so may see the stock fall back into its corrective phase wave 2

APPEN LIMITED DOUBLE BOTTOM IDEAHello guys. As you can see APPEN just double bottomed today. This bullish sign could pump APPEN to about 12AUD (8,85USD). The strong support at 9,58 AUD (7,07USD) should hold in the future and could be a good stoploss.
Do your own research / Trade at your own risk
NOT FINANCIAL ADVICE/RECOMMENDATION ( just my toughts about this stock) :)


Great Energy to fly POWR having real world partnership with top countries and institutions including India,Australia,Thailand governments. Also it always pump hard.
We can expect monster pump from POWR in coming days🚀

Brambles - Wedge/Triangle Pattern has to be respectedBrambles is one to keep an eye as the range tightens inside the triangle pattern. breakout is coming soon.
Which way it breaks your guess is as good as mine, however, if we go off the last decade of BXB chart patterns we should see a bullish breakout.
Additionally, Todays trading update: www.asx.com.au looks promising.

AUD/USD Long Idea (Taking order)Aud/Usd log idea based on technical analysis. Support and resistance idea. Daily is retesting a major support zone, I scaled down on lower time frame to look for entry

XJO - Technicals are saying a bearish move could be on the wayThe XJO chart has a bearish rising wedge formation that is coming to a cross roads. Looks like a break to the downside is highly probable leading into the end of the 20/21 financial year.

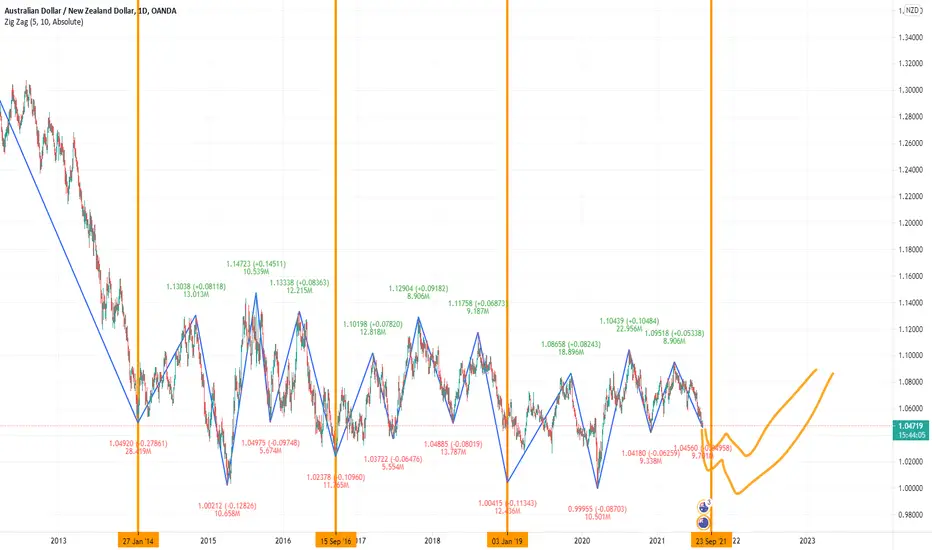
AudNzd: on the way own until the end of September?not rocket science but seems plausible :)
noticed that the waves are almost the same in all three situations
waiting for the last leg to happen
AUD CAD 4h longprice came back to 0.618 Fib level.
noticed that this level can have a big influence
also seeing some momentum on smaller TF

Australian stocks looking pretty goodAfter more than a decade of poor performance relative to other markets, the Australian stock market has clearly broken out. At least it has broken out in AUD terms, not USD terms (not yet). It's looking pretty strong and in my opinion it could continue much higher. Definitely one market that makes me have a more bullish outlook on stocks in general.
At some point it could return to 6300, but for now I can easily see it go to 10000 over the next 12-18 months.

AUDUSD BEARISHAUDUSD is set to commence on a bearish market run based on the below fundamental and technical analysis.
Fundamental Analysis:
-China's negative trade policy on Australia products coal wine among others and accusations of dumping
-Australia Covid 19 lockdown
-According to COT Commitment of traders report, Dealers have taken short positions and changed form long.
Technical Analysis Supporting:
-Price has broken daily uptrend resistance line
-Bearish Head and Shoulder Pattern Formation confirmed.
-Rising Wedge broken on lower resistance line
-Price went below moving average

Expected Breakout Higher in AUS200Disclaimer
The views expressed are mine and do not represent the views of my employers and business partners. Persons acting on these recommendations are doing so at their own risk. These recommendations are not a solicitation to buy or to sell but are for purely discussion purposes. At the time publishing, I have a position in AUS200.
Trend Analysis
The main view of this trade idea is on the 1-Hour chart. AUS200 has been in a rangebound move and is expected to breakout in the short to medium term. Based on the market profile, the range is between 7255 and 7325.
Technical Indicators
AUS200 recently crossed above its short (25-SMA), medium (75-SMA) and fractal moving averages and it is currently at the middle of the range. The RSI is above 50 and is heading higher. Moreover, the KST confirmed bullish move with a positive crossover.
Recommendation
The recommendation will be to go long at market. At the time of publishing AUS200 is trading around 7293. The medium-term target price is observed around the 7400 price level. A stop loss is set at 7200.

AUD Index: 7/12/21 - 7/16/21This is a Australian Dollar index I created. I use these to help gage currency strength when looking for a pair to trade.
GL Traders!
"Don’t blindly follow someone, follow the market and try to hear what it is telling you." - Jaymin Shah

LIT a brief analysisDISCLAMER: This is not investing advice
Long term holder of LIT
As a holder I have found little to no analysis on ASX:LIT on tradeview, so I thought id share a few thoughts and start a discussion about the stock.
ASX:LIT has found a strong support field between 0.110 and 0.120, for the last few months.
Stock has been performing well from a fundamental analysis stand point and just needs a positive catalyst to get things moving.
we usually see some small upside movement at the announcement of positive news however the stock ultimately falls back to its comfort zone between 0.110 and 0.120.
In my opinion we need to see a drop to 0.100 and the confirmation of projects to go forward in the later half of 202, before true growth can occur.

AD8 - Get ready for it to breakout!!Key Technicals - Symmetrical triangle pattern suggesting there could be some nice upside in AD8 ( roughly 30%). Looking to enter a Breakout of triangle pattern. Trend to continue bullish if we break the high side.
Key Fundamentals - Plenty of growth as AD8'S products are becoming more of a necessity rather than a luxury.
asx.api.markitdigital.com

TLX - Bullish Flag Pattern!Bullish candle in the TLX chart today has got me interested in it again. The chart has a high probability bullish flag that looks a high probability opportunity. ATR is erratic the only concern.
Entry: bullish candle break of flag with above average volume.


