AUDUSD BUY AND SELL trade Right now price is heading to 81 cents as this is a major resistance and is currently a 0.786 fib level and a long term bearish trend like so if price does not break this level we will see a bounce off that trend like and see bearish continuation for another 4 years till it bottoms out at 47 cents. Cant see that the recent bottom being strong enough as there’s not so much support/legs built there so. One more dip.
Australia

City Chic (CCX) - 20% + upside - Bullish Flag!City Chics Online penetration is likely to contniue for the forseeable (21) (covid environment).
Technicials - Bullish flag, enter bullish candle confirmation breakout.
Key Fundamentals - being a leader in the digital space + latest aquisition is leading to broader product offerings. Strong cash position.

British Pound / Australian Dollar (Bullish) I can imagine the pair to go up for a while from now on.
Set the target at first on 1.79850
And then on 1.84666
I'd love to read your feedback.
How do you see GBPAUD for the next week?
FX: GBPAUD

BOQ - Nice upside leading into earnings - Bullish Flag!!!Technicals - Nice breakout of bullish flag.
Fundamentals - QLD property is forecast to rise.

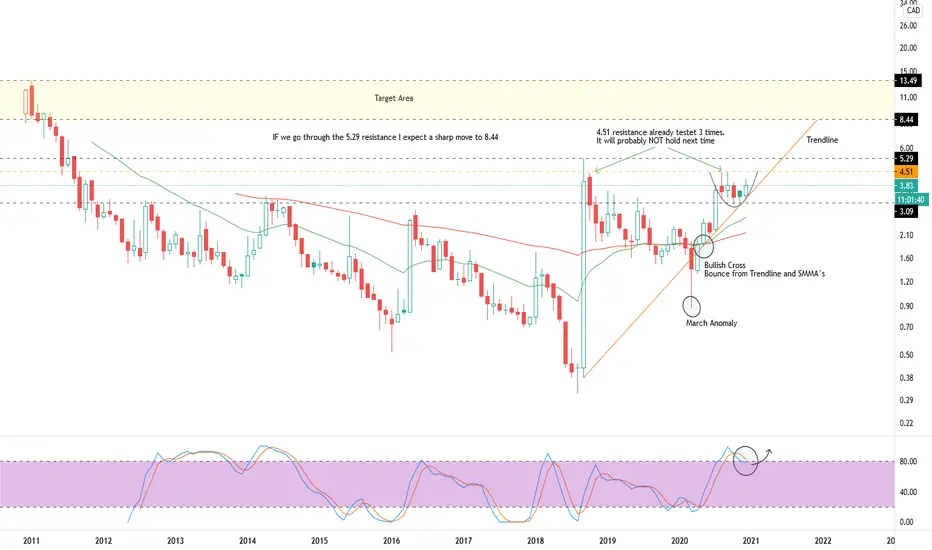
AUDCAD feels like dropping Hi guys
I guess AUDCAD may be short on its next move.
It'll go a little up and then drops down
So I guess we should get ready for selling trades.


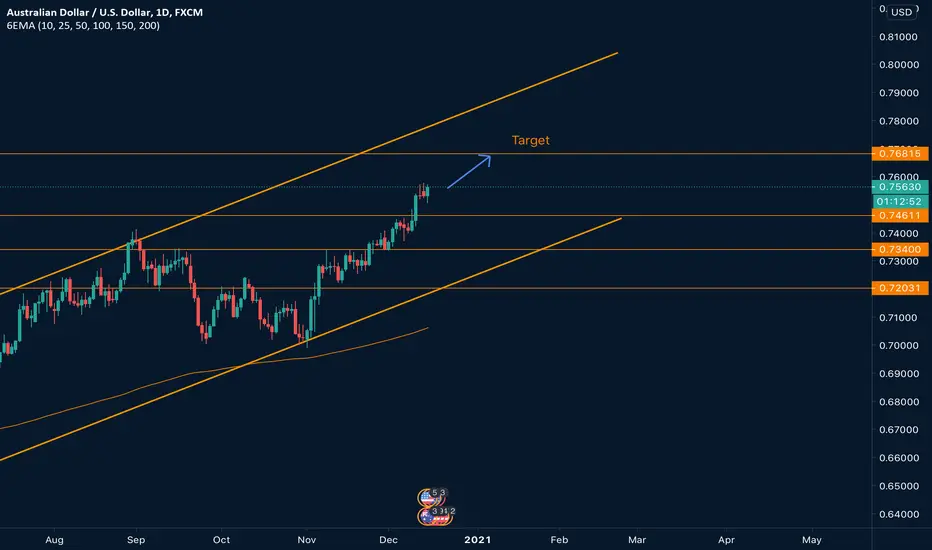
AudUsd Long Audusd will continue to grow until it reaches the top of the channel once again. From my point of view, 0.76815 is a good target because it will become a future level of resistance. I don't know exactly if the market will manage to break it, that's why I aim for such a small target.
Our target is: 0.76815
Covid recovery VIX Volatility vs NZ50, ASX All Ords, SP500, IXICVIX Volatility Index over the pandemic recovery period, versus the New Zealand NZ50 Index, ASX All Ordinaries Index XAO, S&P 500 Index and the NASDAQ Composite Index IXIC.

XAO - Bearish Divergence leading into 2021 !!The overall market has been extremely bullish in the later part of 2020, however, MACD bearish divergence is starting to present.
I'm thinking that this suggests that the trend may slow leading into 2021 or a bearish move is on the cards at some point. Will watch closely.
A similar divergence persisted in 2019 and into early 2020 which resulted in the bearish cv February 2020 pullback. Check related ideas below to compare.

View from NZ, Top 50 FNZ ETF vs. Aus, US, Europe, UK & TCL CTYView from New Zealand, NZX Top 50 ETF (FNZ) vs. Australia (OZY), USA (USF), Europe (EUF), UK in The City of London Investment Trust (TCL on the NZX, CTY on the LSE) and the UK FTSE 100 Index.

Australia market (IZO) vs, UK (F100), Europe (IEU), US (IVV)In AUD Australian Dollar terms, all ETFs listed on the Australian ASX: the Australia market (IZO) vs UK FTSE 100 (F100), Europe (IEU), US S&P 500 (IVV)

FTSE 100 vs US S&P500, Euro EMU, Australia mkts - since pandemicThe UK FTSE 100 vs. GBP ETFs for the US market (GSPX), the Europe EMU market (CEUG), and the Australia market (AUGA) - since the pandemic plunge.

AUD/USD daily- Hitting resistance and overbought RSI levels. AUD/USD daily- Hitting resistance and overbought RSI levels.

GBPAUD BUYGBPAUD long
Reversal signs + trend line analysis + Support and resistance
TP1 and move SL to BE
Trade at your own risk
OANDA:GBPAUD

AR9 - Consolidating with solid supportQuick look at the ASX:AR9 chart.
Lookback
After a cup-and-handle and subsequent break-out in July, ASX:AR9 hit a high in mid-August. It has since entered a four-month downtrend (Trend 1) and is currently in a period of consolidation.
Strong support was immediately found at the 0.618 fib level ($0.36) and this has held despite being tested multiple times.
While in a moderate uptrend (Trend 2), ASX:AR9 failed to break the 0.236 ($0.51) and 0.382 ($0.455) fib levels. This was accompanied by a drop-off in volume and a prolonged reduction in MACD.
Current situation
Current resistance (Resistance 1) is at the 0.5 fib level ($0.41) and this has been tested multiple times in the past three months.
Of slight concern is the flip of EMA 20/50 from support to resistance, and up until today this looked to have returned to a support level.
Volatility is shown to be high as per the BBQ-Squeeze. This may indicate a break-out is about to occur. The MACD has also shifted back to an uptrend and is heading into positive territory.
Performance against Resistance 1 and Trend 1 will be key to ASX:AR9 s performance for the rest of the year. A movement above EMA 20/50 would be a positive sign, combined with the volatility and MACD indicators.

IXR - where will it land?Quick look at ASX:IXR after a big end to last week.
What has happened?
After a huge run up between May 2019 and October 2019, ASX:IXR topped out at $0.015. During the ensuing months, ASX:IXR found support at the 0.5 fib resistance (Support 1) which held until COVID-19 when this level turned into resistance (Resistance 1).
IXR bottomed out at the 0.786 fib resistance level (Support 2), confirmed by the WVF market bottoms and MACD crossover.
ASX:IXR has since been in an uptrend and has broke through Resistance 1 and Resistance 2 ($0.013) - which has now turned support (Support 3).
The previous high of $0.015 was broken through in early October and up until Friday had formed a new level of resistance (Resistance 3).
Where to from here?
After Friday's +18% day, expect new support at either the previous Resistance 3 ($0.015) or Support 3 ($0.013).
MACD crossover indicates potential for some more green days, however both the MFI / RSI / Stoch are all heading toward overbought. Based on this it would be worth watching for retracement to one of the points above.

Broad ASX All Ord shows lagging Midcaps (Tech & Mining) from NovThe broad ASX All Ordinaries Index (XAO), since the beginning of November 2020, shows the underperformance of previously overperforming Midcap (XMD) sectors of Information Technology (XIJ - note particularly the high flyer Afterpay APT) - and Mining (XMM) to a lesser extent.

CGC - Bullish Flag!!Key Techincals - Bullish flag, entry in on flag break or highest probabilty is to jump in on the break of the 18th Nov high.
Key Fundamentals - Horticulture has become Australia's fastest-growing agriculture sector, opening more opportunities as a result. Australian horticulture has taken the number one growth spot in agriculture with a 40 per cent rise in production in recent years.


AX.OZL Oz MineralsHey investors,
Gearing up for the future
Long term outlook for the company is great. technically it has a long way to appreciate from a wave perspective
regards,
Limitlesss

AX.NST Northern Star ResourcesHey investors
Setup in the GDX and GLD at the moment is begging for gold miners to revert back into an upward cycle
Technically we have enough waves down to consider the formation complete and divergence is coming through stronger as the days pass
NST is one of those stocks. ASX listed
All the best. Please hit like and support the ASX listed traders on TradingView
Regards,
Limitlesss
Find us on facebook Limitlesss

