Australia

AUDUSD still in the noise, wait for a confirmation candleAUDUSD is not moving that much and in this case a breakout will determine its new trend in Hour 1 Candle. I would suggest to wait for London Open tomorrow and see if there would be a break in the box, because when it breaks then trend will always be a trend until it bends.
Get our free signals here: t.me
Like us on Facebook: www.facebook.com

S&P/ASX200 Consumer Discretionary breaking out, closing above its 2.618 extension level of the April 2010-August 2011 decline.

Update AUDUSD This is referring to initial AUDUSD plan (below)
RBA was less dovish than what the "market" expected. Technically, i was hoping the price would go up, which it did, and tap into chunks of buy orders. I am still bearish the Aussie in spite of that RBA statement. Even if his words had much more weight than just a spike reaction (in truth, it was an opportunity to load positions from the bank, the liquidity run), I THINK (an opinion, don't need your bark as if I am saying it like its fact) its priced in already. I could be wrong and I don't care. I will react what the chart is telling me.
And the reaction would be a bearish signal at any point of the day, I will short AUDUSD since price have gone into the minimal point for me to short. (refer to the initial post)
There is no risk event for Australia, HOWEVER, there is a rate decision from the RBNZ which could effect this pair via AUDNZD.

A2 Milk - Confirmed H&S I reported earlier in the month that A2 Milk was showing a good formation of a head and shoulders pattern.
This week we had a confirmed breakout of the neckline, here is my complete analysis.
Price has fallen and closed below 30EMA (weekly).
Price has fallen and closed below 200EMA (daily).
CCI indicator(daily) is reading 222, which is a sign of strength to the downside.
Mansfield Relative Strength (XAO)(daily) is below zero showing A2M is under performing the All Ords.
Price has closed below Neckline of Head and shoulder pattern for 2 periods (confirmation).
Target price on the down side is roughly $10.7, using a 30EMA weekly as exit once price closes below on weekly time frame.
If you enjoyed this idea, please subscribe for more technical analysis in the future.
Disclaimer - This in not financial advise and may not fit your financial needs, do you own analysis before investing any of your money or seek advice from a qualified financial advisor.

Reading the Right Side of the Chart : EURAUD 19 September 2019Yesterday's trading range was 63 pips whilst the 20-day ADR was 114 pips. I am expecting a price expansion today and I am hoping the high of the week will be formed for this pair and goes on a downward move towards the weekly downside projection (the 20-week weekly range is 230 pips).
I am looking at the liquidity pool around 1.616 -1.620 and when price enters and/or breaks through it, then it will activate my bearish mode and will wait for a bearish technical signal to go short EURAUD. Moreover, price closing at these area coincides breaking the Tue-Wed high price (Phase ONe activation or "P1").
You can find the linked post to understand this concept
There is a risk event for Australia today, the Job Number in less than an hour of this writing

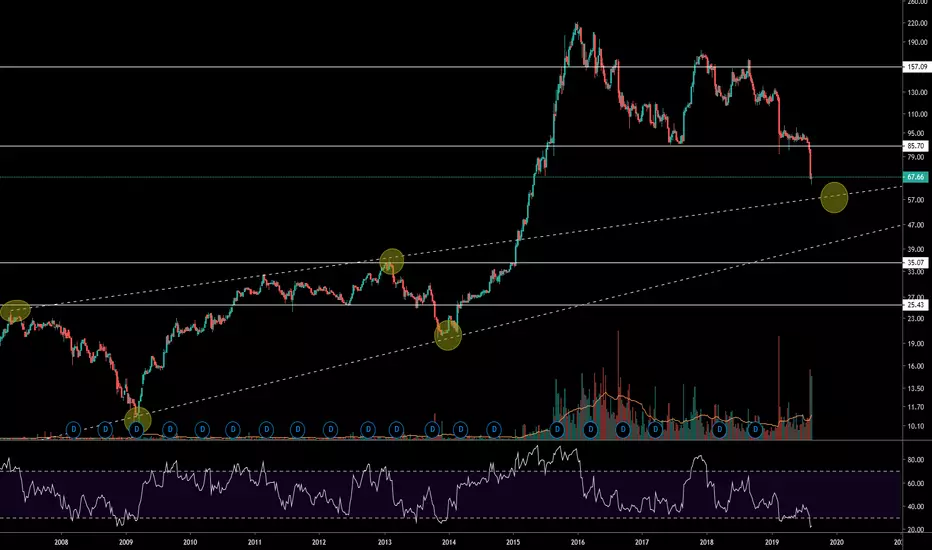
gold funds - ETFSec GOLD & BetaShares Gold Bullion fund QAUgold funds - ETFSec GOLD & BetaShares Gold Bullion fund QAU

ETFSec GOLD and BetaShares Gold Bullion hedged fund QAU ETFSec GOLD and BetaShares Gold Bullion hedged fund QAU

A2M Head & Shoulders - Waiting for final ConfirmationA2 Milk appears to have lost to the bears.
A very distinct head and shoulders pattern has emerged although still not confirmed until neck line is broken.
Taking a look at the relative strength, A2M is under performing the ASX 200 (XJO) which also is a strong bearish sign.
Increased volume on negative candles and on right shoulder shows strong possibility of break down.
Finally the share is closed below the 30 Week EMA, which also signifies a bear movement maybe lurking.
Please note this general advice for educational purposes, carry out your own analysis before entering a position or consult a financial adviser.

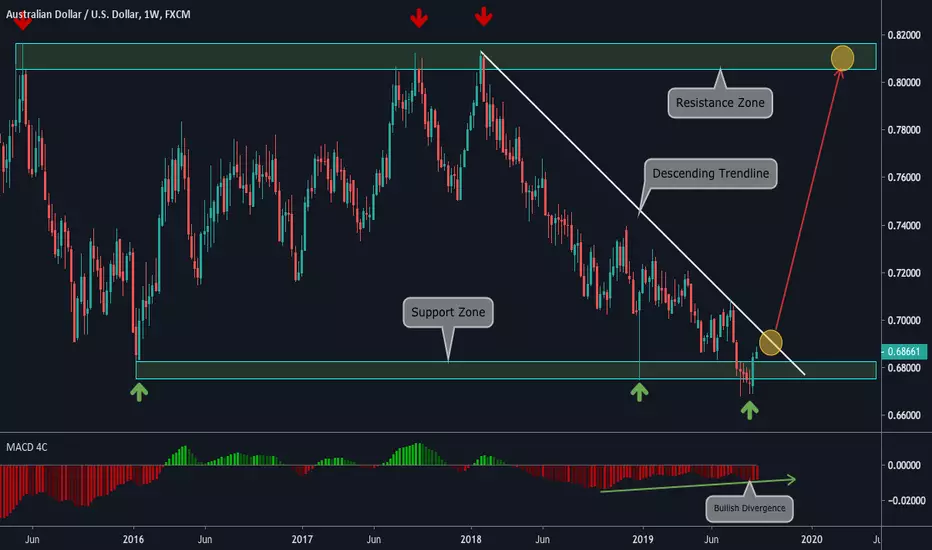
"AUDUSD: a bull Weekly Vision" by ThinkingAntsOkWeekly Chart Explanation:
- Price is on a lateralization since 2015.
- Price is currently on an important Support Zone.
- Bullish Divergence on MACD.
- If price breaks the Descending Trendline, it has potential to move up towards the Major Resistance Zone.
Updates coming soon!
STO, Santos Limited - Breakout on Cup & HandleTechnical analysis is applied in all regulated financial markets, and the higher the capitalization, the more we get the statistics of Winrate % and Risk Reward that we know and that is why we filter certain companies based on their economics.
Our strategies use classic technical analysis, spreads on some commodity futures, the purchase of shares with options hedging, the sale of options and some special strategies in Forex.
Everything always starts from the allocation of capital according to a certain model of money management.
Only with the strict discipline of all this you can be profitable in the long run.
Do not believe in fairy tales if you plan to make steady profits over 40% per year, it's just luck that it will end soon and very badly.

Australian dollar possible short term upwards correction Australian dollar possible short term upwards correction but are we going to see a continuation of the down trend?
The Australian dollar has been under pressure from a strong USDOLLAR and persistent weakening of monetary policy in the region. I'd expect to see some pullback here and see what happens as it could continue sharply lower as we have seen this year. If we continue making higher highs expect a quick return to the 0.695 where a test will be made a probably test the low again.

"ASX: long vision in the short term" by ThinkingAntsOk4H Chart Explanation:
- Price bounced on the Support Zone.
- Price broke the Descending Trendline.
- Now, it has potential to move up towards the Resistance Zones.
However, in the Long Term we have a short view. Take a look!
Weekly Vision:
Daily Vision:
Updates coming soon!

Further falls expected on ASX index?After reaching all-time highs previously set in 2007, the ASX:XJO has formed a significant bearish candle on the monthly chart.
The bearish engulfing candle on the monthly chart has formed at the convergence of the of the 2007 all-time high, and the upper channel of the range the ASX:XJO has been trading in since 2009.
This could potentially signal the beginning of a multi-month (or year) decline in the index. Or of course - to give the classic contradictory financial forecast - it could be a "healthy" retracement before forming new all-time highs.
Good luck!

"AUDUSD: down move coming" by ThinkingAntsOk4H Chart Explanation:
- Price is on a Macro Descending Channel.
- Price broke an important Support Zone (now Resistance Zone)
- It is currently on a Bearish Corrective Structure.
- If price breaks it at 0,673, potential to move down towards the Fibonacci Levels.
Check out our Daily and Weekly Analysis.
Weekly Vision:
Daily Vision:
Updates coming soon!

Telstra increasing in price! With Samsungs Galaxy Note S10 5G and the beginning of 5G technology, Telstra will be thriving to dominate in the new 5G market. Already Telstra has sold many new Galaxy Note S10 phones, hinting that 5G will soon be in demand. 5G will be a big expense but can easily be profitable due to what 5G will be supporting such as remote surgeries and Artificial Intelligence. 5G only has a radius of 150 meters, meaning the cost will be more than 4G and will only be in cities until further technology is researched.
This is a massive opportunity for Telstra and one that they will not miss, Samsung phones are thriving in sales and only need more 5G antennas to support all features of the phone.
My intentions towards Telstra is to Buy Long and remain a holding owner until 5G has reached its peak price thus slowing Telstra's revenue. This is due to everyone having 5G and becoming the norm, similar to how 4G is today.

AUDUSD | BearishPrice is in a massive downtrend, Sell pullback to 21EMA or to weekly central pivot.
Target is Weekly M1 and Monthly M1. As they overlap I assume there will be a lot of bulls coming in, so better get out there (0.67133 - 0.67033).

ANZ trading opportunitiesANZ looks ready to drop after poking at the .618 fib level. exit short or buy anz at the zone shown below.

NAB Approaching the short zone Remember to use stop loss! NAB is approaching the zone to short so keep an eye on nab for the future.

Buy and Sell zones for Cba currently bouncing between levelsHi everybody. This is a chart showing you possible sell zones and buy zones due to resistance that we have encountered before and support which is the .618 fib level.

CSL at resistance will it retrace back to the fib levels?CSL is at resistance and looking to drop bigtime down to the retracement levels. The cyan box below is a possible long spot for csl

"ASX in new highs since 2007: what's next?" by ThinkingAntsOkDaily Chart Explanation:
- Price is against the Weekly Ascending Trendline.
- Price is on a Micro Ascending Trendline.
- Bearish Divergence on MACD.
- If price breaks the Ascending Channel at 6740, potential to move down towards the Support Zone at 6400 and, then, to the Bottom of the Ascending Trendline at 5620.
Our Weekly View support this idea. Check it out!
Weekly Vision:
Updates coming soon!
