Audusd quick updateJust looking at two potential necklines. Both probably matter.
If you take away the overthrow in 2008, you get a very clean horizontal neckline that just broke, signaling recent acceleration downward in AUD. This is also likely why we were muddling around recently in the current range for such a long time. The other neckline was already broken, but it based on reaction to resistance, I think the horizontal neckline is the more followed resistance level.
Australia

AUDUSD - Feeling the HeatAs trade tensions heat up between the US and China, the AUDUSD seems to be caught between a rock and a hard place.
In recent sessions, the AUDUSD failed to breach its 10-Day EMA, indicating weakness for the Aussie Dollar. Further, its MACD is stubbornly below the signal, and with the ADX in trend, it appears that this downtrend still has room to run.
Look for AUDUSD to touch AUD$0.6762549 in the coming weeks.

ASX 200 (AUSTRALIA) - Bearish Divergence + Double TopRemain cautious on the long-side given bearish divergence & the double top. Look to buy any pullbacks.
A positive China Trade Deal or interest rate cuts may see ASX 200 reach new ATHs.
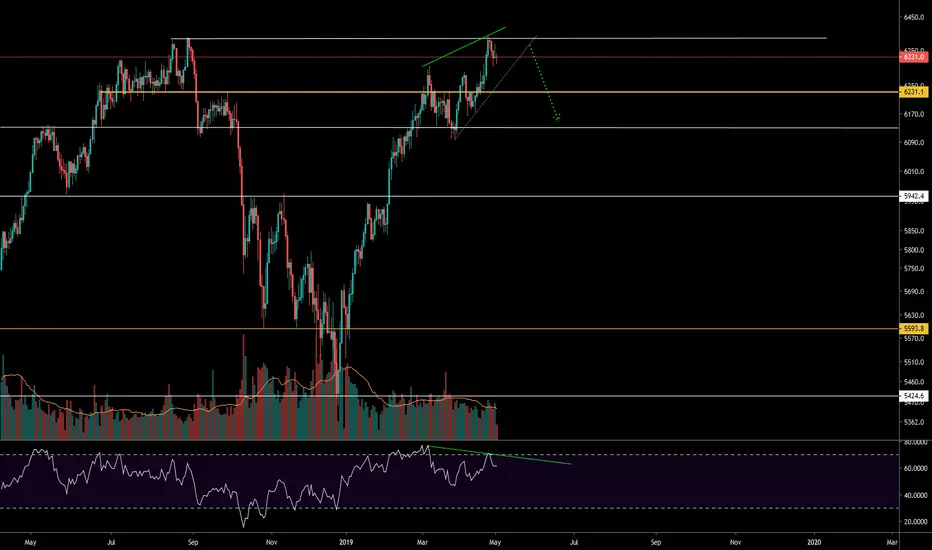
ASX: Australian stocks approaching a peak.The ASX Ltd is on a very strong bullish monthly streak having gained over +25% in 2019 alone. It appears to be trading inside a 20 year Channel Up that displays all phases of a Bubble (aggressive rise, blow-off, consolidation) from Higher Low to Higher.
Currently it is near the end of the bullish leg towards a new Higher High (peak) which is projected within 80.00 - 84.00 towards the end of 2019 (based on a 1702 day Bubble Duration). All charts are overbought (or close to) from 1D (RSI = 72.582) to 1W and 1M (RSI = 76.630 and 73.368 respectively) indicating that the peak of the bubble is indeed near and should be achieved on this final 2019 push.
Our strategy is to buy on every dip until this Target Zone. Then depending on circumstance and mostly global trade dynamics, we will most likely start building up a short base but updates will follow.
** If you like our free content follow our profile (www.tradingview.com) to get more daily ideas. **
Comments and likes are greatly appreciated.

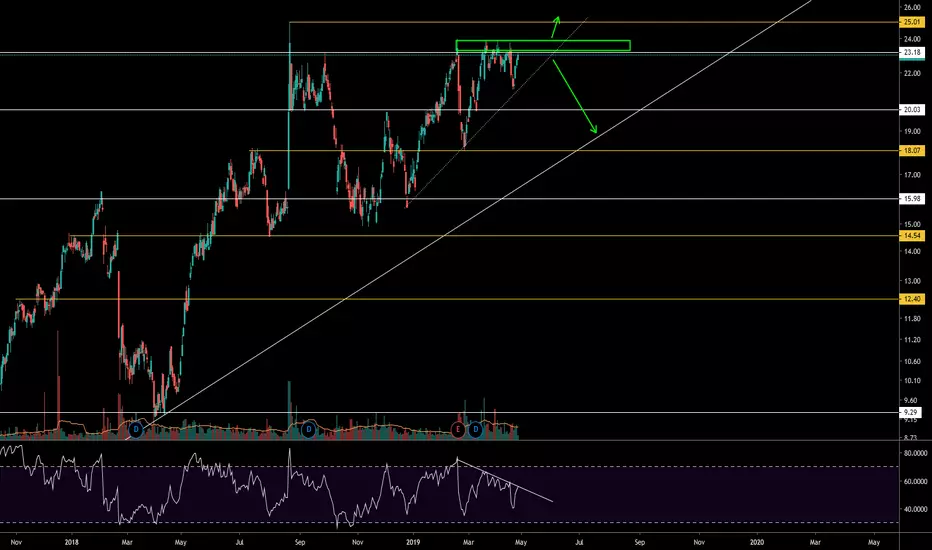
WISETECH GLOBAL (WTC) - Preparing for Breakout?Wisetech has been failing to breakthrough resistance for the past 2 months, forming a downtrend on the RSI.
A break above the pocket of resistance at $23.85 would see Wisetech retest its ATH and most likely break it higher.
A break below the local dotted uptrend line should see Wisetech retest it's major uptrend line around $20.
LSF (L1 Long/Short Fund) - Bulls in ControlWe expect price to test the resistance pocket between 1.610 - 1.645 shortly, off the back of a bullish breakout and positive NAV movements.
LSF is still trading at a 10% discount to NAV.
There is the possibility of a pullback to retest the breakout point 1.500 - 1.540.
We expect any pullback to be met with big buyer demand, so long as the NAV keeps making gains.

LSF - BreakoutLSF has broken out of its tight range whilst it's underlying NAV has hit record highs since it's collapse.
Expect price to break through the local high and head towards next resistance.

AUDUSD Slow Decline DownwardStochastic flashes overbought while RSI is approaching this level. However, the Chaikin oscillator suggests there's some room to run higher. However, long-term 2018 downward trending resistance is a bit strong to overcome. Overall, sentiment is short, but need some more convincing as there is probably still more room to run upwards especially given the fact that moving averages point towards downward trending momentum.

Iron Ore AUDUSD Correlation DivergenceAUDUSD and iron ore have been quite tightly correlated over the years as it is one of Australia's number one exports. Now there is divergence which should be looked upon with high skepticism. Either the Aussie dollar will rise on the prospect of higher demand or the price of iron ore will retreat on the continue lack of demand if the supply side cannot remain limited.

VIDEO ANALYSIS: AUDUSD SWING TRADE OPPORTUNITYIn this video, we take a look at the AUDUSD as price approaches the key resistance of 0.7170.
The 4hr chart has formed higher highs, with previous structure offering support for further upside
into the key resistance.

ANALYSIS: USDCAD BREAK OR BOUNCE?USDCAD is fastly approaching the key 1.3300 support level again as the price of oil continues to push higher.
With the USD at resistance, we could see price break below the key support. If we see this happen and the market
does close below, look for short opportunities on a lower timeframe at the resistance. With Oil close to resistance we could
also see this level hold with price action being the key here.

Possible EUR/AUD Short position!!SMP TRADING
SELF DEVELOPMENT/METHODOLOGY/PSYCHOLOGY
Chart time frame - H4
Timeframe 1-2 Days
Actions on -
A – Activating Event
Market will meet resistance in zone @1.586 - .... and fall to the 1.576. In order to enter, the pair MUST be in line with my Entry Procedure....
B – Beliefs
Market move towards the first Target 1 level @ 1.576
FX:EURAUD
Trade Management
Entered @ .....
Stop Loss @ .....
Target 1 @ 1.576
Target 2 @ ....
Risk/Reward @ 3.1
Happy trading :)
Follow your Trading plan, remain disciplined and keep learning !!
Please Follow, Like,Comment & Follow
This information is not a recommendation to buy or sell. It is to be used for educational purposes only!

VIDEO ANALYSIS: NZDUSD FINISHES WEAKERNZDUSD remains weak across the board as we outlined in our market outlook this week. We expect this
to continue against the stronger currencies however we may see some buyers step back into the
market at the key demand zone here. This will be likely ad the DXY sits at the key resistance, any USD weakness
will help the NZDUSD price push higher.

VIDEO ANALYSIS: AUDUSD LONG TERM OUTLOOKIn this video update, we take a look at the AUDUSD as price may look to move higher in line with
our quarterly outlook. The daily chart continues to consolidate and to confirm higher prices we will need
to see the AUDUSD break and close above the previous highs at 0.7160. This will show us that AUDUSD
is changing cycle and to look for further upside.

VIDEO ANALYSIS: USDJPY ONE LAST PUSHUSDJPY could see another leg higher as the JPY continues to weaken. Price on the daily chart suggests further upside
with price forming a bullish flag pattern on the 1hr chart currently. A break higher could lead to price heading towards
the 111.80 resistance.

VIDEO ANALYSIS: EURUSD WHAT NEXT?EURUSD is back into the key weekly lows and with the USDX at resistance,
we could see some short-term weakness in the USD pushing EURUSD prices higher.
If the market forms any bullish price action here we could see the market head towards
the 1.1300 level. Our idea will be invalidated if price breaks and closes below the lows
at 1.1177.


VIDEO ANALYSIS: WTI TO FALL TO $53.00In this video update, we take a look at WTI as price has retraced back to the key $60.00 level.
With price holding a 50% fib confluence at this level we could expect the market to move
lower from here. The 4hr chart is highlighting a double top pattern and if price can break below
$58.00 we should see some further short selling enter the market.

VIDEO ANALYSIS: USDCAD TRADE UPDATEIn this video update, we take a look at our current position on USDCAD as price bounced from the
previous highs. The weekly timeframe suggested we are going to see further upside with a bounce from 1.3300.
Looking for price to continue higher towards our targets.

ASX set for Trend Reversal. Bearish Divergence WeeklyHi all,
as you can see on the weekly time frame (also monthly) we are witnessing positive price action for the ASX. Although positive price action is generally celebrated, it needs to be backed up with positive movements in relative strength, which in this case is not happening.
As you will see on the chart published, despite the positive price action we experienced a lower high on the RSI, which during an uptrend can often be an early indicator for a trend change. This is commonly known as an RSI Bearish Divergence.
Due to this, I am opening a long term short position in which I expect significant downside movement, and since being so close to the recent weekly high, I only have to risk a minimal % of my position.
Anyone who follows me will know that these are my ideal trading set ups and I will more often then not open positions when these set ups occur.

TRADE ANALYSIS: NZDUSD SITS AT TRENDLINE RESISTANCEThe NZDUSD could see some short-term downside as price sits at the trendline resistance highs.
Price has tried to break higher on a few occasions with no luck so far and with the USD looking likely to
continue to the $97.50 resistance we could see NZDUSD head back towards to the trendline support.
This market is in a consolidation pattern meaning that we must wait for added confirmation before
looking for key high probability trading opportunities.

VIDEO ANALYSIS: WHAT TO EXPECT FROM THE USD THIS WEEKIn this video update, we take a look at the USD as the greenback could be set to rise up towards the $97.50 highs.
The reason being the 3 months and 1-year yields have inverted. When this has happened in the past a market crash has followed.
In situations like this, we typically see the market run to safe haven currencies such as the JPY and USD.

ANALYSIS: USDJPY TO CLOSE BELOW 110.00USDJPY could see further downside if the market can close below 110.00. Earlier in the week,
we discussed a potential breakout of the triangle consolidation pattern and the likelihood of the market
testing 110.00 demand zone on a dovish fed tone. Now that price has re-tested this zone the market is currently
breaking below it. If we see a weekly close below the level expect further downside to come.
