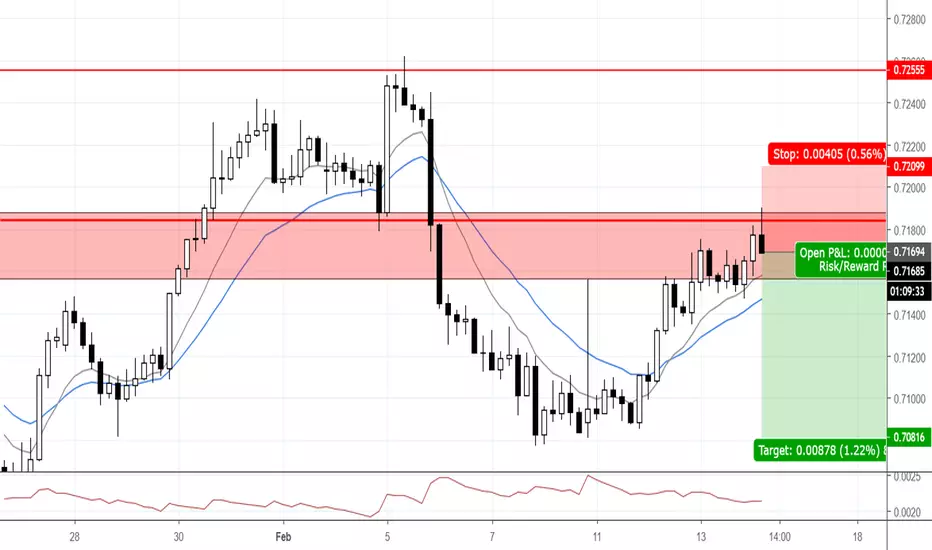
ANALYSIS: NZDUSD FLAG PATTERN TO 0.7000NZDUSD on the 4hr timeframe shows price impulsing from the 0.6770 in line with the weekly timeframe.
Price now seems to be forming a small correction with the potential to breakout and head towards the 0.7000 key zone.
As you can see the 4hr chart candles are small in range which suggests sellers aren't involved in this market and price is accumulating before a move higher. Look for the breakout here.
Australia

TRADE: USDCAD TO 1.3080We have been looking for short opportunities on USDCAD for a while now and our previous trade from the video analysis previously hit targets. The market is now lining up for a potential move lower again working within this weekly channel. Price on the weekly chart suggests we could see further downside back into the key support of 1.3080. Look for a bearish reversal signal here as we do expect the DXY to drop to $96.00.

TRADE UPDATE: UKOUSD CLOSE TO TARGETSIn our telegram channel, we identified that the current impulse move on UKOUSD
looked to be running out of steam. Price action suggested we could get a move back into the moving averages
on a mean reversion.

ANALYSIS: EURUSD TRAPPED IN ANOTHER RANGEEURUSD played out as expected last week as various weakness in both the EURO and USD kept the market
quiet and trapped within this 4hr range. As you can see price found support around the 1.1300 range and has formed a 4hr consolidation zone. Before making a trading decision here we need to wait for a clear direction.

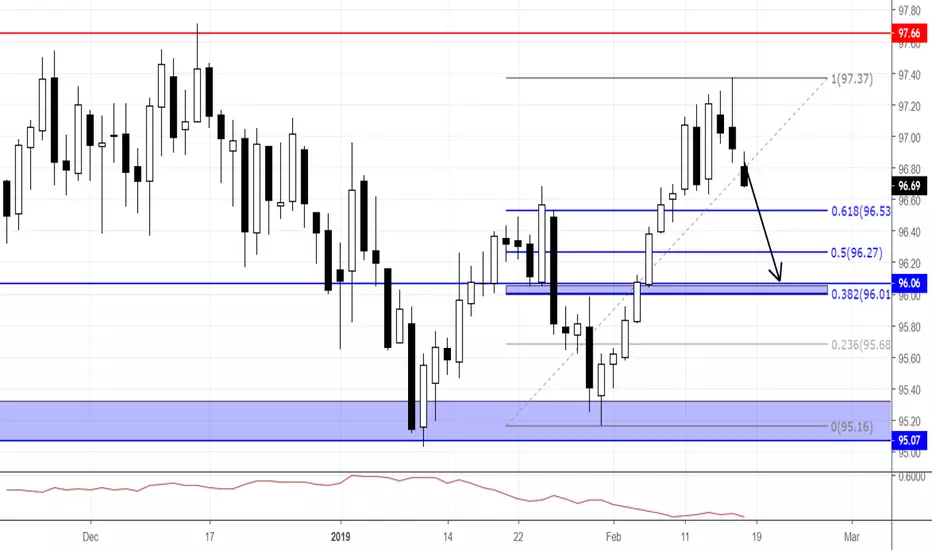
ANALYSIS: DXY BREAKS PATTERNThe USD remains under pressure as price failed to find support last week. The 4hr chart formed a bearish
descending triangle pattern and has now broken the supporting trendline. $96.00 support looks likely to be tested before we see any further developments for the USD. This level also hosts 38.2% Fibonacci retracement from the daily timeframe.

TRADE ANALYSIS: USDJPY TO 110.00USDJPY is currently trapped at key resistance of 111.00 and price looks to be preparing for a breakout.
If price breaks lower we should expect the price to head towards the 110.00 support level. The BOJ has discussed
with a local newspaper that they will intervene with more easing if they feel it necessary.

VIDEO ANALYSIS: USD FNISHES LOWER FOR THE WEEKIn this video update, we take a look at how the USD is finishing for the week and with the 4hr continuing
to look bearish we could expect a breakout of the current bearish pattern. If we do see price break lower
we should see prices head towards the key support of $96.00.

ANALYSIS: GOLD TO $1320 BEFORE ONE LAST MOVEGold could be heading back to the $1320 highs were price found structure resistance before.
If price prints bullish price action here we could see another push into the key resistance zone.
Daily trend will remain intact if price can hold above the key lows around $1300.00.

VIDEO ANALYSIS: AUDUSD WOES CONTINUEIn this video update, we discuss the current downturn in the AUDUSD as price breaks out of the bearish flag on the 4hr timeframe.
China is potentially adding a ban on coal imports from Australia which has caused the sudden downturn in the AUD. With this breakout
we could expect prices to re-test the key 0.7050 demand zone.

VIDEO TRADE ANALYSIS: EURUSD AHEAD OF THE FOMC MEETING MINUTESIn this video update, we take a look at EURUSD and how it could play out ahead of the FOMC meeting minutes this evening.
The market is expecting the FOMC to continue to set a dovish tone and with that suggest rate increases or unlikely anytime soon.
The 4hr chart is forming an uptrend and could see further upside if the weakness comes into play.

VIDEO TRADE UPDATE: AUDJPY CONTINUES TO SHOW WEAKNESSIn this video update, we take a look at the AUDJPY trade and how it is progressing. We took the trade in our
telegram channel as the 4hr chart showed price failing at the previous structure highs. Trade remains valid with
targets set at 2:1.

ANALYSIS: AUDUSD TO KEY WEEKLY TRENDLINEAUDUSD will also benefit from any USD weakness this week and price is currently sitting in a minor resistance zone.
With the USD weakness, we could see prices push towards the weekly trendline resistance. If price can pullback into the 61.8 Fibonacci retracement tool we could look for bullish price action into the 1.1618 Fibonacci extension.

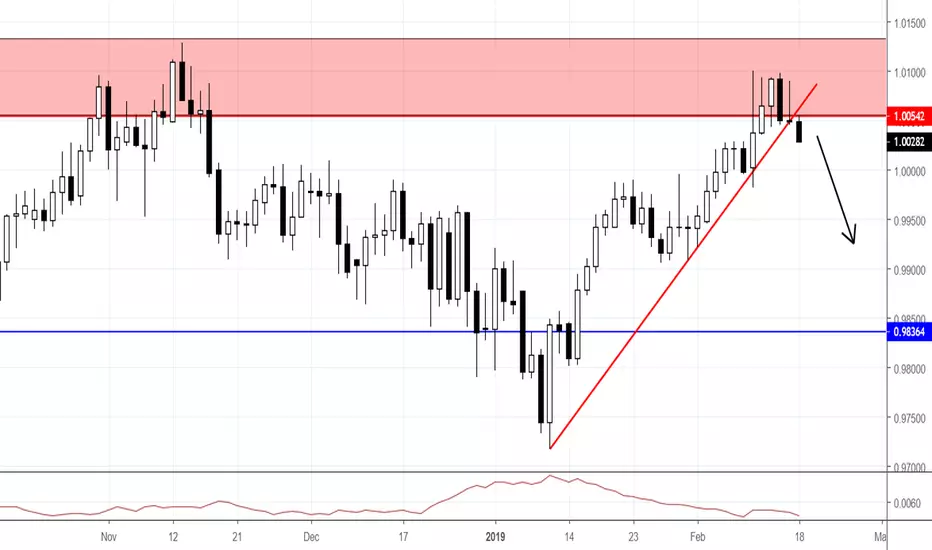
ANALYSIS: USDCHF TO 0.9840USDCHF could benefit from the short-term USD weakness and with price sitting at the key weekly resistance
zone of 1.0050 we could see price move considerably lower.
Looking at the daily chart we can see price has broken through a trendline support if we see price pullback and form
a daily double top we can look for trades short.
ANALYSIS: DXY BACK TO $96.00...USD DOWNSIDE TO CONTINUEThe USD could suffer a setback this week as the trade war risk continues despite there being some advancements. The FOMC is set to release their latest meeting minutes with it expected to re-iterate the FOMC stance on data and with the data out of the US becoming softer a dovish tone is more likely. Price could push back into the 38.2 fib and key $96.00 level.
AUDCHF Targets 0.6900 AUDCHF will target 0.6900 if the price break the neckline of the potential head and shoulders pattern.

AUDUSD For sell next week Hello Followers;
- AUDUSD finished AB=CD pattern so the price in a good zone now for sell.
- If the price raise next well it will be for selling also because it will enter Potential reversal zone of Harmonic Bat pattern.
- in any case AUDUSD for sell .. the best price will be 0.7240 to see.
Good luck

POUND GAINING STRENGTH??GBPAUD Technical Analysis. Aussie losing strength on all pairs coincidentally ;)

TRADE UPDATE: EURJPY TOWARDS TARGETSFollowing up to our EURJPY trade we posted in our telegram channel. Price has moved
in our favor and with it coming so close to targets look to manage the risk.
We will bank here or move stops to breakeven to protect capital.
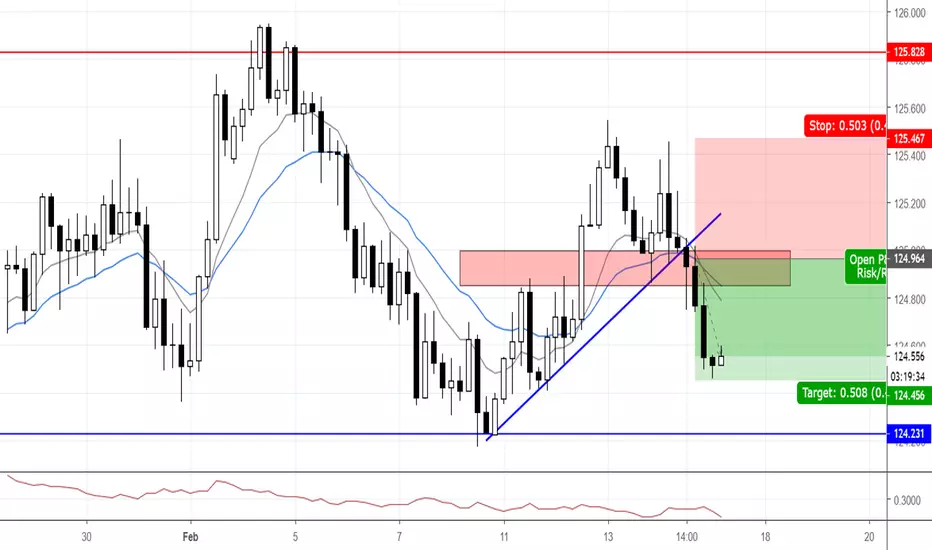
TRADE ANALYSIS: EURJPY TO 124.20EURJPY has recently rejected the key resistance of 125.80 and formed a bearish weekly candle. Since then
price has rallied this week into a minor 4hr resistance zone. Price is currently being held by trendline support
and previous structure highs. If price can break lower it will give the opportunity to look for further short trades into the
key support zone of 124.20.

TRADE ANALYSIS: AUDCHF TO WEEKLY LOWSAUDCHF is on our watchlist this week as the weekly chart rejected a key resistance zone.
Looking to the 4hr trading timeframe we can see price has approached a 4hr minor resistance zone
and price looks to be rejecting.
Entry- LIVE
Stops - -44pips
Targets- +88 pips
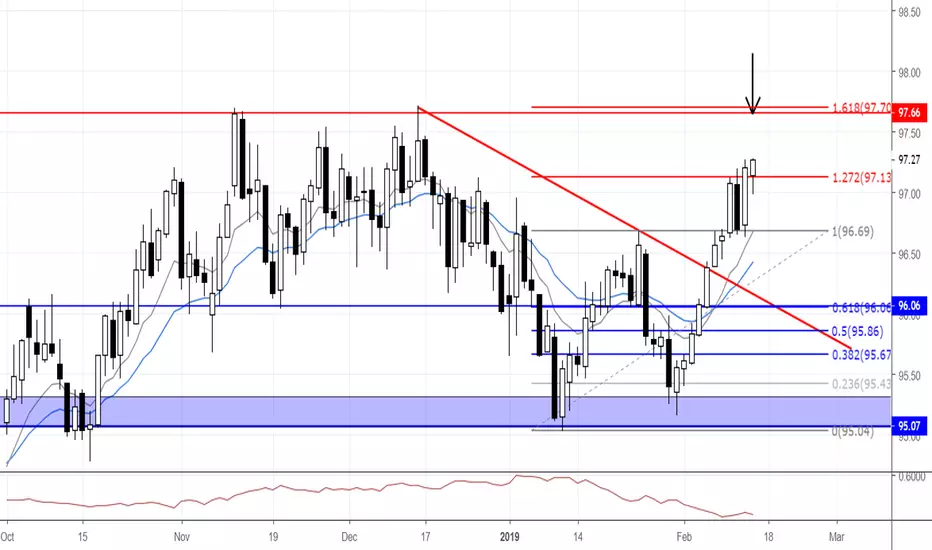
TRADE ANALYSIS: GOLDEN FIB RATIO AT 97.60...DXYThe USD looks to continue its move into the $97.60 level. The Fibonacci extension shows the golden Fibonacci ratio of 1.618 sitting at the key level. This could show us that a potential reversal is likely here. If we see price push this level and reject we could see the USD fall back within the current range and back towards $95.00.
VIDEO ANALYSIS: GBPUSD TO 1.2950In this video update, we take a look at cable and how it could see some short term strength into the key 1.2950.
This is short-term analysis as we do expect GBPUSD prices to move lower as the Brexit deadline approaches.

VIDEO ANALYSIS: EURUSD DAILY MOMENTUM TO 1.1360In this video update, we take a look at EURUSD and how we can take advantage of yesterdays daily
momentum on a lower timeframe. The 1hr chart has pulled back into a minor support zone and if
price can show bullish price action we can look for long opportunities into 1.1360.
