GBPAUD TREND CONTINUATIONWe've had some great results lately trading GBP short.
We expect this to continue over the coming days until we see prices come in to a key level where we may see some relief to the current downside. GBPAUD 4hr chart is showing a clear down trend with lower highs and lower lows. The key support area sits at 1.7960 with 127.2 Fib extension confluence. If the market was to continue the downtrend this is a key area where we should see the market find some support. Currently the market is sitting at a minor resistance from previous structure lows and 50.0% fib retracement. Looking for the market to continue into the key support.
Australia

NZDCHF TO RE-TEST HEAD & SHOULDERS NECKLINECoT Reports show NZD commercials at all time highs in Long contracts giving us the reason to look for the NZD long trades.
Looking to this pair we discussed how it broke out of a key resistance a closed above. Looking for the long trades, the set up on the 4hr timeframe didn't meet our rules and taking a step back to look at the higher timeframe the market may want to test the head and shoulders neckline with 38.2 fib confluence. If we see price reject here we can look for long opportunities up into the key resistance with 1.618 fib extension confluence.

EURJPY TAKES OUT THE ZONE As we discussed recently, EURJPY was at a key support level where we asked the question, break or bounce?
We have seen as of a yesterday a clear close below the level. Looking for a 4hr swing trade on this market now.
If we see a pullback into the previous structure lows and price failing at these lows we can look for continuation trades.

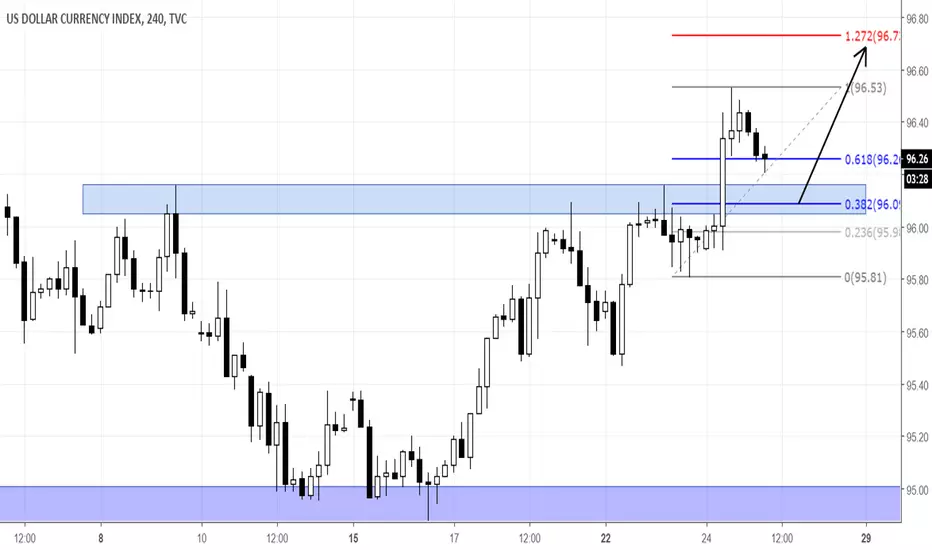
US DOLLAR INDEX FINALLY BREAKS HIGHSLooking at the US Dollar Index (basket of currencies against the USD) we can see that it has finally pushed through and closed above the key resistance up at $96.00. This is highlighting the current strength of the USD fundamentally, seasonally and technically.
Seasonally the USD has its strongest period through until the end of November.
If the USD continues to strengthen the next target zone will be up into the $97.00 level.
How are we travelling?Looks like we are currently moving down in the third Elliott wave. We have completed four sub-waves of this third wave and are likely to complete the fifth one after a leg up and a leg down. We are likely to move up in the fourth corrective wave after the completion of the third wave before moving down in the 5th of the fifth wave.
Alternative count: It is possible that the third wave shown on the chart is actually wave C. Regardless, S&P will move up after the completion of this wave but it will then start a new first wave.
PS: This analysis is just for educational purposes and is not a recommendation to buy or sell. Please do your own research and trade at your own risk.

EURJPY DOWNSIDE?EURJPY is on our watchlist as we are currently seeing the market buying into the safe havens such as JPY and selling the EURO due to the events outlined in our previous EURUSD post.
Looking at this market technically we are at a key support zone, if we see the market push below the zone and close lower we can look for the continued short trades here. If this
market does break lower there is room to the see this market fall to the next support zone of 125.00.

USD STRENGTH EVIDENTAs we can see from this USDCHF chart currently the USD strength is in play and we should expect this to continue as long as the data backs up the Federal Reserves plans to hike interest rates. We will be closely watching the data releases over the coming weeks. Keep an eye on GDP, CPI and Employment announcements as these will be key indicators to inflation targets. This will then ultimately affect the decisions to hike rates or not.
Looking at this chart we can see the 4hr chart created the higher highs after double bottoming at the support zone we have talked about before. Expecting this market to head up to the key resistance of 1.0050 where the market will have to make a decision on direction.

EURUSD DOWNSIDE CONTINUATIONWith current situation with Brexit and Italy continuing, the EURO could be an interesting currency to keep an eye on. That paired with the USD strength economically and seasonally we could see further downside to come from this market. Looking at the chart technically, before we look for the short trades we need to see a clear close below the current structure lows at 1.1432. If we see that close below we could see a re-test of the 127.2 fib extension before seeing a retracement to the those structure lows where we will look for the short if the market conditions have been met.

Australia 200 Short IdeaNear 5922 I will open a Sell
I think the price will continue down move because long-term trend is broken and turned into a bearish month ago. Also, on the chart, we can see how the price bounced so many times from key level 5943 on Daily chart. It's the best signal that big players protect that level and near that level, we have a low and predictable risk.
Short near: 5922 goal:5778
Push like and Subscribe

BRENT CRUDE TO RETRACE FURTHER IN WEEKLY UPTRENDWe have already had some great shorts on Brent of the past few weeks and now we have just cleared out the support of $80.00 we can continue to look for the short positions.
We have to be aware that the weekly chart is still in an uptrend and until its breaks the weekly lows of $70.34 we should be cautious in holding long term short positions.
Looking at the chart we could see the BRENT CRUDE OIL market retracing down to the 38.2 fib and if so we could look for further short trades down to this point if the market on the
4hr timeframe can pullback into the key 4hr structure lows of $79.00.

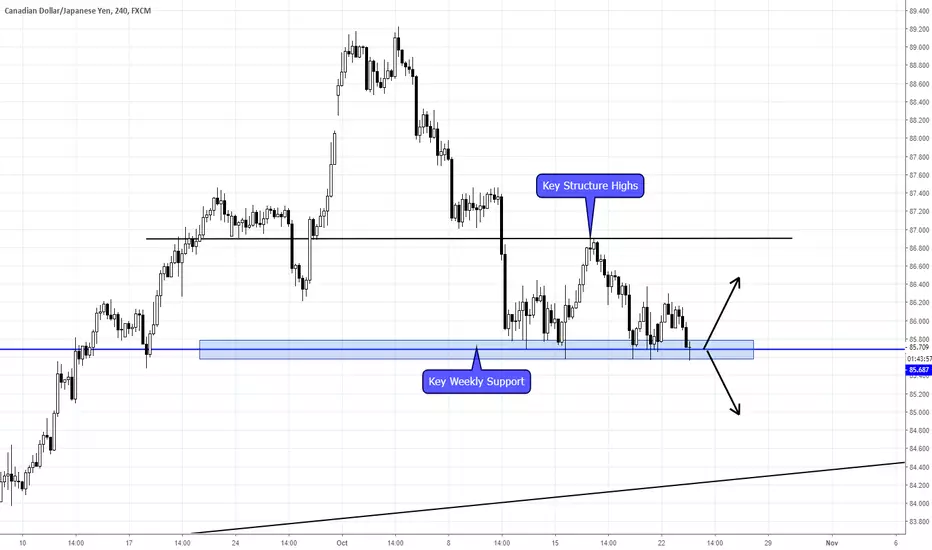
CADJPY STILL HOLDING AT SUPPORT AHEAD OF BOC RATE DECISIONWe expect to see some movement on this pair this week due to the Bank of Canada Interest Rate Decision on Wednesday where they are forecasting a 25bp hike. This should lead to some investment into the Canadian Dollar however is the move already priced in?
Looking at this chart technically it's at a weekly support level which it can't seem to break through at the minute and could be key to either seeing the market break or bounce at this point.If we see a break above the key structure highs we can look for CADJPY longs however if we sink and close below the support we could expect a deeper retracement of the weekly uptrend to the supporting trendline below.
One to watch!
GBPUSD DOWNSIDE CONTINUATION LIKELYLooking at the GBPUSD technically we can see that the market is clearly making lower lows and lower highs and the Daily timeframe confirms we are still in a downtrend with the potential for price to head down to the key support level of 1.2700. If the market can pullback to the key resistance of 1.3020 with 50.0% Fib confluence we can look for the continuation short with stops above key 4hr highs.
Brexit still remains the threat here with Prime Minister May saying she has the deal 95% done however the Irish border remains an issue. This is likely to continue to cause an issue for a while and would expect the market to move lower.

Xero (XRO) 4 year break out above all time highs.Looks like a great bullish breakout here to me, but I wish the volume was a bit higher.
Distance between 2014 high ($42) and lowest low since then ($12) is $30 which gives a long term goal price of $42+$30 = $72 target which would likely take years to hit. In percentage terms this is 60% upside
A stop at $37.49 gives a risk of $7.63 or 17%
Anyone else have similar or opposing views?

ASX - over extended market.The market has over extended now and as i have mentioned in my previous post, i am expecting green this week. Today's close is evident of that and looks good for a 1-2 week up trend. I Expect us to reach the red area before heading down lower.
friend of mine mentioned that US earning reports re coming out in 2 weeks. This may be the catalyst that takes us lower into the next lot of targets. Other than that, we should have some relief. Fisher and RVGI ready to reset.

AXS200 updateThe market had a good bounce today with an even red and green movements. As per the bounce.
The perfect wick from serious support (i.e. the sidways movement back in 2017).
As mentioned in my comment on my other post, I expect more green to come this week. The DJI is already up 1% with many US stocks in the green.
I suspect this is our first pivot point with potentially 1 or 2 more major dumps in the near future.

ASX Bounced Off Support, Potential To Rise FurtherASX bounced off its support at 5731 (50% & 38.2% Fibonacci retracement, horizontal overlap support) where it could potentially bounce to its resistance at 5963 (38.2% Fibonacci retracement, horizontal pullback resistance).
Stochastic (55, 5, 3) bounced off its support at 2.9%.

ASX dump. 6000 did not hold!I did not expect such strong selling through the 6000 level so soon. I was honestly expecting a bounced at 6000 with long term support (trend line) holding.. I guess THEY had other plans ;)
The selling occurred due to the $DJI breaking support and dipping just under 6%.
Second target in sight, however, the fisher and RVGI are both over extended so I expect some green action to come next week. I will need to revisit at todays close to determine if this may occur or not, the current candle stick is already a sign of reversal and it is approx 1:30pm.
I will also link the DJI chart for reference of support break.
Reminder to check my last charts in related ideas. Previous chart called for 6000 being reached within 5 work days.

ASX will reach 6000 in < 5 working days.I don't know what happened today, but we are almost there.
TA > FA.

Weekly - BWX Limited - ASXLong until Fisher bounce
50 EMA about to cross 100EMA - Long until cross.
Most likely will double top at 4.41.
Rules from daily still apply... except $6 looks unlikely for now.
Highest volume week for a while approx 2 weeks ago.

Daily - BWX Limited - ASX$BWX.
few things here
1. hell breaks loose if $3.47 breaks.
2. long the trend line break
3. long the trend line retest after break
4. long now if you're ballsy
5. long now isn't too bad, daily retested previous support.
5a. the low made would've most likely been a stop hunt.
6. long until $4.41
7. if 4.41 does break, long until $6+
Refer to related ideas for 3D and Weekly time frames.

Momentary relief for the ASX - Update.A bull div is forming on the daily, looking at a retest of resistance a 6233.9.
Larger time frames (3D and weekly) still say down. Fundamentals (economy, banks, dollar etc) also say down.
Will update once we approach the level.
Current sentiment - long... extremely short term though.

ASX Market Update.I've been watching this closely. Mutliple channels being formed and breaking down. Today the $AUD broke the 0.72 support level. House prices have dipped 6.1% this year and the cash rate was kept at 1.5%.
I believe we will see 6000 soon. Hoping that will hold, otherwise the blue box is the target. As stated in my related idea, interest only loans are about to mature. With the current climate of our economy, families and investors may find it difficult to pay and close off their loans.
"Around two-thirds of interest-only loans in the Reserve Bank's Securitisation Dataset are due to have their interest-only periods expire by 2020 (Graph 4). That is consistent with interest-only periods typically being around five years. Only a small share of loans have interest-only periods of 10 years (or longer), with very few loans on these terms having been written (and securitised) since 2015." (www.rba.gov.au)<< Great article about the current situation.
Of course, they can refinance their loan, but doing so, with the current uncertainty of the economy, may be too much risk to handle.
Things do not look great for the Australian Economy.

LONG AUSTRALIA 200 1;1.5RR 105 PIPS TARGETFUNDAMENTALLY, AUSTRALIA ECONOMY ISNT BAD AS EMPLOYMENT STATISTIC JUST RELEASED WHICH SUPRISED A LOT OF PEOPLE.
TECHNICALLY, IF THIS INDICE STAYS ABOVE 6000, WE WILL REMAIN BULLISH
