AUDCAD shortHey Traders, today we are monitoring AUDCAD for a selling opportunity around 0.905 zone, once we will receive any bearish confirmation the trade will be executed.
Trade Safe, Joe.
Australia

AUDUSD ShortHey Traders, today we are monitoring AUDUSD for a selling opportunity around 0.711 zone, once we will receive any bearish confirmation the trade will be executed.
Trade safe, Joe.

AUDUSD SwingHey Traders, in this week we are monitoring AUDUSD for a long term buying opportunity around 0.711 Zone respecting the strong weekly demand zone in combination with the bullish trend. once we will receive any bullish combination the trade will be executed.
Trade Safe, Joe.

Flight Centre Bullish Trend ?FLT is one of most populer Stock to trading, now we look at the chart the trend is bullish, how to catch the bottom? now i look you can have a plan buy on weakness at 17.65 area bottoming, if reverse, that will going up to close the gap at 35.50. Are you have a same idea? , Comment in below, The Story still good for FLT because Australia will be reopen flight for international on end of november or December, so follow this story and take your Profit!!
Disclaimer On

AUDUSD Analysis WeeklyComparable points in green
Extremely similar, the only difference I can spot is the second one is above the 200MA
while the first is below
I do expect upsides as it moves out of the circle

AUDUSD ShortHey Traders, in this week we are monitoring AUDUSD for a selling opportunity around 0.726 as we noticed a breakout of the bullish uptrend on daily frame. Once we will receive any bearish confirmation we might consider selling at the retest.
Trade Safe, Joe.

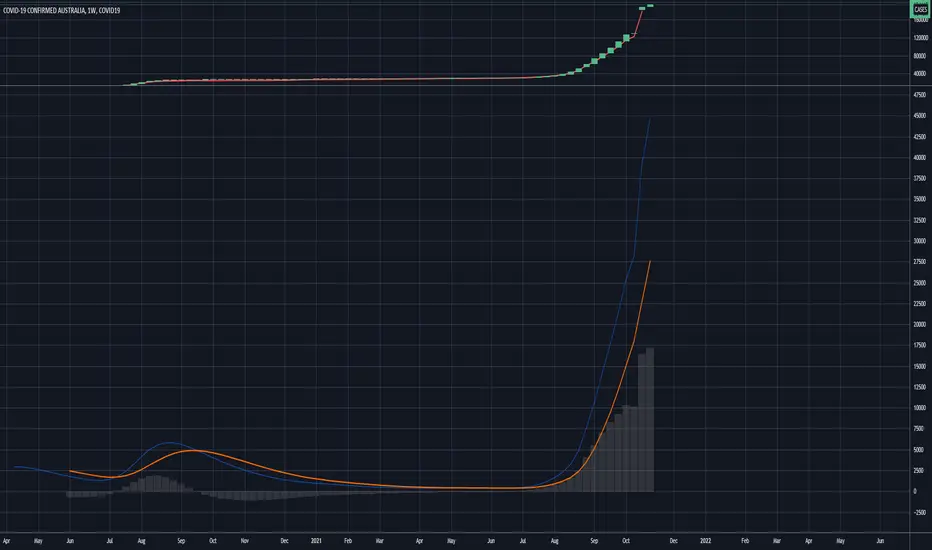
AUSTRALIA COVID-19: Too quiet about it.Based on the model, Australia is in an extended huge wave of COVID-19, which built up since its winter in June. the past two weeks spiked even more.
Interestingly, we hear very little about it. It did jump significantly over the past two weeks.
AUDUSD longHey Traders, today we are monitoring AUDUSD for a buying opportunity around 0.726 zone respecting the bullish trend in combination with the strong daily supply and demand zone. Once we will receive any bullish confirmation the trade will be executed.
Trade Safe, Joe.

The ASX looks goodMonthly chart for the ASX (Australian market)
Green ovals show the clear bull rejections along the major trendline which has been recently tested and is breaking out to the upside
I have labelled the chart patterns - I am unsure however if the 'Symmetrical triangles' are really that or Rising Wedges, so take that with a grain of salt

AUDUSD UPDATESHey Traders, in the coming week we are monitoring to add more position on our AUDUSD long term short, once we will receive any bearish confirmation the trade will be executed.
Trade safe and use proper risk management.
Joe.

EURAUD ShortHey Traders, in the coming week we will be focusing on the selling opportunity of EURAUD around 1.568. We expect a little pullback from 1,56 zone before the market continues bearish. Once we will notice any bearish confirmation the trade will be executed.
Trade Safe, Joe.

AUDCAD Hey traders, today we are monitoring AUDCAD for a selling opportunity around 0.9185 zone, once we will receive any bearish confirmation the trade will be executed.
Trade Safe, Joe.

AUDUSD ShortHey Traders, in this week we are monitoring AUDUSD for a selling opportunity around 0.747 Zone, once we will receive any bearish confirmation the trade will be executed.
Trade Safe and use proper risk management.
Joe.

REA - Cup and Handle PatternKey Technicals - High probability trade here with the REA chart showing a Cup & handle pattern. Looking to buy on breakout (top of cup) with above average volume or on the breakout retest as resistance becomes support.
Key Fundamentals - Governments likely make sure housing recovery keeps on keeping on.


FMG / Fortescue holding supportFortescue has been in a steady downtrend since the drop of iron ore prices in August. Since October, however, it was able to hold support at around 14 over and over again. With the recent drop in SGX:FEF1! this especially notable.
I am fundamentally bullish on Fortescue due to its fundamentals (balance sheet, green hydrogen ambitions, autonomous hauling) but it's hard to find a good entry point with iron ore prices plunging this rapidly.

AUS200 Creating a new high soonI believe the AUS200 is going to create a new high, it's finding support at the trend line indicated in the chart and it's clear that the risk on sentiments will continue through November.

AUDUSDHey Traders, we are monitoring AUDUSD for a selling opportunity around 0.755 zone, respecting the weekly downtrend in combination with the strong supply and demand zone. once we will receive any bearish confirmation the trade will be executed.
Trade Safe, Joe.

AUDUSD LongAUDUSD looking like it will continue to move higher. I am comfortable buying / adding to a long position here.
Look for commodity prices to continue moving higher as well.

AUDJPY SwingHey Traders, i'm monitoring AUDJPY for a buying opportunity around 85,00 zone in the daily supply and demand zone.
in the same time i still see some JPY bearish behavior in this period.
Once we will notice any bullish confirmation the trade will be executed!
Trade safe and use proper risk management.

AUDCADHey Traders, here is a technical view on AUDCAD and the most important zones to watch.
we're technically watching 0.92 zone for a long opportunity, once we will receive any bullish confirmation the trade will be executed.
Trade safe, Risk small, aim big.
Joe

Elliott move on AussieHere's an update going back from the move in my profile back in April.
In simple form here's the higher Timeframe view;
Then the 5 down giving a corrective move and fib levels back to the 1.618
New start on the smaller wave count;
Starting with the count - not a fan of the 0-1 move here; Meaning it could still be in corrective mode if we near the low again.
Extension sweet spot around 0.77720 level.
Pullback 4 would be worked out later (but forecast wise) I would guess here.
Thus giving a pattern up looking like this making it's 3rd wave completion.
Which means we are likely about to start the 4th wave of the inner move up.
Giving us a downside target here in this region.
Advanced Get showing a weekly 4 up here and we are inside the 3rd wave up (agreeing with the concept)
=============================================================================================
Which means my overall bias is long, but in the short term taking a short down an ABC on the smaller TF's and then long for the long run at the retracement low.
ALL RELATED IDEAS ARE EDUCATIONAL HERE
Disclaimer
This idea does not constitute as financial advice. It is for educational purposes only, our principle trader has over 20 years’ experience in stocks, ETF’s, and Forex. Hence each trade setup might have different hold times, entry or exit conditions, and will vary from the post/idea shared here. You can use the information from this post to make your own trading plan for the instrument discussed. Trading carries a risk; a high percentage of retail traders lose money. Please keep this in mind when entering any trade. Stay safe.

IT'S OVER FOR BITCOIN DON'T IGNORE THISI sold everything I have...
Look at that stickman..
Bang he hits the price to the floor...
This is top tier analysis...
Not Financial Advice..
