BTC - $6000 INBOUNDBitcoin - After 72 days in an Uptrend and crushing 180% is this time for a Major reversal?
- 180% Rise with no Major Retrace
- Daily Uptrend Broken
- Failed to Break Major EQ at 9250-9300
- Failed to break Center BB
- MACD continuing to spread
- Selling Volume returning to the market
- RSI Neutral and has room to move
- Short entered with stop loss above previous structure.
- Targets set at Fib Levels which also correspond with EQ's.
- This will now see us re enter the Descending Broadening Wedge which started in JULY 2019
These Ideas are NOT 'Financial Advice'!. Scenarios are based off a mixture of TA and Fundamentals current at the time. All IMO GLTAH. Happy Hunting!!!
Australian
AUD/USD daily- Ascending triangle Ascending triangle: Despite its reputation as a reliable chart pattern, it is a mediocre performer.
Upward breakout is 63% of the time and 62% of the way into the triangle on average.
From Thomas Bulkowski research. Further details in the link below:
thepatternsite.com
Two red arrows shows two past death crosses (50-day MA moving below 200-day MA). Still in bearish zone.
ASX200 daily- Rising Wedge+failed to break 38.2% Fib retracemASX200 daily- Rising Wedge + Failed to break 38.2% Fib retracement.
According to Thomas Bulkowski "Rising Wedges, especially for downward breakouts, are some of the worst performing chart patterns. Downward breakouts have an unacceptably high failure rate and small post breakout declines. Also, throwbacks and pullbacks occur 72% of the time."
Breakout for Rising Wedges: Can be in either direction, 60% of the time downwards.
AUD/USD LONG TRADEHI
NEWS:
-AUD/USD appears to be stuck in narrow range following the Reserve Bank of Australia (RBA) Minutes, but the exchange rate may exhibit a more bearish behavior over the coming days as the Relative Strength Index (RSI) snaps the upward trend carried over from the previous month
personal opinion:
-Depending on the demand, we expect another rise in the short term. However, if the rise can continue if the oil is accompanied by a decline, please deal with the stop loss and be careful.
Please follow my support and like my posts.
see you later
GOOD LUCK
AUD/USD TRADE HI
-The Australian Dollar turned lower after testing trend resistance guiding the currency downward against its US counterpart since the start of the year, as expected. Prices have now broken rising counter-trend support set from the March swing low. That suggests that the dominant bearish bias is set to be reasserted after a corrective recovery has run its course.
-Trader sentiment studies warning sellers to proceed with caution
-Price targets are specified in the chart
Follow me for support and like the posts.
see you later
GOOD LUCKY
Dark Times For The AUDLooking at my chart, it's clear that since the beginning of the chart to Dec '13 has been in an overall ascending wedge with two notable deviations.
One deviation in 2000 where a short sharp descending wedge took the AUD to the lowest point in 2001 before finally getting back to the ascending wedge by October 2003.
In 2008 it again briefly dropped during the GFC and quickly by 2009 returned to the ascending wedge pattern.
By 2013 the AUD begin descending and attempting to retest what was the support line of the ascending pattern.
From 2014-Now it's clear that the AUD is in a descending pattern and has broken through the support line on the Monthly candle.
Where it all goes from here depends on what the Australia Federal government can do, but with the fundamentals of Australia questionable I don't have high hopes.
What do I mean ? simply Australia is a wealthy country on paper, but the bulk of most peoples wealth is tied up in the value of their real estate, which has been inflated to insane levels due to access to cheap credit and very generous capital gains tax laws.
Most Australians are heavily reliant on overdrafts, credit cards, store cars, finance that most simply don't hoard that much cash.
Many people have gone and borrowed 100%+ the value of their properties, (I can assure you that bank valuers for real estate transactions are a fraud and they NEVER under value a property, it's an everyone wins game much like getting the real estate agent to recommend you a building inspector.)
Thing is that Australia outside of exporting it's mining resources, agriculture, tourism and education doesn't actually produce or make much anymore, much of the economy revolves arounds services.
Given current events with the Coronavirus epidemic and global shut down, this is going to paralyze the Australian economy if it continues for long.
Back in 2008 Australia was fortunate to have a cash reserve to weather the storm, this time around they are far more vulnerable with the national wealth build on a house of cards.
EurAud on 4hrs(Sell)Congrats on our previous 1 month swing buy to 1.63000. However now Back to resistance for another massive opportunity. so follow with current risk managements corresponding to law of support and resistance prior to neither support and resistance been broken then sell to C. following a buy to D following ABCD Pattern!
Australia! A Bogans ParadiseHello Traders,
Looking at the chart we can see price has been in a well defined channel for the last 10 years.
It has taken that long for the price to crawl back up to the previous 2007 top and I mean crawl. From an Elliot Wave perspective these are some unhealthy looking waves with deep retracements each time basically invalidating the EW principle. Either way, you can see some kind of 5 waves impulse pattern.
The price reached the previous market top which just so happened to coincide with the top of the channel. The price has tried again to push higher but failed and now looks like a double top and is printing bearish divergence on the RSI.
Can they just keep pushing this with QE?
I think we all know by now the economy is floating on a debt time bomb.
Australia's housing market is one of the biggest bubbles out there which has been fueled through terrible financial practices.
I think this economy is going Down Under!
Bearish on stralia.
Aud/Cad Forex NewsWelcome.
Hello everone here. I want today tell you guys. I change my nickname 'username' on Tradingview.
Tradingview thanks for that opportunity you made.
Let's go to trend.
Australian dollar this is period when it's ready check bellow zone. (Sell zone wit red mark).
Trend this pair looks like it's still growing pair. but If we check the big time period, there trend is not so strong for we can say It's strongly going up. Nope.
So That's my prediction about this pair.
Thanks for visit. read.
fxCROWN
AUDUSD I believe that the 200 EMA can act as a strong support because we see a lot of rejection from the downside and the bulls might win this battle for now
- On MACD indicator we can expect a crossover to the upside in about 8 hours
- The RSI is making higher lows and that IMO is a strength sign.
This is a possible scenario, wait for confirmation before entering a position.
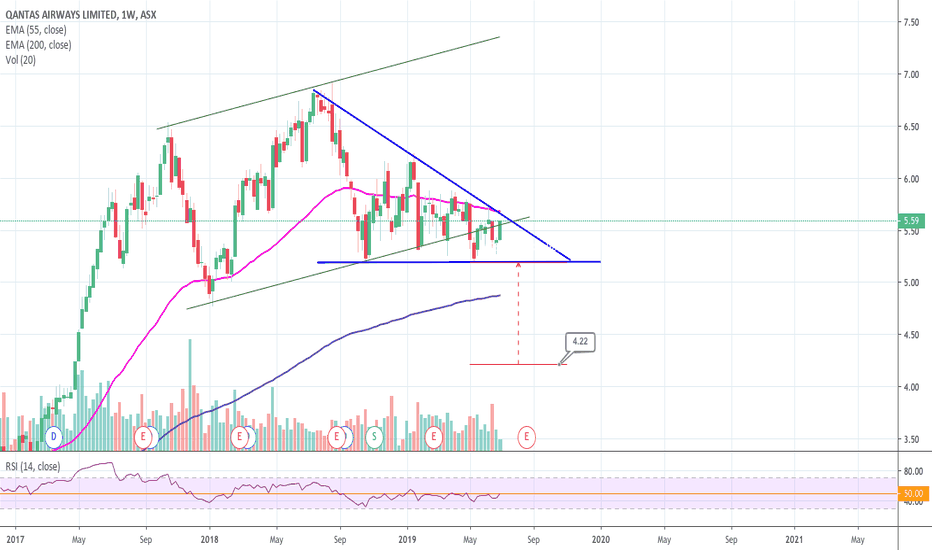
ASX:QANTAS - Running out of room on the weekly - Long termQantas ASX:QAN is running out of room in what seems like a descending triangle. If there's no break to the upside, expect more downward pressure to $4.22 in the coming months - long term outlook.
Due to the uncertainty of the market - trade wars and oil prices - a breakout in the coming weeks should also be taken with a pinch of salt as it might be a bull trap and may revisit $5.20. However, a break with conviction to the upside and doesn't look back will bring us to the top of the channel above $7.
A break below $5.20 invalidates this outlook.
"ASX in new highs since 2007: what's next?" by ThinkingAntsOkDaily Chart Explanation:
- Price is against the Weekly Ascending Trendline.
- Price is on a Micro Ascending Trendline.
- Bearish Divergence on MACD.
- If price breaks the Ascending Channel at 6740, potential to move down towards the Support Zone at 6400 and, then, to the Bottom of the Ascending Trendline at 5620.
Our Weekly View support this idea. Check it out!
Weekly Vision:
Updates coming soon!
AUDCAD has completed cypher a good long opportunityAfter formation of CRAB pattern the priceline of AUDCAD has formed cypher pattern on 12hr chart.
Now the price action has entered in potential reversal zone and from here it will hit the sell targets soon insha Allah.
The targets are:
Buy between: 0.91372 to 0.91090
Sell between: 0.91594 to 0.92128
Regards,
Atif Akbar (moon333)
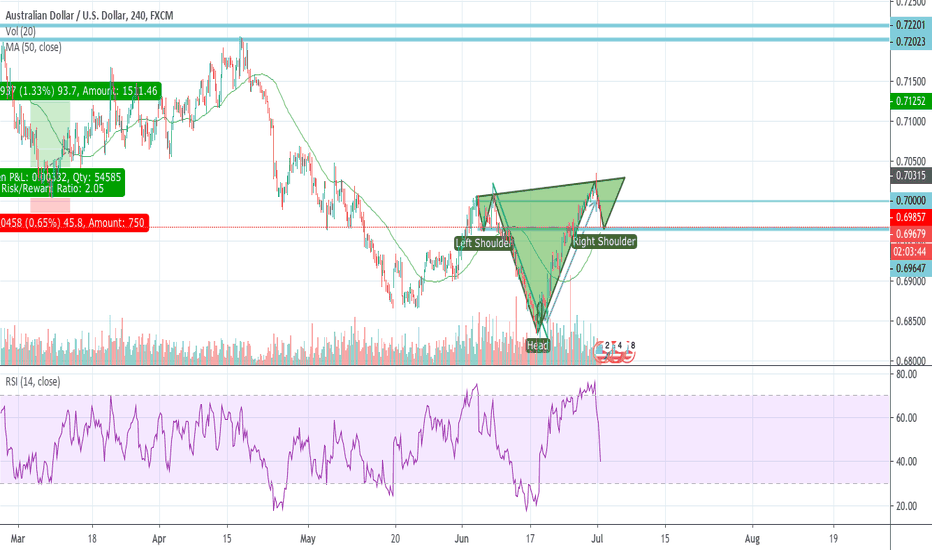
AUDUSD could drop between 0.6956 and 0.6863Aussie makes a very nice classic move - after breakdown it made a pullback (retest) and now it could drop
again to complete the entire correction and hit either 61.8% (.6956) or 78.6% (.6863) Fibonacci retracement levels.
That's why AUDNZD is in the red (see related)


