AUD USD - FUNDAMENTAL DRIVERSThe Pound and Euro could reach fresh multi-month highs against the U.S. Dollar this spring, although a lull in price action over the northern hemisphere's summer months would then be expected.
This is according to the analysis of W. Brad Bechtel, Global Head of FX at Jefferies LLC, which also warns of the potential for a more notable turn lower in the Dollar by year-end.
Bechtel has been watching the Dollar index - a measure of overall USD performance against a basket of major currencies - and finds the rise witnessed over recent days can continue, even if it is somewhat unconvincing.
"I am still of the view that we are likely to see some weakness in the USD in the medium term, but in the very short term DXY might get pulled just a bit higher first," says W. Brad Bechtel, Global Head of FX at Jefferies LLC.
Bechtel is watching U.S. interest rate markets as an explainer of the Dollar's performance as inflation narratives become "a thing again" .
"DXY made a double bottom around 100.80 for now but has not really participated in the rally as U.S. rates grind higher," says Bechtel.
U.S. two-year bond yields have been rising since the week of March 20, a development that would typically be expected to offer the U.S. Dollar support.
But, "in percentage retracement terms the USD is nowhere close to the 50% seen in the 2yr which tells me that there is some structural weakness in the USD out there still" .
"If this move in U.S. yields fizzles and starts to reverse lower again, then the USD will take out 100.80 pretty quick and EUR/USD will rise through 1.1100," predicts Bechtel.
The Dollar is expected to be the prime driver of where the Pound to Dollar exchange rate and other pairs trade over the coming weeks.
"In the end, EUR/USD will trade to 1.1250, GBP/USD 1.2700, AUD/USD through 0.7000, maybe up to 0.7200 eventually," says the Jefferies analyst.
The Dollar index is meanwhile expected to trade through 100.00 floor, but Jefferies' FX strategy team is not looking for "a huge break lower" .
"A move through 100.00 and then some range-bound activity as we push through the Summer," says Bechtel.
This suggests another leg higher in GBP/USD, EUR/USD, AUD/USD et al. is possible during spring, ahead of rangebound trade during the summer months (through to end-August).
"By end of Summer, we'll have a better view on where things stand with the US economy. Will the US economy roll over hard or will the Fed pull the rabbit out of its hat and have a soft landing," says Bechtel.
If the Dollar slides sharply into year-end and into next year "then we could enter a bigger down cycle in the USD, but I am reticent to make that call just yet," says Bechtel.
Australiandollar

AUDCAD: Bullish Reversal Confirmed?! 🇦🇺🇨🇦
AUDCAD reached a very important zone of confluence this week:
we see a perfect match between a key horizontal daily support and 618 retracement of the major bullish impulse.
The price formed a double bottom pattern on that and violated its neckline.
It looks like the market may go higher.
Goals: 0.9118 / 0.92
❤️Please, support my work with like, thank you!❤️

Audusd higher prices i have sent out weekly forecast on this one i have more updated pattern as the week goes by we see more looks clean i don't think it will break to the down side because of strong resistance also htf suggests bullish condition

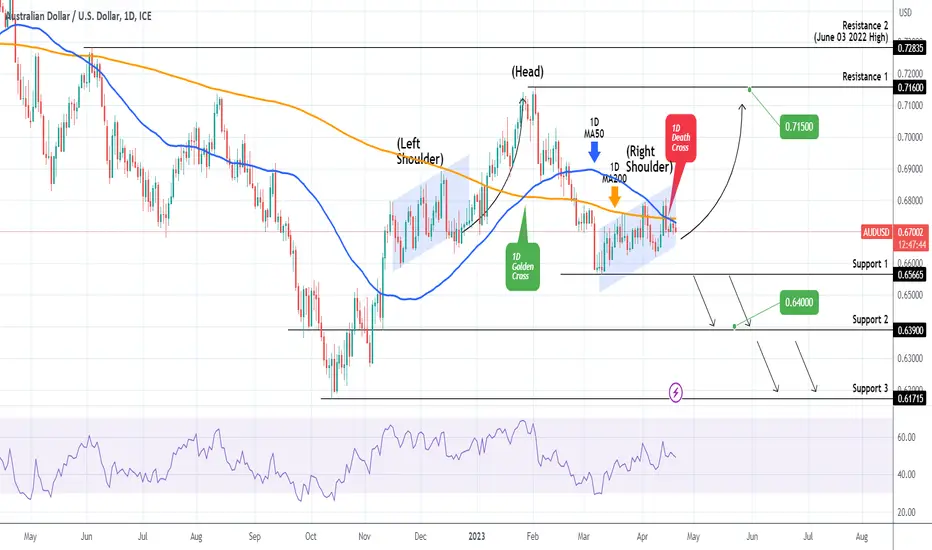
AUDUSD Head & Shoulders but don't sell until the Support breaksThe AUDUSD pair is forming a Head and Shoulders (H&S) pattern on the 1D time-frame, having also completed a Death Cross (1D MA50 crossing below the 1D MA200) three days ago. This is a technically bearish pattern. We will stay bullish however, targeting 0.71500 until Support 1 (0.65665) breaks. In that case we will target 0.64000.
-------------------------------------------------------------------------------
** Please LIKE 👍, FOLLOW ✅, SHARE 🙌 and COMMENT ✍ if you enjoy this idea! Also share your ideas and charts in the comments section below! **
-------------------------------------------------------------------------------
💸💸💸💸💸💸
👇 👇 👇 👇 👇 👇
AUDUSD: This Support is the pivot level we'll tradeAUDUSD is on neutral 1D technicals (RSI = 51.267, MACD = -0.001, ADX = 34.243) as it has been basically trading sideways for the past 30 days. The pattern looks a lot like the November/December 2022 Channel Up, which broke out to the R1. As long as the S1 holds, we will be buyers (TP = 0.71250). If the S1 breaks, we will take the loss and sell, targeting the S2 (TP = 0.62250).
Prior idea:
## If you like our free content follow our profile to get more daily ideas. ##
## Comments and likes are greatly appreciated. ##

AUDCHF: Your Trading Plan For Today 🇦🇺🇨🇭
AUDCHF is approaching a key horizontal resistance.
The price formed a double top on that on 4H.
0.6026 - 0.603 is its neckline.
To short with a confirmation, wait for a bearish breakout of a neckline.
4H candle close below will confirm a violation.
Short aggressively or on a retest then.
Goals will be 0.601 / 0.5995
If the price sets a new high, the setup will become invalid.
❤️Please, support my work with like, thank you!❤️

AUDNZD: Classic Breakout & Bullish Outlook 🇦🇺🇳🇿
AUDNZD broke and closed above a key horizontal supply area on a daily.
1.077 - 1.081 resistance turned into a demand zone now.
It looks like we see its retest soon.
A bullish impulse will be expected to 1.087 level then.
❤️Please, support my work with like, thank you!❤️

Audusd weekly forcasthello traders audusd i am expecting higher prices. this pair is correlated with gold let see how it plays out comment down below what you think

AUDJPY: Time For Correction 🇦🇺🇯🇵
AUDJPY reached a key level.
The market became relatively overbought and formed a tiny double top on 1H.
I expect a correctional move from the underlined zone at least to 89.38 / 89.0 levels.
❤️Please, support my work with like, thank you!❤️

AUDCHF: Trade around this trendline.The AUDCHF pair is trading inside a nearly 1 year Channel Down, with the 1D technicals obviously bearish (RSI = 35.683, MACD = -0.006, ADX = 40.124). We will trade according to whether the LL trendline holds or breaks. If it breaks, we will sell and target the bottom of the Channel Down (TP = 0.58000). If it holds, we will buy and target the 1D MA200 (TP = 0.62000).
## If you like our free content follow our profile to get more daily ideas. ##
## Comments and likes are greatly appreciated. ##

GBPAUD Buy the next pullback.The GBPAUD pair is on overbought 1D technicals (RSI = 70.497, MACD = 0.019, ADX = 49.220) with the price also close to the HH trendline of the past 9 months. We are buying the next pullback towards the S1 Zone and the 1D MA50, targeting R1 (TI = 1.9200).
## If you like our free content follow our profile to get more daily ideas. ##
## Comments and likes are greatly appreciated. ##

AUDUSD will fall by Head and Shoulders Pattern❗️❗️❗️AUDUSD managed to form a Head and Shoulders Pattern, and since the slope of the neckline is negative, it is more likely that the pattern is valid.
Also, two moving averages, 50-EMA and 50-SMA, created a ⬇️SELL⬇️ signal.
I expect AUDUSD to fall to the pattern target and 🟢heavy support zone($0.593-$0.55)🟢 after breaking the neckline and 🟢support zone($0.659-$0.652)🟢.
🔅Australian Dollar/U.S.Dollar Analyze ( AUDUSD ) Daily time frame⏰.
Do not forget to put Stop loss for your positions (For every position you want to open).
Please follow your strategy, this is just my idea, and I will be glad to see your ideas in this post.
Please do not forget the ✅' like'✅ button 🙏😊 & Share it with your friends; thanks, and Trade safe.

AUDUSD - BROKEN CHANNEL 🔥Hello Traders 💖
On The Daily Time Frame The AUDUSD Price Reached a Resistance Level!
Currently, The Price formed an Ascending Channel 📉
The Support Line of the channel is Broken🔥
So, I Expect a Bearish Move 📉
i'm Waiting for a Retest...
-----------
TARGET: 0.66090🎯
________
if you agreed with this IDEA, please leave a LIKE, FOLLOW or COMMENT!

AUD USD / AUD NZD - FUNDAMENTAL DRIVERSForeign exchange analysts at BNP Paribas suggest a bullish outlook for the AUD/USD and AUD/NZD exchange rates, citing global market stabilisation, the divergence between the Reserve Bank of Australia (RBA) and the Reserve Bank of New Zealand (RBNZ), housing market vulnerabilities, and seasonal performance in risky assets.
Global Markets Stabilizing and Impact on Exchange Rates
FX strategists at the French international banking group highlight that global markets have stabilised following financial stress in the financial sector. This stabilisation is expected to lead to a broad weakening of the USD and a recovery in equity-sensitive currencies trading near recent lows, such as the Australian Dollar to US Dollar exchange rate.
"Over the coming weeks, we see scope for equity-sensitive currencies trading near recent lows, such as AUDUSD, to recover in line with a broad weakening of the USD."
Global Risk Premium Index and Seasonal Performance
Saimbi points out that the BNP Paribas global risk premium index is at high levels, suggesting investor appetite is excessively low and therefore that risk-reward is attractive to add risk-on positions.
Additionally, BNP Paribas's seasonality analysis shows that in early April, risky assets tend to perform well, which may have a positive impact on the AUD/USD exchange rate.
"BNP Paribas’s seasonality analysis finds that in early April, risky assets tend to perform well."
Momentum to Sell USD
Saimbi indicates that recent data have led the market to further price out Fed tightening, and the USD's reaction to downside surprises has been marked. As a result, there is an appetite to build USD shorts, which may lead to a fast rally in the AUD/USD exchange rate.
"We believe this suggests the market could have a good appetite to build USD shorts here."
RBA and RBNZ Divergence
The divergence between the Reserve Bank of Australia (RBA) and the Reserve Bank of New Zealand (RBNZ) in terms of policy rates is a fast-growing theme in the FX markets. The RBA has kept policy rates unchanged at its last meeting, and Governor Lowe has suggested that rate increases are not over. In contrast, the RBNZ has been more hawkish, with markets pricing in a large degree of divergence between the two central banks.
"This means the market’s pricing for such a large degree of RBA divergence from the RBNZ may not be realised, especially considering its inflation projections are remarkably similar."
Housing Market Vulnerabilities
According to the analyst, the divergence between the RBA and RBNZ is even more unjustified when considering risks to Australia's economy from the housing market. Australia still has relatively large excess savings buffers accumulated during the pandemic, and debt service ratios may have only risen to pre-pandemic average levels.
"We find a smaller proportion of lower earners in Australia than elsewhere."
Australian Dollar Exchange Rate Forecasts
Saimbi suggests that with markets pricing in only about a 20% chance of a further 25bp hike from the RBA at the moment, risks appear more asymmetrically skewed to the upside. In contrast, the more hawkish RBNZ meeting (5 April) presented an opportunity to sell NZD.
The analyst recommends going long on the Australian Dollar to US Dollar exchange rate (AUD/USD) and the Australian Dollar to New Zealand Dollar exchange rate(AUD/NZD). This implies a bullish outlook for the AUD against the USD and NZD currencies.
"We think the pullback in AUDNZD presents an opportunity to buy the cross, given that we think the divergence currently priced in between the RBNZ and RBA is not likely to prove sustainable, especially as we judge New Zealand’s housing market to be more vulnerable than Australia’s."

AUDUSD: NFP Ahead! Bullish Outlook 🇦🇺🇺🇸
AUDUSD reached a solid rising trend line on a daily yesterday.
Analysing the intraday price action, we see some bullish clues:
the price formed a double bottom pattern on 1H time frame and broke a resistance line of a falling wedge pattern.
I will expect a pullback from the trend line to 0.6707 / 0.6724
❤️Please, support my work with like, thank you!❤️

AUDNZD: Rejected on the long term Pivot. Bearish.The AUDNZD pair is technically bearish on the 1D timeframe (RSI = 42.033, MACD = -0.005, ADX = 29.502), trading under the P1 Zone, which has been in place since 2021. It is under both the 1D MA50 and 1D MA200 and it targeting the HL trendline (TP = 1.05300). If the dashed LH trendline breaks, we will buy aiming at R1 (TP = 1.10800).
## If you like our free content follow our profile to get more daily ideas. ##
## Comments and likes are greatly appreciated. ##

AUDJPY - BEARISH MOVE !On The Daily Time Frame The AUDJPY Price Reached a Resistance Level!
Currently, The Higher Low of The Bullish Structure is Broken (Break of Structure)🔥
The Support Line is Broken 🔥
So, I Expect a Bearish Move 📉
i'm Waiting for a Retest...
-----------
TARGET: 86.880🎯
________
if you agreed with this IDEA, please leave a LIKE, FOLLOW or COMMENT!

AUDCAD: Selling is the best option on this Channel Down.AUDCAD is trading inside a Channel Down pattern with the 1D technicals bearish (RSI = 43.171, MACD = -0.004, ADX = 38.042). Even though the long term pattern is bearish, the rebound yesterday and closing over the 1D MA200 can be a bullish signal along with the HL that the RSI is on (bullish divergence). However until the 1D MA50 breaks, we cannot call for any upward movement on the long term.
We remain sellers on this pair, targeting S2 (TP = 0.89500).
## If you like our free content follow our profile to get more daily ideas. ##
## Comments and likes are greatly appreciated. ##

EURAUD: Bearish Outlook 🇪🇺🇦🇺
EURAUD is trading on a key weekly structure resistance.
Once the underlined area was reached, the pair started to trade within a horizontal range for 9 consequent trading days.
Its support was finally broken yesterday.
I think that the pair may drop now.
Targets: 1.593 / 1.5717
❤️Please, support my work with like, thank you!❤️

EURAUD - Bearish Rising Wedge 📉Hello Traders!
On The Weekly Time Frame The EURAUD Price Reached a Major Key Level !
Currently, The Price formed a Rising Wedge Pattern 📈
The Support Line of the Pattern is Broken 🔥
So, I Expect a Bearish Move 📈
i'm Waiting for a Retest...
-----------
TARGET: 1.59190
________
if you agreed with this IDEA, please leave a LIKE, FOLLOW or COMMENT!

AUDCADGood Night :)
AUDCAD has been examined in different dimensions:
1- Strong supply and demand levels that I identify with my own indicator and system.
2- The structure of recently formed waves
3- Current market momentum
4- The structure of classical and price patterns
In this idea, I identified the direction of the market in different ways and in the second step, I analyzed the potential of continuation or reversal. Usually, paying attention to the trend and strength of the trend can greatly increase the accuracy of the analysis.
In general, I tried to describe the continuation of the movement in the simplest possible way in the diagram.
⚠️ Disclaimer:
This is a personal opinion and you are responsible for any trading decisions.

AUDUSD: Bearish signal below 0.6680AUDUSD pair successfully broke below the wedge pattern as I mentioned in the previous analysis. However, it seems that more liquidity is needed to support the downward movement. It's likely that the price will undergo a corrective movement towards the level of 0.6680, which is a very important level where the broken trendline, Fibonacci level 23.60, and the moving averages 50 and 100 on the 4-hour timeframe converge. Additionally, the point of control (POC) is also located at that level, as shown on the volume profile indicator. Any sign of reversal from this level will be considered a bearish signal towards 0.65970.
-------------------------------------------------------------------------
Let me know your thoughts in the comments, and show your support by liking the idea.
Please follow if you're interested in more ideas like this.
Your support is greatly appreciated!

AUDUSD - New Breakout !on the daily Time Frame The AUDUSD Price Reached a Resistance Level !
Currently, The Price Broke The Higher Low and Broke The Support Trendline 🔥
So, I Expect a Bearish Move 📉
i'm waiting for a retest...
-----------
TARGET: 0.66085🎯
___________
if you agreed with this IDEA, please leave a LIKE, SUBSCRIBE or COMMENT!
