Today’s Notable Sentiment ShiftsUSD – The dollar came under pressure on Monday as US Treasury yields slipped following a blow to Democratic spending plans in Washington and on concerns about the continued spread of the Omicron coronavirus variant.
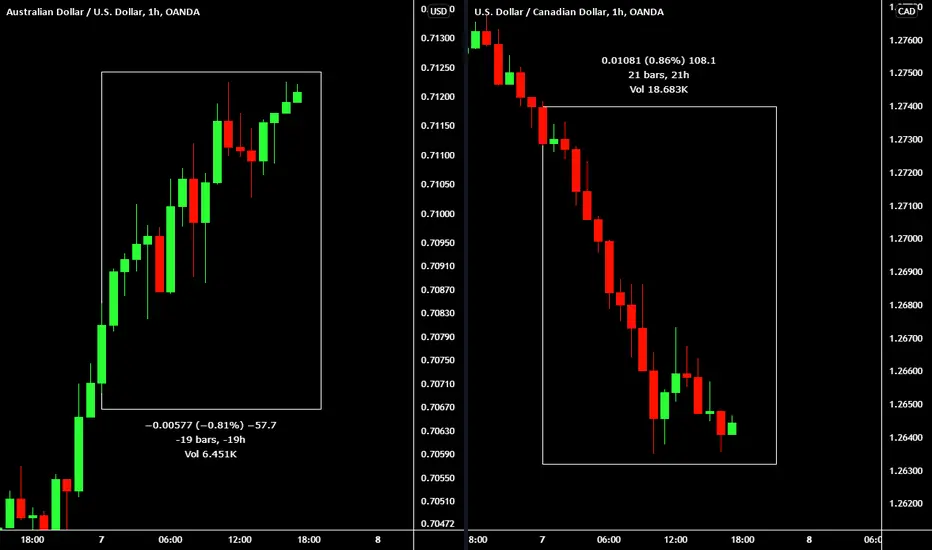
High Beta – AUD, NZD and CAD all came under pressure on Monday, with the latter falling to its lowest level against USD for the year, as rising concerns over the Omicron variant continued to weigh on risk sentiment.
Indeed, MUFG noted that “investor risk sentiment has been undermined by further evidence over the weekend of the disruptive impact of the new Omicron COVID variant.” Adding that concerns of further curbs being imposed in Europe has also weighed on investors’ appetite for riskier currencies.
Australiandollar

AUDNZD: Be Prepared For a Reversal 🇦🇺🇳🇿
Top-down analysis on AUDNZD.
Key levels & price action.
Trading plan explained.
❤️Please, support this idea with like and comment!❤️

AUDUSD ShortHey Traders, in today's trading session we are monitoring AUDUSD for a selling opportunity around 0.714 zone. Once we will receive any bearish confirmation the trade will be executed.
Trade safe, Joe.

EURAUD: Very Bullish Outlook | Top-Down Analysis 🇪🇺🇦🇺
Multiple time frame analysis on EURAUD:
Daily/4h/1h
Price action & key levels.
Long trade explained.
❤️Please, support this idea with like and comment!❤️

AUD JPY - FUNDAMENTAL DRIVERSAUD
FUNDAMENTAL BIAS: NEUTRAL
1. Monetary Policy
In Dec the RBA kept rates at 0.10% and weekly bond purchases at A$4bln until mid-Feb, as expected. They reiterated that they are committed to maintaining highly supportive monetary conditions and won’t raise rates until actual inflation is sustainably within their 2%-3% target range. They noted that the economy is recovering from the Delta slowdown and is expected to return to pre-Delta path in 1H22. The positive take away from the meeting was that the Omicron variant is not expected to derail the recovery. The bank said they’ll consider the future of their QE program at the Feb meeting. Furthermore, the bank also outlined their criteria for deciding on the future of bond purchases, which include actions of other central banks, bond market functioning and actual and expected progress towards the goals of full employment and inflation consistent with the target. All in all, the bank still had a dovish stance but was more optimistic about the economy than expected.
2. Economic & Health Developments
There are 4 key drivers we are watching for Australia’s med-term outlook: The virus situation – so far, the RBA is positive about the post-Delta recovery, so incoming data will be crucial to see whether that optimism is justified. China – After months of waiting, the PBoC finally stepped up with easing & news of fiscal stimulus coming in early 2022 is a very important positive development for the AUD. Politically, the recent AUKUS defence pact could see retaliation from China against Australian goods. Commodities – Iron Ore, (24% of exports) and Coal prices (18% of exports) are important for terms of trade, and with both of them pushing higher on the PBoC easing, that is a positive for the AUD. Global growth – as a risk proxy, where the global economy goes from here will be another important consideration for AUD, with more focus on China though.
3. Global Risk Outlook
As a high-beta currency, the AUD benefited from the market's improving risk outlook coming out of the pandemic as participants moved out of safe-havens. As a pro-cyclical currency, the AUD enjoyed upside alongside other cyclical assets supported by reflation and post-recession recovery best. If expectations for the global economy remains positive the overall positive outlook for risk sentiment should be supportive for the AUD in the med-term, but recent short-term jitters are a timely reminder that risk sentiment is also a very important short-term driver.
4. CFTC Analysis
Latest CFTC data showed a positioning change of -1607 with a net non-commercial position of - 81792. As outsized net-shorts are usually seen as a contrarian indicator we want to be mindful of potential squeezes, which means the AUD is likely to be more sensitive to positive data than negative data. The recent positives from China already saw shorts being squeezed last week, and as long as Omicron doesn’t cause a global meltdown the prospects is looking better for the AUD into 2022.
5. The Week Ahead
In the week ahead the main drivers for global markets will of course be the huge amount of central bank meetings, so risk sentiment will be important for the AUD on the back of that. Specifically for Australia, the markets will of course be watching the virus front with any outbreaks of the Omicron variant could see markets expect more restrictions for Australia. On the data front there will be a lot of focus on the employment report as it’s a key consideration for the RBA, not only for rates but also regarding the QE. Expectations are for a print of 200k, and an Unemployment Rate drop to 5.0% from 5.2%. As always there will be more focus on the full-time component. Even though one employment print isn’t going to immediately change the RBA’s mind, a very solid print would
probably be enough to see a further unwind in those stretched shorts and could provide a decent short-term lift for the AUD this week.
JPY
FUNDAMENTAL BIAS: BEARISH
1. Monetary Policy
At their Oct meeting the BoJ left policy settings unchanged with rates kept at -0.10% and the JGB yield target kept close to 0%. As usual we saw BoJ’s Kataoka as the only dissenter on YCC. In terms of the economic projections, the bank lowered both their growth and inflation targets as was previously reported prior to the meeting. The bank lowered FY2021 GDP to 3.4% from the prior
3.8%, and lower FY2021 Core CPI to 0.0% from the previous 0.6%. The bank’s outlook report once again explained that Japan’s consumer inflation is likely to gradually grind higher and noted that exports and output are currently weak due to the ongoing supply constraints. However, as with their prior meeting the bank explained that both exports and output is increasing as a trend. At the press conference, Governor Kuroda said that a soft JPY raises costs for households and imports but that he does not think current JPY weakness is a bad thing. He further added that it is desirable for FX to move in a stable manner, reflecting fundamentals and that he thinks the JPY’s current price action reflects the fundamentals. The Governor also added that YCC could lead to a weak JPY as it widens interest rate differentials.
2. Safe-haven status and overall risk outlook
As a safe-haven currency, the market's risk outlook is the primary driver of JPY. Economic data rarely proves market moving; and although monetary policy expectations can prove highly market-moving in the short-term, safe-haven flows are typically the more dominant factor. The market's overall risk tone has improved considerably following the pandemic with good news about successful
vaccinations, and ongoing monetary and fiscal policy support paved the way for markets to expect a robust global economic recovery. Of course, there remains many uncertainties and many countries are continuing to fight virus waves, but as a whole the outlook has kept on improving over the past couple of months, which would expect safe-haven demand to diminish and result in a bearish outlook for the JPY.
3. Low-yielding currency with inverse correlation to US10Y
As a low yielding currency, the JPY usually shares an inverse correlation to strong moves in yield differentials, more specifically in strong moves in US10Y. However, like most correlations, the strength of the inverse correlation between the JPY and US10Y is not perfect and will ebb and flow depending on the type of market environment from a risk and cycle point of view. With the Fed
tilting more aggressive, we think that opens up more room for curve flattening to take place with US02Y likely pushing higher while US10Y underperform. In this environment we do see some mild upside risks for the JPY, but we should not look at the influence from yields in isolation and also weigh it up alongside underlying risk sentiment.
4. CFTC Analysis
Latest CFTC data showed a positioning change of +15785 with a net non-commercial position of - 63081. The risk off tones during the past two weeks and the subsequent gains in the JPY showed why stretched positioning is such an important consideration. Even though the JPY’s med-term outlook remains bearish, the big net-shorts for both large speculators and leveraged funds always increases the odds of mean reversion when risk sentiment deteriorates. However, the size of the recent unwind has been substantial and leaves room for some downside if risk assets can continue their recovery that started last week.
5. The Week Ahead
In the week ahead the main drivers for global markets will of course be the huge amount of central bank meetings, so risk sentiment will be important for the JPY on the back of that. We also have the BoJ coming up later in the week, but as usual markets are not expecting the bank to create any meaningful volatility for the JPY. With Omicron on the radar, the bank has yet another excuse to just keep the gravy train running as they’ve done for the past three decades which means the bigger influence for the JPY in the week ahead will be risk sentiment and of course US yields.

AUDUSD Target Price 0.71867Australian Dollar / U.S. Dollar foreign currency pair is bullish on the 30 minute time frame.

GBPAUD: Potential Trend-Following Trade Explained 🇬🇧🇦🇺
GBPAUD is very bullish from the beginning of November.
Setting a new high the pair retraced.
The market is approaching a key level at the moment.
To buy it with confirmation, watch a double bottom formation on 1H time frame.
1.844 - 1.85 is its neckline.
Your trigger to buy is an hourly candle close above that.
Then you buy aggressively or on a retest.
First goal - 1.855
In case of a bearish breakout of a blue zone,
the setup will be invalid.
❤️Please, support this idea with like and comment!❤️

AUD CAD - FUNDAMENTAL DRIVERSAUD
FUNDAMENTAL BIAS: NEUTRAL
1. Monetary Policy
The RBA’s Nov decision was hawkish in deed but dovish in word. The bank abandoned YCC as markets suspected as the bank didn’t defend their 3-year AGB target in the days leading into the meeting. They also abandoned their date-based forward guidance that said a lift off in rates would only be appropriate in 2024, by rather saying that conditions for a hike will take ‘some time’. However, Governor Lowe tried his best to sound as dovish as possible saying they are prepared to look through temporary spikes in inflation and that market pricing for a hike by 2022 is far away from where their outlook is and is highly unlikely. Even though not all market participants would agree, we think the outlook for growth, inflation, employment, and wages suggest a late 2022 hike could be possible, especially if the economy sees a solid bounce after covid. However, for now, the bank has stuck to an overall dovish tone. Given the importance of wages to their inflation outlook, keeping close track of incoming macro data for both will be important.
2. Economic & Health Developments
There are 4 key drivers we are watching for Australia’s med-term outlook: The virus situation – with Q3’s contraction out of the way, markets are watching Q4 data looking for signs of a strong rebound. Any good news of reduced restrictions will be important. China – the slowdown in China is important as it’s Australia’s biggest export destination. Markets are watching to see whether
the CCP or PBoC steps up with stimulus for the economy which will be seen as a positive for the AUD. Politically, the recent AUKUS defence pact could see retaliation from China against Australian goods. Commodities – Iron Ore, (24% of exports) continues its decline, and Coal prices (18% of exports) are down from YTD highs as well. This is negative for terms of trade and a risk to keep on
the radar. Global growth – as a favourite risk proxy, and closely tied to China, the market’s current question about whether we see reflation in Q4 will be an important consideration for the AUD.
3. Global Risk Outlook
As a high-beta currency, the AUD benefited from the market's improving risk outlook coming out of the pandemic as participants moved out of safe-havens. As a pro-cyclical currency, the AUD enjoyed upside alongside other cyclical assets supported by reflation and post-recession recovery best. If expectations for the global economy remains positive the overall positive outlook for risk sentiment should be supportive for the AUD in the med-term, but recent short-term jitters are a timely reminder that risk sentiment is also a very important short-term driver.
4. CFTC Analysis
Latest CFTC data showed a positioning change of -16920 with a net non-commercial position of - 80185. With the recent risk off rout in markets the AUD has once again shifted to the highest held net-short among large specs and the 3rd largest net-short for leveraged funds. As outsized net-shorts are usually seen as a contrarian indicator we want to be mindful of potential squeezes, which means the AUD is likely to be more sensitive to positive data than negative data.
5. The Week Ahead
The main calendar event for the AUD in the week ahead is Tuesday’s upcoming RBA meeting where markets are largely expecting the bank to stick to their overall dovish tone, especially with the recent Omicron variant giving the bank enough reasons to stick to a patient and accommodative stance. Also keep in mind that recent incoming data has been fairly mixed with better-than-expected Q3 GDP at -1.9% versus expectations of -2.7% and Retail Sales topping estimates at 4.9% versus expectations of 2.5% BUT the latest jobs data disappointed with the Employment Change revealing a surprise contraction and Unemployment jumping to 5.6% from 4.6%. So, no reason for the RBA to change much for the upcoming meeting.
CAD
FUNDAMENTAL BIAS: WEAK BULLISH
1. Monetary Policy
At their Oct meeting the BoC surprised by putting an early end to QE purchases and updated forward guidance to suggest an earlier lift off in rates by projecting economic slack to be absorbed by the middle quarters of 2022. The initial reaction was bullish as one would expect but the biggest risk to further upside for the CAD from here is the fact that a lot of these positives that was confirmed by the BoC has already been reflected in both the CAD and rates markets over the past few weeks. The CAD has seen a similar run to the upside back in 1Q21 with the BoC’s hawkish tilt, and similarly to that we feel current prices for rates and the CAD already reflect a great deal of the positives. Thus, even though the med-term outlook remains tilted to the upside for the CAD, there is the risk of seeing some unwind of the recent upside and is something to be mindful of when making any medterm allocations to the upside in the CAD. Last week’s Oct CPI data was a good example of this where the currency saw outsized downside on an uninspiring print. It’s not that CPI was bad, it was broadly in line with expectations, but with all the positives already priced it would have taken a really exceptionally strong print to keep the CAD’s upside momentum going. Another interesting driver for the months ahead, which could put a break on the BoC’s hiking path, is the close to 350% debt to GDP for Canada, which will make it very painful if rates start rising and for some like HSBC means the hike cycle could be very short.
2. Intermarket Analysis Considerations
Oil’s massive post-covid recovery has been impressive, driven by three drivers: supply & demand (OPEC’s production cuts); improving global economic outlook and improving oil demand outlook, even though slightly pushed back by Delta concerns; rising inflation expectations. Even though further gains for Oil will arguably prove to be an uphill battle, the bias remains higher in the medterm as long as current supportive factors and drivers remains intact. Oil prices rallied after the US’s SPR release failed to spark any meaningful follow through, but last week’s covid scare was enough to see WTI drop over 12% in the session. Thus, this week’s upcoming OPEC meeting will be very important, as any announcement to pause planned productions cuts could spark some additional upside again.
3. Global Risk Outlook
As a high-beta currency, the CAD benefited from the market's improving risk outlook coming out of the pandemic as participants moved out of safe-havens. As a pro-cyclical currency, the CAD enjoyed upside alongside other cyclical assets supported by reflation and post-recession recovery best. If expectations for the global economy remains positive the overall positive outlook for risk sentiment should be supportive for the CAD in the med-term, but recent short-term jitters are a timely reminder that risk sentiment is also a very important short-term driver.
4. CFTC Analysis
Latest CFTC data showed a positioning change of -10940 with a net non-commercial position of - 14075. A lot of the previous froth that was priced into the CAD just a few weeks ago has arguably been substantially reduced given the oil and Omicron related downside in risk assets over the past few sessions. That means buying opportunities is starting to look attractive again.
5. The Week Ahead
The main calendar event for the CAD in the week ahead is Wednesday’s upcoming BoC meeting. At the meeting markets will be focused on whether the recent Omicron variant is of any major concern to the BoC and whether the bank is also growing more concerned about inflation like the Fed. With the overall economic outlook evolving broadly in line with the bank’s MPR, there is expectations that the bank could err on the hawkish side despite the Omicron concerns, which should be positive for the CAD. Attention will be placed on any comments regarding the output gap to see whether the bank sees the gap being closed earlier (possibly Q1) which would imply the bank is bringing forward hike projections.

AUD USD - FUNDAMENTAL DRIVERSAUD
FUNDAMENTAL BIAS: NEUTRAL
1. Monetary Policy
The RBA’s Nov decision was hawkish in deed but dovish in word. The bank abandoned YCC as markets suspected as the bank didn’t defend their 3-year AGB target in the days leading into the meeting. They also abandoned their date-based forward guidance that said a lift off in rates would only be appropriate in 2024, by rather saying that conditions for a hike will take ‘some time’. However, Governor Lowe tried his best to sound as dovish as possible saying they are prepared to look through temporary spikes in inflation and that market pricing for a hike by 2022 is far away from where their outlook is and is highly unlikely. Even though not all market participants would agree, we think the outlook for growth, inflation, employment, and wages suggest a late 2022 hike could be possible, especially if the economy sees a solid bounce after covid. However, for now, the bank has stuck to an overall dovish tone. Given the importance of wages to their inflation outlook, keeping close track of incoming macro data for both will be important.
2. Economic & Health Developments
There are 4 key drivers we are watching for Australia’s med-term outlook: The virus situation – with Q3’s contraction out of the way, markets are watching Q4 data looking for signs of a strong rebound. Any good news of reduced restrictions will be important. China – the slowdown in China is important as it’s Australia’s biggest export destination. Markets are watching to see whether the CCP or PBoC steps up with stimulus for the economy which will be seen as a positive for the AUD. Politically, the recent AUKUS defence pact could see retaliation from China against Australian goods. Commodities – Iron Ore, (24% of exports) continues its decline, and Coal prices (18% of exports) are down from YTD highs as well. This is negative for terms of trade and a risk to keep on the radar. Global growth – as a favourite risk proxy, and closely tied to China, the market’s current question about whether we see reflation in Q4 will be an important consideration for the AUD.
3. Global Risk Outlook
As a high-beta currency, the AUD benefited from the market's improving risk outlook coming out of the pandemic as participants moved out of safe-havens. As a pro-cyclical currency, the AUD enjoyed upside alongside other cyclical assets supported by reflation and post-recession recovery best. If expectations for the global economy remains positive the overall positive outlook for risk sentiment should be supportive for the AUD in the med-term, but recent short-term jitters are a timely reminder that risk sentiment is also a very important short-term driver.
4. CFTC Analysis
Latest CFTC data showed a positioning change of -16920 with a net non-commercial position of -80185. With the recent risk off rout in markets the AUD has once again shifted to the highest held net-short among large specs and the 3rd largest net-short for leveraged funds. As outsized net-shorts are usually seen as a contrarian indicator we want to be mindful of potential squeezes, which means the AUD is likely to be more sensitive to positive data than negative data.
5. The Week Ahead
The main calendar event for the AUD in the week ahead is Tuesday’s upcoming RBA meeting where markets are largely expecting the bank to stick to their overall dovish tone, especially with the recent Omicron variant giving the bank enough reasons to stick to a patient and accommodative stance. Also keep in mind that recent incoming data has been fairly mixed with better-than-expected Q3 GDP at -1.9% versus expectations of -2.7% and Retail Sales topping estimates at 4.9% versus expectations of 2.5% BUT the latest jobs data disappointed with the Employment Change revealing a surprise contraction and Unemployment jumping to 5.6% from 4.6%. So, no reason for the RBA to change much for the upcoming meeting.
USD
FUNDAMENTAL BIAS: WEAK BULLISH
1. Monetary Policy
Another bank that was hawkish in deed by dovish in word in their Nov policy decision. The Fed announced tapering as expected, with purchases to be reduced at a pace of $10bln in Treasuries and $5bln in MBS per month and explained that a mid-2022 conclusion is their base case. There were also some hawkish language changes about inflation, with the bank dropping previous comments that called inflation transitory and replacing it with ‘expected to be transitory’, basically leaving some optionality to pivot more aggressively with tapering should price pressures stay sticky for too long. However, Fed Chair Powell did a really good job to put on a familiar dovish front by explaining that they see the current price pressures as driven by supply bottlenecks and still see those pressures cooling down in in 1H22, essentially giving themselves half a year of ‘tolerating’ the current inflation overshoot. Apart from that, Chair Powell explained that they would need to see maximum employment before their conditions for a lift off in rates would be met, and also explained that it’s likely that full employment could be reached by mid-2022. That endorsed the idea that a 2h22 hike is possible, but the Chair refused to provide any idea of what maximum employment would look like. On the rate front, Powell also explained that they think they can be patient with rates right now as they want more time to see in what shape the economy is in after the current covid shocks have calmed and after bottlenecks have eased. Overall, a policy meeting that was hawkish in their actions but dovish in their words.
2. Real Yields
With a Q4 taper start and a faster 2022 taper on the table, further material downside in real yields looks like a struggle, and upside from here should be supportive for the USD. However, we are growing cautious of nominal yields right now as an aggressive Fed is not a positive for US10Y. But it also means there are risks that inflation expectations fall and place upside pressure on real yields.
3. Global Risk Outlook
Based on the recent global economic data the expectations of a possible reflationary setup have developed as the Citi Economic Surprise Index continues to push higher. Even though this was seen as a possible negative for the USD, the recent hawkish tilt from the Fed (accompanied by the Omicron variant) has seen drastic curve flattening in anticipation that the Fed might be on its way to a policy mistake, and we could see a possible repeat scenario like we had back in 4Q18. If that happens, it should be an additional tailwind for the USD, which means for now a lot of hinges on the new variant.
4. CFTC Analysis
Latest CFTC data showed a positioning change of +104 with a net non-commercial position of +35879. USD longs are looking stretched, and arguably have been looking stretched for the past few weeks. With large speculators at their highest level since 2019, there is some scope for some mean reversion lower in the USD. It’s also important to remember that a lot of the Fed hawkishness should now be reflected in the price. The biggest risk to upside is if the med-term growth and inflation outlook materially deteriorate from here.
5. The Week Ahead
With Fed Chair Powell already giving the markets the prewarning of a faster tapering decision next week, there isn’t much that will change that with this week’s line up of economic data. The biggest even will no doubt be the CPI print on Friday, where markets are expecting a new cycle high for consumer prices. With so many expectations baked in for the Fed and with so many higher inflation projections doing the rounds, the highest tradable event for the USD this week would be a huge surprise miss as that will catch everyone by surprise and offer some decent downside in the short-term for the USD. Even though a beat in the CPI data should see
further expectations of tighter policy, markets are so close to pricing in 3 hikes for next year again which means the upside on a beat might be more limited compared to the Nov CPI print.

Today’s Notable Sentiment ShiftsAUD – The Australian dollar rallied to a one-week high on Tuesday, supported by the risk-on tone throughout the day’s sessions and an overall positive tone from the RBA at their December policy meeting.
Scotiabank noted that “The Australian dollar is leading gains among the major currencies on the session following comments from the RBA indicating that it did not expect the Omicron variant to derail the recovery… That seems to be developing into a broader working theory for markets as the variant appears – at the moment – to be more infectious but less than the Delta variant.”
CAD – The Canadian dollar strengthened to a two-week high against its US counterpart on Tuesday as concern about the economic threat of the Omicron coronavirus variant receded, and data showed Canada posted its biggest trade surplus in nearly a decade.
Chief analyst at Forexlive, Adam Button, argues that “the market is taking an optimistic view of the severity of the Omicron variant and the Canadian dollar is benefiting from that… There are signs that central banks aren’t overly concerned about Omicron, and that may translate into a hawkish Bank of Canada.”
"AUDUSD" Resistance and support zonesThe price is in a certain downward trend. Due to the strong saturation of sales, some upward correction is expected, but after that, in the re-introduced zone, we expect a decline to the specified price floor.

AUDUSD 06/12Looking to Short AU on retest of support-turned-resistance level of 0.70500
4H Timeframe Confluences:
- Bearish market structure, as LLs and LHs are being printed
- Last week AU closed with a strong bearish push, looking for a spike into our sell zone then a continuation to the downside

AUDCHF: Key Level & Your Trading Plan 🇦🇺🇨🇭
Hey traders,
Like many swiss pairs, AUDCHF is on a key level at the moment.
Depending on the reaction of the price to that structure we will either see a pullback or a strong bearish wave.
Your confirmation to buy will be a bullish breakout of a falling wedge pattern on 4h.
You need at least a 4H candle close above to validate the breakout.
Then a pullback to 0.6595 will be expected.
In case of a bearish breakout of a blue zone on a daily, a bearish continuation will be expected.
❤️Please, support this idea with like and comment!❤️

AUDUSD, is now on a monthly support zoneFor 33 days AUDUSD has been on a downtrend and now it reached a strong monthly support zone, the conversion line and base line in ichimoku are starting to go horizontally which kind of signals the end of the downtrend, also the blue line in stoch RSI cut the red line upwards. Seems like we can go long on AUDUSD for a couple of days.
Guys I'll be happy to have your comments about this and learn from you as well.
Have a good trading!

audusdhi everyone if this channel break we have sideway market . if price break this support and pull back after that you have see a candle that show you bearish power you can trade short until 0.69900
be careful .

AUDUSD Analysis WeeklyComparable points in green
Extremely similar, the only difference I can spot is the second one is above the 200MA
while the first is below
I do expect upsides as it moves out of the circle
