Australianmarket
NOT OVER YET, ONE MORE DAY TO GO & PROTECT 5836 $XJO On 26 August 2020,
$XJO was at 6161 and I said we will pull back to the moving averages and a big breakout will come...
The 2 day chart have shown us we have broke down to the down side.
This week, I said we need to close above 5836 on the weekly to stay bullish.
We did that.
However, it is not over yet.
The 2 day candlesticks DID NOT CLOSE this week , it will close next Monday and start a new candlestick on Tuesday 22/09/2020.
Furthermore, we have closed below all three moving averages 20,50,200 and from the past more downside will come in the coming days/weeks.
Therefore,
Monday will be a very important trading day,
Long - Close above 5919
Short - Close below 5836
If close below 5836, the 0.50 Fibonacci Retracement level is my next support....
ASX200 $XJO Are we heading for a bear market? Good Evening, investors and traders, the Asx200 $XJO went lower again due to market uncertainty with the coronavirus.
Last week, I said if we breach the 50 moving average, the first level of support is around 6300-6400.
The market went straight down to 6259.9 on Monday and traded sideways between 6259-6500 for a few days and eventually making a new low of 6216 at Friday's close.
Next week, I am watching 5800-6100 as a very important area of support. (Currently, I do forecast a dead cat bounce from there)
Furthermore, the ASX200 $XJO must close above or near the 200 MA (red line). If not, we are more likely heading for a bear market.
One important thing to keep in mind is that the VIX is at a bearish high reading.
This tells the mid-large fund organizations such as investment banks and hedge funds to reduce risk and exposure in their long/short portfolios.
The good news is that we do have a TD 9 coming for the Vix and this signal a likely top for the short term.
Therefore, like the hedge funds and investment banks,
I am still only risking a small amount of money in the market. I will go big again WHEN the Vix is below 15 and price level can close above all moving averages. At the moment this price area is around 6666-6800.
Glossary:
VIX
The S&P/ASX 200 VIX Index ( XVI ) calculates the amount of volatility expected in the market over the next 30 days.
• High readings indicate uncertainty ( bearish ) 20-30
• Normal readings suggest a slight bullish bias 15-20
• Low readings indicate low volatility ( bullish ) and strong investor confidence. <14.99
Bear market
A bear market is a condition in which securities prices fall 20% or more from recent highs amid widespread pessimism and negative investor sentiment.
ASX: Australian stocks in need of a stronger pull back.The Australian stock market (AXJO) is currently rising after a strong pull back that took place in July. This rejection happened because the market reached its All Time Highs of October 2007. Despite the rather strong selling manner in which it was conducted, we believe that this sell sequence is not over yet and a stronger correction is needed.
The reason for this perspective is that the very same long term pattern on the 1W time-frame has been spotted back in 1994, when the ASX again pulled back after testing its (then) All Time High. The selling only stopped when the 1W MA200 came in for support.
We are expecting a similar price action and even though the correction on 1994 was more than -20% we expect this time just the 1W MA200 to be enough to support and initiate then next long term bullish leg. Use this pattern according to your own risk tolerance and strategy but this is our approach for the right time to re-enter this market.
** If you like our free content follow our profile (www.tradingview.com) to get more daily ideas. **
Comments and likes are greatly appreciated.
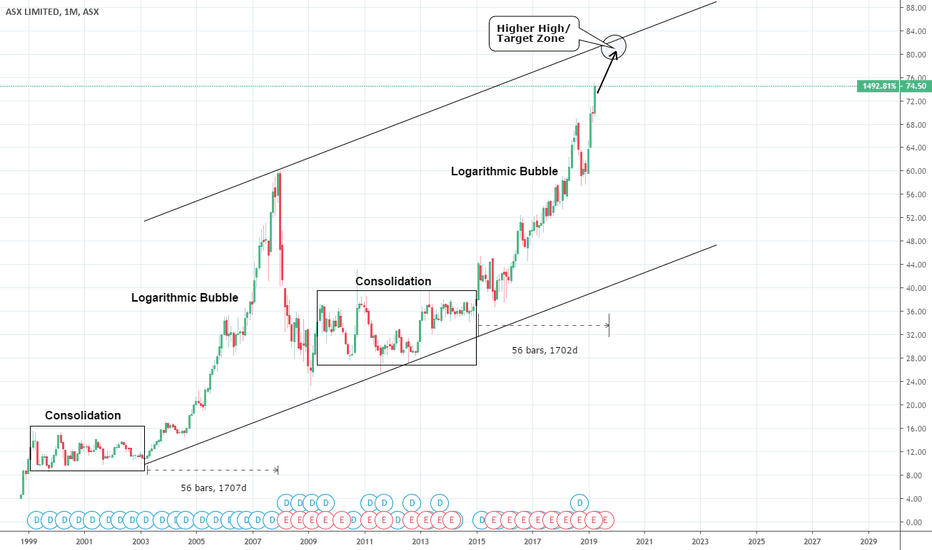
ASX: Australian stocks approaching a peak.The ASX Ltd is on a very strong bullish monthly streak having gained over +25% in 2019 alone. It appears to be trading inside a 20 year Channel Up that displays all phases of a Bubble (aggressive rise, blow-off, consolidation) from Higher Low to Higher.
Currently it is near the end of the bullish leg towards a new Higher High (peak) which is projected within 80.00 - 84.00 towards the end of 2019 (based on a 1702 day Bubble Duration). All charts are overbought (or close to) from 1D (RSI = 72.582) to 1W and 1M (RSI = 76.630 and 73.368 respectively) indicating that the peak of the bubble is indeed near and should be achieved on this final 2019 push.
Our strategy is to buy on every dip until this Target Zone. Then depending on circumstance and mostly global trade dynamics, we will most likely start building up a short base but updates will follow.
** If you like our free content follow our profile (www.tradingview.com) to get more daily ideas. **
Comments and likes are greatly appreciated.


