Tesla Inc. (TSLA) bullish scenario:The technical figure Channel Down can be found in the daily chart in the US company Tesla Inc. (TSLA). Tesla, Inc. is an American multinational automotive and clean energy company. Tesla designs and manufactures electric vehicles (electric cars and trucks), battery energy storage from home to grid-scale, solar panels and solar roof tiles, and related products and services. Tesla is one of the world's most valuable companies and is, as of 2022, the world's most valuable automaker. The Channel Down broke through the resistance line on 24/01/2023. If the price holds above this level, you can have a possible bullish price movement with a forecast for the next 18 days towards 168.10 USD. Your stop-loss order, according to experts, should be placed at 108.76 USD if you decide to enter this position.
Tesla Inc. said Tuesday it plans to spend $3.6 billion to expand its Sparks, Nev., gigafactory where it currently makes batteries and electric-vehicle parts.
The announcement came a day before the EV maker reports crucial quarterly earnings, and after CEO Elon Musk completed his third day of testimony in a trial over shareholder losses following tweets he made in 2018 about taking Tesla private.
Tesla said the battery facility would have capacity to produce “enough batteries for 2 million light duty vehicles annually.” In early January, Tesla said it delivered about 1.31 million vehicles in 2022. Analysts expect Tesla to increase deliveries to about 1.92 million in 2023.
Risk Disclosure: Trading Foreign Exchange (Forex) and Contracts of Difference (CFD's) carries a high level of risk. By registering and signing up, any client affirms their understanding of their own personal accountability for all transactions performed within their account and recognizes the risks associated with trading on such markets and on such sites. Furthermore, one understands that the company carries zero influence over transactions, markets, and trading signals, therefore, cannot be held liable nor guarantee any profits or losses.
Automotive

Greves Cotton Levels & Strategy for next few daysDear traders, I have identified chart levels based on my analysis, major support & resistance levels. Please note that I am not a SEBI registered member. Information shared by me here for educational purpose only. Please don’t trust me or anyone for trading/investment purpose as it may lead to financial losses. Focus on learning, how to fish, trust on your own trading skills and please do consult your financial advisor before trading.
Company is focusing on accelerating adoption of electric vehicles and transforming last mile mobility with clean transport solutions has strengthened their leadership position in this fast-growing electric auto market. Company posted net profit of 32.3 crore & net loss of Rs 23.3 crore. Stock has beaten 3 year revenue CAGR. Electric mobility segment posted highest ever quarterly profit.

Volkswagen (VOW3.de) bullish scenario:The technical figure Triangle can be found in the daily chart in the German company Volkswagen AG (VOW3.de). Volkswagen AG, known internationally as the Volkswagen Group, is a German multinational automotive manufacturer. The company designs, manufactures and distributes passenger and commercial vehicles, motorcycles, engines and turbomachinery, as well as offering related services, including financing, leasing and fleet management. In 2016, it was the world's largest automaker by sales, and keeping this title in 2017, 2018 and 2019, selling 10.9 million vehicles. It has maintained the largest market share in Europe for over two decades. It ranked seventh in the 2020 Fortune Global 500 list of the world's largest companies. The Triangle broke through the resistance line on 02/11/2022. If the price holds above this level, you can have a possible bullish price movement with a forecast for the next 9 days towards 141.98 EUR. Your stop-loss order, according to experts, should be placed at 125.40 EUR if you decide to enter this position.
VW reported $4.3 billion in third quarter operating profit. Wall Street was looking for $4.5 billion. Shares are down 3.8% in overseas trading.
Financial guidance hasn’t changed, but delivery guidance has. Back in July, Volkswagen believed total deliveries in 2022 would rise 5% to 10% compared with the 2021 total of 8.9 million units. Now the company expects 2022 deliveries to be the same as 2021. Supply chain constraints are to blame.
Despite that headwind VW’s EV business continued to expand in the quarter. Battery electric vehicles amounted to 6.8% of total VW deliveries. Year to date, VW has delivered 366,400 EVs, up from 293,000 delivered in the same period of 2021. China accounted for 112,700 of those 2022 EV deliveries. VW’s Chinese EV sales are up 139% so far in 2022 compared with the same span of 2021.
Risk Disclosure: Trading Foreign Exchange (Forex) and Contracts of Difference (CFD's) carries a high level of risk. By registering and signing up, any client affirms their understanding of their own personal accountability for all transactions performed within their account and recognizes the risks associated with trading on such markets and on such sites. Furthermore, one understands that the company carries zero influence over transactions, markets, and trading signals, therefore, cannot be held liable nor guarantee any profits or losses.

Lithia Automotive earnings predictionBullish on LAD earnings tomorrow.
Using data collected from Lithia dealer websites to predict Lithia's unit sales before earnings is released tomorrow.
The white graph is aligned (almost) to each year/quarter.
Q over Q New and Used unit sales have declined due to an industry wide inventory shortage.
With inventory supply for New and Used vehicles starting to rebound, there appears to be a rebound in sales in Q3 for Lithia.

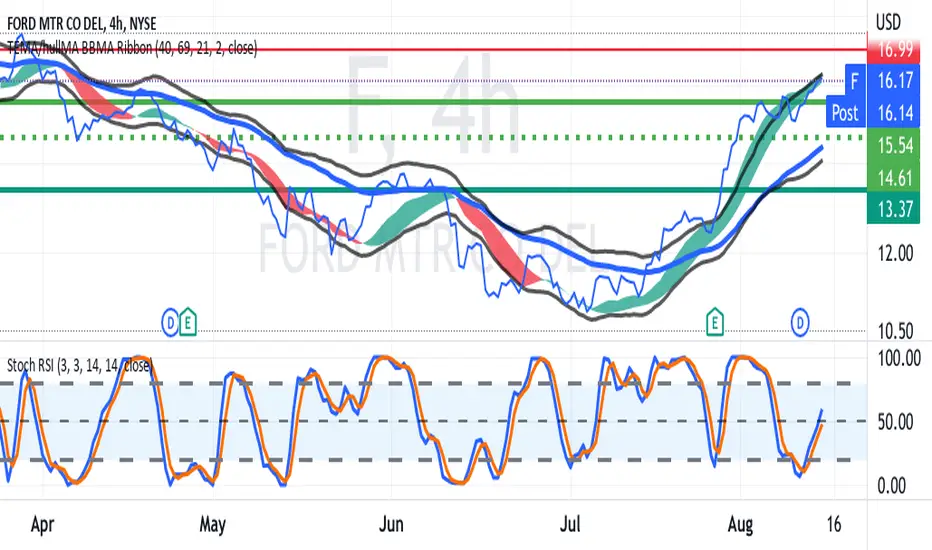
FORD Swing Trade after REVERSAL in JulyNYSE:F
F is trending up while TSLA heads down
US Legislation to support EV purchases with tax credits is helpful
GM's financial troubles are helpful.
Chart shows upgoing BB/EMA channels
and mid-range RSI with recent K/D crossover.
Both suggest a potential swing entry. Depend on unforeseen
changes in the automotive market or the market at large
and a recession versus continued uncertainty, F could
the uptrend for several months also made for the
opportunity to trade call options.
Trade often. Trade well !
RIVIAN About to break its 3 month Channel upwardsBack in May we called for a short-term buy on Rivian (RIVN) but warned investors not to get overexcited:
This time however we find quite a few reasons to be excited as following the break above its Falling Wedge, the stock formed a Channel Up that is about to break upwards on today's strong rise. Within this Channel, the price also succeeded in breaking above both the 1D MA50 (blue trend-line) and the 1D MA100 (green trend-line) and in fact a Bullish Cross between the two is emerging.
The 1W RSI has been steadily rising from its previous oversold state and is now above the 40.00 mark, so if the price breaks above the Channel Up, we expect RIVN to aim for the 56.90 March 30 High, which is the current Resistance. A break above that level, which happens to be on the 0.236 Fibonacci retracement level form the market Top, would constitute a long-term trend shift to bullish.
--------------------------------------------------------------------------------------------------------
Please like, subscribe and share your ideas and charts with the community!
--------------------------------------------------------------------------------------------------------

TSLA LongIn Q1 2022, Tesla Outsold All Luxury and Premium Car Brands In The U.S. and gained 8.6 percent of the total market share of luxury automotive sales. Tesla is showing no signs of slow down. We are now currently at a 1 hour supply zone level and I'm looking for a continuation to the upside because break of previous structure to the upside was broken at 790.00 area. I'm looking for a projection to 1002.00 area first TP. We will react to whatever the market shows us and trade accordingly.

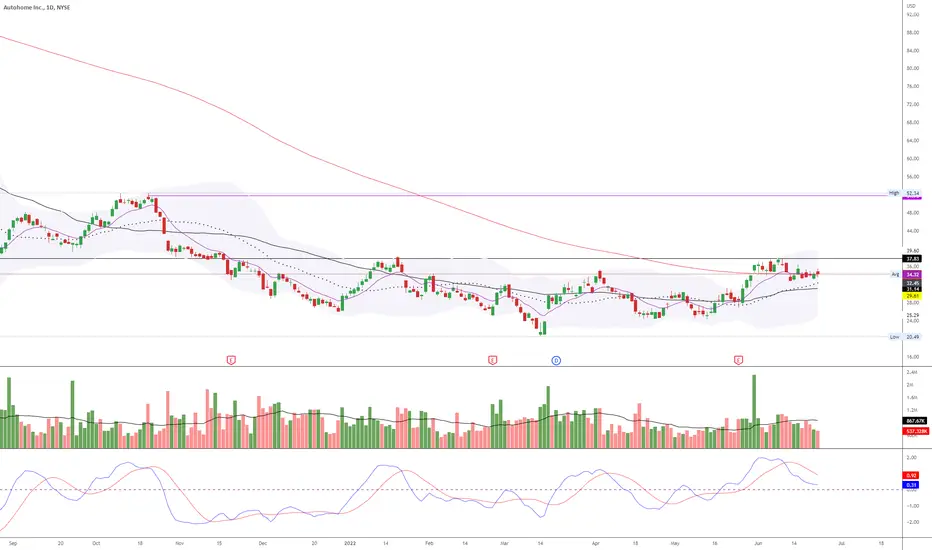
ATHM - Gorgeous set up
Basing above 60 VMA in a flag pattern. Breakout should propel this to 52 easily and potentially 200
Chinese names are front runners of the next bull cycle IMO.
One could buy here with the tight S/L or wait for break and retest.
NIFTY AUTO Trend AnalysisWorst scenario for those who are bullish thinking of potential Cup with Handle pattern formation on a broader outlook or reverse Head & Shoulder pattern on a narrower outlook.
If you look carefully, you can see the descending broadening wedge clearly as highlighted in my chart.
You can zoom out to see the broader view of my chart with all the drawings.
Technically this chart looks almost similar to the Ashok Leyland chart I have posted earlier this month.
TDI is at upper band with NIFTY AUTO nearing the resistance zone in confluence with the edge of pitchfork and upper edge of the descending broadening wedge highlighted.
Moreover a strong hidden bearish divergence in MACD histogram is observed on weekly timeframe. (Not applied here because chart is on daily timeframe).
Expecting a fall of approximately 30-33% towards 7700-8000 level, which is next possible support zone lying near golden Fib level.
The fundamental attributes of major auto companies are not looking good specially with the declining OPM% (At lowest levels).
It's better to avoid FOMO in auto sector stocks because of all good news and invest after this big correction or else keep averaging.
Do your own due diligence before taking any action.
Peace!!

5/25/22 ANAuto Nation ( NYSE:AN )
Sector: Retail Trade (Specialty Stores)
Market Capitalization: $6.427B
Current Price: $114.84
Breakout price: $118.10
Buy Zone (Top/Bottom Range): $109.60-$96.90
Price Target: $142.80-$144.00
Estimated Duration to Target: 399-407d
Contract of Interest: $AN 1/20/23 110cc
Trade price as of publish date: $20.10/contract

5/25/22 ORLYOReilly Automotive ( NASDAQ:ORLY )
Sector: Retail Trade (Specialty Stores)
Market Capitalization: $39.973B
Current Price: $615.79
Breakout price: $621.50
Buy Zone (Top/Bottom Range): $609.20-$564.80
Price Target: $782.00-$788.00
Estimated Duration to Target: 406-418d
Contract of Interest: $ORLY 11/18/22 630c
Trade price as of publish date: $49.95/contract

self driving shifting back into autopilot (IDRV)the turn around in the nasdaq and big tech as well as related sectors and their respective etfs should also hit self driving. we should find ourselves breaking the downtrend soon.

$F Downside prevails as long as $24.70 is resistanceOur view is negative until $24.70 pivot breaks to the upside.
The RSI is below 50 and further downside is expected if the MACD penetrates zero and falls into the negatives.

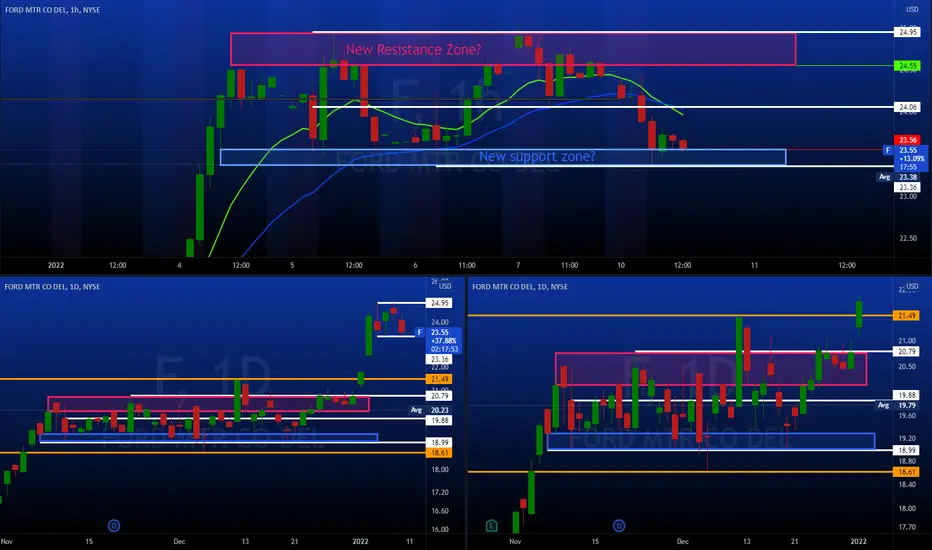
Ford consolidating at higher levels in 22' ? NYSE:F
Ford consolidating at higher levels in 22'
On top you have the 1hr chart focused on Jan 4-10
Below are the 1 day charts focused on Nov - Dec
Take notice of the range Ford is now creating.
I believe this is the same pattern we saw Nov-Dec while it consolidated between 19-21 where the market needed time to absorb the new prices levels that hadn't been seen in 20 years
Looking for this new range to form at 23-25
Lets see how this ages
Ford - levels to consider 1/10/22$F
Support 24.06
Resistance 24.95
Consider Calls above 24.95
Consider Puts below 23.66
After 2 months of consolidation between 19-21 Ford has recently broke out to levels not seen for 20 years. Can't find a bad article on $F right now. Although Im bullish, consider a pullback

Is Tesla overvalued?NASDAQ:TSLA is the fifth largest listing on TradingView based on market cap and has been a huge center of focus within the investment community, whether it is the more seasoned investor or trader to the inexperienced speculator who throws money at Bitcoin and various growth companies. Despite all of this there are many factors that the majority of the investing community fail to acknowledge or believe it doesn't affect the company's performance.
Personally despite the crazy stock prices and lack of build quality within their physical product, I have a considerable amount of faith in the earning potential of Tesla for a couple of reasons. First of all, one should notice that at the time of writing Tesla's PE ratio is sitting at a whopping 370.66 (comparable to the firms during the dotcom bubble) and they have a considerable amount of debt but nothing that threatens their operation or is completely disproportional to any other company. It certainly would not be appropriate to compare them to other solely electric automotive manufacturers as their financial statements often seem less welcoming than Normandy beach on D-day.
On the contrary to all the fore mentioned facts, Tesla's earning power has increased considerably between 2019 to 2020 and is looking towards the upside for 2021. In the past 4 years, any deficits have turned to income and their overall assets has increased consistently. Quite frankly, considering the speculative factors, such as the management of the company and their overall market monopoly, Tesla appears to be a rather profitable long term investment. Electric cars seem to be inevitable considering the carbon emissions issues and the fact that any other alternatives such as bio-fuel and hydrogen cars don't seem to be covering as much ground as quickly, and their market monopoly will keep the firm in good stead for the future potentially forming the "next Ford Motor Company" according to a reporter from Bloomberg.
Once again, all opinions and comments are greatly appreciated, I thoroughly enjoy listening to others' opinions and perceptions of the market.
TL;DR: Tesla is beginning to look like a promising investment for the long term as their financials steady and seem to head for an upward curve.

Support & Resistance Zones Mapped!LCID had a nice run. The Bears have rejected the upward momentum twice but LCID is still looking strong based on the S/R zones shown. Do you think it will pump through the current resistance or will it dump below the diagonal support shown? I think it will touch the diagonal support but after that, I'm not too sure. A great EV company overall, so let's see how it plays out.
Love it or hate it, hit that thumbs up and share your thoughts!
Don't trade with what you're not willing to lose. Safe Trading Calculate Your Risk/Reward & Collect!
This is not financial advice.

Fibo levels of TSLAFibo levels:
X=$604
AB=0.61 XA=$80
BC=0.38 AB=$23
1.6 BC=$168
0.78 XA=$195
2 BC=$268
0.88 XA=$331
2.24 BC=$359
2.6 BC=$569
1.13 XA=$1200
3.6 BC=$1925
1.27 XA=$2539
4.23 BC=$4087
1.41 XA=$5261
1.6 BC=$15771

$APTV: The Future Is NowIrish auto safety company Aptiv is showing some real promise especially if COVID lockdowns in Europe progress giving time for roads to implement technology.

General Motors Company (GM) - shortSignals
Position: Short
Target Price : $58
Entry Price: $64
Stop loss: $66
Indicators
RSI is above 70
STOCH is above 80 and the indicator has negative, meaning is could have already reached the peak
MACD is only slightly above the signal line
The stock price is in the upper band of the Keltner Channel
Analysis
The stock is in an uptrend, made of impulses and pullbacks but has now reached the resistance level after two long bullish candlesticks. Nevertheless the MACD does not signal a strong bullish momentum and Stochastic indicator and RSI already show an overbought stock. Furthermore the stock price is currently above the upper band of the Keltner channel, so we can expect it to retrace back to the closest moving average. The entry price is at resistance level, and we use the Fibonacci retracement tool to set the profit target at the 0.618 level.
No financial advice.

Breakout or Rejection!?Money Makers!
GM is on its way to retest previous highs. I possible breakout or rejection is incoming. Let's stay patient and have your orders ready! Let me know what you think will happen below. I'm curious.
Love it or hate it, hit that thumbs up and share your thoughts!
It's all about Market structure, Area of value, and Entry Trigger.
Don't trade with what you're not willing to lose. Safe Trading Calculate Your Risk/Reward & Collect!
This is not financial advice.

Beautiful Channel!Money Makers!
GE has been trading in a horizontal channel for a very long time. It recently was rejected from moving higher and is currently attempting to bounce off the 50 EMA. If the 50 EMA fails we can expect it to move lower to retest the bottom of the channel again.
Love it or hate it, hit that thumbs up and share your thoughts!
It's all about Market structure, Area of value, and Entry Trigger.
Don't trade with what you're not willing to lose. Safe Trading Calculate Your Risk/Reward & Collect!
This is not financial advice.

S/R Zones!Money Makers!
Let's keep an eye on these KEY Support & Resistance areas! With Elon asking the public about selling his shares and his brother selling his shares before him, this sell-off was expected.
Love it or hate it, hit that thumbs up and share your thoughts!
It's all about Market structure, Area of value, and Entry Trigger.
Don't trade with what you're not willing to lose. Safe Trading Calculate Your Risk/Reward & Collect!
This is not financial advice.
