Gold setup for coming week.Hi everyone
This is our setup going into the last week of July trading week.
We could possibly see market retest the 3321-3324 zone & make its way back up to 3347 area, this will also be an area to be monitored for possible break out that will lead back to 3362.
We are looking to get a possible downward pressure from 3345 area to 3303.
Let always look at what market presents & bag potential profits at pivitol areas.
Have a good weekend & good trading week coming up
Auxusd

Gold - Small rejection before $3400?Gold has been in a clear downtrend on the 4-hour timeframe, and during one of its recent declines, it left behind a 4-hour Fair Value Gap (FVG). Price is now climbing back toward this imbalance zone, suggesting that a critical test of resistance may be approaching.
Bounce from strong support
Just a few days ago, Gold found solid footing at a strong support area, which triggered a bounce. Since then, it has been pushing higher and is now nearing the 4-hour FVG. This zone represents a significant area of imbalance left unfilled during the prior selloff, and it's highly likely that price will react once it reaches this region.
FVG and Golden Pocket
Interestingly, this FVG aligns closely with the golden pocket, which lies between 3315 and 3325. While the golden pocket sits slightly above the midpoint of the FVG, there's a good chance Gold could tap into that area before showing signs of a pullback or rejection from the FVG itself.
Target to the downside
If price fails to break above this zone and reverses, the logical target to the downside would be the 3250 level. This area has acted as a key resistance in recent sessions, and if retested from above, it could serve as a strong support base for another potential leg higher.
Target if we break above the FVG
On the other hand, if Gold manages to break cleanly through the FVG with strong volume and momentum, the path could open toward a move up to the recent highs around 3430. In that scenario, the bullish continuation would likely require sustained buying interest and increased market participation to carry through.
Thanks for your support.
- Make sure to follow me so you don't miss out on the next analysis!
- Drop a like and leave a comment!

Gold - $3160 before the next move up?Introduction
Gold is currently exhibiting interesting price behavior across multiple timeframes, reflecting a mix of short-term bullishness within a broader context of consolidation. On the one-hour chart, gold is trading within a well-defined rising channel, suggesting a controlled upward correction following a strong impulsive move downward. This upward movement appears to be a retracement rather than a full reversal, especially when analyzed in conjunction with the higher timeframes.
Daily tight range
Zooming out, gold remains range-bound between the key levels of $3,500 and $3,200. The market has been oscillating within this wide horizontal band, making relatively equal highs and lows. This type of price action typically signals indecision or accumulation, where neither buyers nor sellers are firmly in control. Such a range can often precede a more decisive move in either direction once a breakout occurs. Until then, the market remains reactive to both support and resistance zones within this range.
Latest Gold sell-off
Yesterday’s trading session introduced a notable shift in momentum, as gold posted a large bearish candle on the one-hour chart, marking a sudden and aggressive sell-off. This move established a short-term bearish impulse. Since that moment, however, the price has been gradually recovering, climbing back within the confines of the rising channel. This rebound appears corrective in nature and has yet to reclaim the previous levels before the sell-off. Above the current price action lies a one-hour Fair Value Gap (FVG), which could be an area of interest for liquidity hunters. Should gold manage to break out to the upside of the channel, it is quite possible that price action will aim to fill this FVG, which sits around the $3,300 level. This could represent a short-term bullish target before any potential continuation lower.
Bearish scenario
On the flip side, the more compelling scenario from a technical standpoint lies on the downside. If gold fails to sustain its upward trajectory and breaks below the lower boundary of the rising channel, the probability of a move toward the strong support level at $3,160 increases significantly. This level is particularly noteworthy because it aligns with multiple technical confluences. It represents a historical support area where price has previously reacted strongly, and it coincides with the so-called “golden pocket” of the Fibonacci retracement, typically considered a high-probability reversal zone by many traders. The presence of this confluence suggests that a breakdown could trigger a swift move toward this level, possibly attracting buyers once again if the support holds.
Bullish scenario
While the potential to move higher toward the $3,300 region and fill the FVG remains valid, especially if the current bullish momentum within the channel continues, it is, in my view, the less probable scenario. The recent sharp downward candle suggests that sellers have established control in the short term, and the current upward movement may simply be a retracement before a continuation lower.
Conclusion
In conclusion, the most likely and technically supported path for gold appears to be a breakdown from the rising channel, followed by a decline toward the $3,160 support level. This zone, bolstered by historical significance and Fibonacci confluence, presents a strong target for price if bearish momentum resumes. While a temporary push toward $3,300 is possible, especially to fill the FVG, it should be seen as a lower-probability scenario compared to the downside risk currently unfolding.
Thanks for your support.
- Make sure to follow me so you don't miss out on the next analysis!
- Drop a like and leave a comment!

Gold - Bearish continuation towards a strong support!Gold has been in a strong and consistent uptrend, supported by macroeconomic uncertainty and a favorable risk environment. However, on the lower timeframes, price action is showing signs of temporary weakness following a sharp sell-off a few days ago.
Currently, on the 4h chart, Gold appears to be forming a bearish continuation pattern, specifically a pennant. This type of consolidation after a fast drop often suggests potential for further downside. If the pennant breaks to the downside, the projected target aligns with the golden pocket of the latest bullish move, between $3,165 and $3,147. Notably, this level also coincides with a strong support zone, making it a high-interest area for potential long setups.
Despite the bearish pennant, the broader trend remains bullish, which means a break to the upside is still possible. However, given the current 4h structure, I'm leaning cautiously bearish in the short term and will be watching closely for signs of strength at the key support.
My plan is to look for long opportunities near the golden pocket, but only if certain criteria are met, primarily, signs of downside exhaustion such as a bullish candlestick formation on the lower timeframes. It's critical not to "catch a falling knife"; confirmation is essential before entering any long trade.
Thanks for your support.
- Make sure to follow me so you don't miss out on the next analysis!
- Drop a like and leave a comment!

Today analysis for Nasdaq, Oil, and GoldNasdaq
The Nasdaq closed higher on the daily chart. It held above 18,360 at the close, and today’s candle formed a golden cross as the MACD crossed above the Signal line, creating a potential buy signal. However, this signal will only be confirmed if the candle closes as a solid bullish bar, so it's too early to say that a buy confirmation has been established.
On the weekly chart, although the index has not yet reclaimed the 5-week MA, it has gapped above it. Overall, the index appears to be forming a box range between the 3-week and 10-week MAs, and if further upside occurs, we could potentially see a move toward the 60-week MA. However, since the MACD and Signal line on the weekly chart are still sloping downward, there's a high possibility of a medium-term pullback even if the index rallies to the 10-week MA.
On the daily chart, the index is still meeting resistance at the 20-day MA, and the key point now is whether the MACD completes the golden cross or turns downward again. Since the index has managed to hold above 18,360, the potential for a rebound remains open. Buying during pullbacks near the lower wick remains a favorable strategy.
On the 240-minute chart, the MACD is turning upward after finding support at the Signal line, forming a potential third wave of buying. In short-term timeframes, buying on dips remains favorable.
This week, the Retail Sales data is scheduled for Wednesday, and the U.S. markets will be closed on Friday. Please keep that in mind for risk management.
Crude Oil
Crude oil closed higher in a narrow range on the daily chart. On the weekly chart, a long lower wick formed, finishing with a doji candle, suggesting indecision. Last week, oil was rejected at the 3-week MA, forming an upper wick. If it rallies this week, it could target the 5-week MA. The $65 level, near both the 5-week and 240-week MAs, remains a strong resistance zone, making it a potentially favorable area to consider short trades.
On the daily chart, oil has entered a box range between the 5-day and 10-day MAs. Though the MACD and Signal line still point downward, oil is currently holding within a supportive range. There is a possibility the MACD could begin to turn upward, so keeping both bullish and bearish scenarios open is advisable.
On the 240-minute chart, the MACD is still rising after a golden cross but remains below the zero line, suggesting a potential for another pullback. Overall, monitor intraday movements and continue to trade within the range.
Gold
Gold closed higher, setting a new all-time high. The weekly chart formed a strong bullish candle, resuming its upward trend. Buying near the 3-week MA remains favorable. As the price has overshot the previous target of $3,216, we’ve now entered an overshooting zone, making it difficult to define the next resistance. Therefore, caution is advised for short positions, and it’s best to focus on buying the dips.
On the daily chart, the new all-time high generated a bullish signal, and buying near the 3-day MA is recommended. Gold may enter a sideways consolidation phase while aligning its moving averages. In that case, buying near the 5-day MA may also be considered, but avoid chasing the price higher.
The MACD has made another golden cross, and it’s important that the MACD doesn’t create a divergence by failing to surpass its previous peak. Avoid shorts, and stick with buy-the-dip strategies. On the 240-minute chart, buying momentum remains strong. The RSI is in overbought territory, so again, avoid shorting and focus only on buying during pullbacks.
Market Outlook
Compared to the last two weeks of high volatility, this week is expected to be more subdued. After a period of extreme moves, the market is likely to consolidate and seek direction. Rather than swinging for home runs, it's better to focus on small base hits and steadily build profits.
Wishing you a successful trading week!
If you like my analysis, please follow me and give it a boost!
For additional strategies for today, check out my profile. Thank you!

Today analysis for Nasdaq, Oil, and GoldNasdaq
The Nasdaq closed lower following news of additional tariffs on China. On the daily chart, the index failed to break above the 20-day moving average and pulled back to the 5-day MA, continuing its box-range movement. Since the 5-day MA is still acting as support, the current trend can still be seen as a sideways consolidation, with 18,500 acting as a central pivot level.
The MACD on the daily chart has not yet clearly broken above the Signal line, so it remains uncertain whether it will make a golden cross with additional upward momentum, or turn downward again. Thus, it’s best to adopt a neutral range-bound trading strategy, keeping strict stop-losses on both sides.
On the 240-minute chart, both the MACD and Signal line have moved above the zero line, entering a key area to observe whether the third wave of MACD upside begins after this box-range consolidation. Since the current price is correcting after a rebound from a double bottom, and is maintaining the center of the prior bullish candle, buying remains more favorable. Unless the previous day’s low is broken, it’s better to stay buy-biased.
Please note that today's PPI data release is scheduled, which may lead to increased volatility around the announcement time.
Crude Oil
Crude oil closed lower with a large bearish candle. On the daily chart, it failed to hold the 5-day and 10-day moving averages, breaking below the 5-day MA. The MACD continues its downward slope, and unless oil clearly reclaims the 10-day MA, the market will remain bear-biased.
There is resistance now at the 3-day and 5-day MAs, so it’s important to see whether further downside unfolds. As previously noted, the $59 level is a key support zone — watch closely for any breakdowns.
On the 240-minute chart, the MACD is trending up and pulling the Signal line along, but both remain below the zero line. If oil continues in a box range but the MACD turns downward again and forms a dead cross, there could be another leg lower. For now, continue to focus on buying near the $59 level, and maintain a range-trading approach until further confirmation.
Gold
Gold closed higher with another strong rally. On the daily chart, the MACD has now crossed above the Signal line, generating a buy signal. However, this signal will only be valid if today’s candle closes as a bullish bar, so watching the daily close is critical.
Gold hit new all-time highs during the pre-market session, with the long-awaited 3,216 level, which has been the target since March, now within reach. Beyond this level, we enter the overshooting zone, where it’s difficult to define a precise top. Therefore, it's best to stick to dip-buying strategies, as safe-haven demand continues to surge.
Even though the MACD has crossed bullishly, divergence may form if the current MACD fails to exceed the previous peak. Avoid chasing long positions at the top; instead, look for entries during pullbacks.
On the 240-minute chart, the MACD has climbed above the zero line, showing a strong one-way bullish trend. RSI across intraday charts is now in overbought territory, so it’s best to avoid short positions entirely for today.
Market Sentiment & VIX
Looking at the VIX index, the daily candle has once again broken above the 5-day MA, indicating that volatility could expand further at any time. With Trump’s remarks shaking markets, it’s impossible to predict what new developments might emerge over the weekend.
Avoid holding overnight positions due to heightened headline risk, and make sure to wrap up this trading week with solid risk management.
Wishing you a profitable trading day!
If you like my analysis, please follow me and give it a boost!
For additional strategies for today, check out my profile. Thank you!

Today analysis for Nasdaq, Oil, and GoldNasdaq
The Nasdaq closed with a sharp surge following news of a possible delay in Trump’s tariff implementation. A 12% single-day rally on the daily chart is unprecedented — it was an extraordinary rise. On the daily chart, the 20-day moving average is acting as resistance, and to fully fill the April 3rd gap-down, the index would need to rise to around 19,750. If the Nasdaq continues to climb and fills that gap, a potential pullback should be anticipated.
Although the MACD has turned sharply upward in a V-shape, it hasn't fully broken above the Signal line yet. Given the rapidly changing global conditions, the possibility of a reversal still exists. However, since the 90-day tariff delay has been confirmed, the market may be entering a phase of relative stability. On the weekly chart, we see a sharp rebound that has brought the index up to the 5-week moving average. Both the Nasdaq and the VIX suggest that today could be a range-bound (sideways) session, so it's better to set wider trading ranges and adopt a box-range trading strategy.
On the 240-minute chart, a double bottom pattern has formed, with the MACD bouncing off the Signal line and rising again. The MACD is trending upward, but the Signal line remains below the zero line, which means a short-term pullback could still occur. Overall, it is advisable to use a buy-low, sell-high approach, with more upside potential still open. Also, today’s CPI report is scheduled, so please be mindful of increased volatility around the data release.
Crude Oil
Crude oil rebounded sharply from the $55 level, showing an impressive 12% range between high and low. However, the sell signal remains active. The price has broken above the 5-day moving average and entered a box range between the 5- and 10-day MAs, suggesting that a moving average-based box strategy would be effective.
On the weekly chart, oil has not yet reached the 5-week MA, so there’s still room up to the $65 level, which has historically served as strong resistance. Around that area, it might be more effective to consider short positions. On the 240-minute chart, the MACD showed signs of a third wave down, but failed to make a new low — signaling bullish divergence. A head-and-shoulders inverse pattern may be forming, with the right shoulder potentially developing around the $59–$60 zone. Overall, the strategy should remain range-based, with some more room to the upside.
Gold
Gold also closed sharply higher, benefiting from the tariff delay news. On the daily chart, the price closed higher, giving the illusion of a support bounce off the lower Bollinger Band, as that band is rising. The MACD remains above the zero line, so there’s still room for a retest of the Signal line, but given the current gap between MACD and Signal, the price needs to either rise further or move sideways to bring the MACD closer and potentially break above the Signal line.
If it fails to rise from here, the MACD may turn down again, so avoid chasing the price upward. Like Nasdaq and oil, gold is heavily influenced by global developments, so stay updated on the geopolitical landscape. On the 240-minute chart, gold formed a triple bottom around the 2,980 level and then rebounded strongly. The MACD is trending upward and pulling the Signal line along with it, but resistance around the 3,130 level remains significant. Gold may see increased volatility from today’s CPI report and tomorrow’s PPI release, so stay alert.
Market Summary
The market has been showing signs of irrational behavior. Investor sentiment is extremely volatile and driven more by emotion than logic. In times like this, it’s more important than ever to stick to the basics, shorten trade duration, cut back on risk, and trade with discipline. The more you chase after gains, the more likely your trades will be swept away by market turbulence.
Warren Buffett is considered a legend in the financial markets precisely because he has always stuck to fundamental principles. Likewise, it is crucial to establish and stick to your own trading principles to survive in the markets. If you haven’t yet experienced the kind of volatility we saw during the Trump era or the pandemic, this is a time to be especially cautious and defensive in your approach.
Wishing you another day of successful trading
If you like my analysis, please follow me and give it a boost!
For additional strategies for today, check out my profile. Thank you!

Today analysis for Nasdaq, Oil, and GoldNasdaq
The Nasdaq closed lower after forming an upper wick at the 5-day moving average on the daily chart. If it had closed with a bullish candle, a technical rebound from the oversold condition could have opened the way to the 10-day moving average, but instead, it ended with a bearish candle.
The daily chart still shows a sell signal, but the best-case scenario would be for the market to form a double bottom pattern after confirming a short-term low and attempt another rise toward the 10-day moving average.
On the intraday charts, there's a high probability that the market will show a double bottom during the pre-market session, especially since there's no clear sell reversal on lower timeframes yet. The 240-minute chart shows a golden cross on the MACD, and although a death cross hasn't yet occurred, the large gap between the MACD and the zero line suggests a continued corrective trend.
As long as the death cross doesn't materialize, buying on dips near the bottom remains favorable. The 16,500 level is a strong support zone on the monthly, weekly, and daily charts, so shorting is not recommended — better to lean toward long setups. With the FOMC minutes due out early tomorrow and the CPI report on the horizon, volatility is expected to rise as the market attempts to form a bottom. Stick to buying on dips, manage risk carefully, and reduce leverage in this volatile environment.
Crude Oil
Crude oil closed lower, continuing its recent downtrend on the daily chart. Concerns over a global economic slowdown and increased production from OPEC nations are dampening the upside. Although the sell signal on the daily MACD remains, there's still potential for a short-term rebound toward the 5-day moving average. If trading short, make sure to set a stop-loss, especially near the strong $57 support zone, where shorting is riskier.
On the 240-minute chart, the MACD has re-crossed into a death cross, showing signs of a third wave of selling pressure. However, there's still a chance of bullish divergence, so avoid chasing short positions. The $57–$59 support range remains strong, and unless this level breaks, buying on dips offers a more favorable risk-reward ratio. Note that today's U.S. crude inventory report could introduce more volatility, so trade carefully.
Gold
Gold closed lower with an upper wick on the daily chart. While the price is still above the 0 line on the MACD, if it pulls back to the previous high resistance area, which coincides with the lower Bollinger Band and the 60-day moving average, it may present a good buying opportunity for swing trades. On the weekly chart, gold is still moving within a sideways range, trapped between key moving averages. With the FOMC minutes today and the CPI tomorrow, it's important to monitor whether the price breaks out of this range.
The 240-minute chart shows that the MACD has not yet formed a golden cross, and there's still a large gap from the 0 line. If MACD rebounds and then corrects again, it's crucial to check whether a double bottom around the 2,980 area is forming. Overall, gold remains a buy-the-dip candidate, and if the price falls to around the 60-day moving average, it could present a great swing entry.
Investor sentiment is reaching extreme levels, and we're witnessing unusually fast and wide price swings. It's hard to rely on daily or weekly charts alone, so it's important to focus on short-term price action and use appropriate leverage for your strategy.
The market will always be open. Survival and consistent profitability are what matter most in the long run. Stay disciplined, manage risk carefully, and take a long-term view as a trader.
Wishing you another day of successful trading!
If you like my analysis, please follow me and give it a boost!
For additional strategies for today, check out my profile. Thank you!

Today analysis for Nasdaq, Oil, and GoldNasdaq
The Nasdaq closed lower after experiencing extreme volatility the previous day. Following a gap-down open, the market attempted a bottoming process. However, the spread of fake news related to tariffs triggered a 10% intraday swing, making the Nasdaq trade more like an individual stock than a major index. Massive trading volume occurred due to margin calls from CFDs and hedge funds, and the market showed some signs of recognition around a potential short-term bottom.
On the weekly chart, the index rebounded but was resisted at the 3-week moving average. On the daily chart, a doji bullish candlestick with strong volume formed, suggesting the market may attempt another rebound. However, since volatility from the bottom remains significant, if you’re planning to enter long positions, it's best to buy as close to the bottom as possible. If the market continues to form a base, a rebound toward the 5-day or 10-day moving average on the daily chart is possible.
On the 240-minute chart, the market is still in a death cross and remains oversold. Still, it's showing signs of forming a base around the 16,500 level, so it's better to avoid chasing short positions during any pullbacks that could form a double bottom. In this oversold environment, a buy-on-dip approach near the lows is favorable for a technical rebound. But since volatility remains high, make sure to set clear stop-loss levels for both long and short trades.
Crude Oil
Crude oil experienced a gap-down on the daily chart and closed lower after hitting resistance at the 3-day moving average. On both the daily and weekly charts, the $57–$59 zone appears to be a short-term support level. If the price dips into this zone, it may offer a buying opportunity. Yesterday’s candle was resisted at the 3-day line, so if a bottoming pattern forms today, a rebound toward the 5-day moving average could be anticipated. However, since the MACD has just issued a sell signal near the zero line, it's better to treat any long positions as short-term trades.
On the 240-minute chart, the sell signal is still valid, and the market remains in oversold territory. Watching for a potential double bottom formation before entering long positions is recommended. That said, if market sentiment continues to accept economic recession as a given, oil prices could keep falling. There's also the risk of a one-way downward move, so if you're going long, ensure tight stop-loss levels are in place.
Gold
Gold saw sharp volatility and closed lower after being rejected at the 5-day moving average. Due to the weaker dollar from U.S. tariff announcements, the attractiveness of gold has diminished in the short term. On the weekly chart, gold is still forming a range-bound movement near the 10-week moving average, with support appearing near the $2,975 level. On the daily chart, the lower Bollinger Band and the 60-day moving average are rising and beginning to converge.
These overlapping indicators could form a strong support zone, so if the price drops into this area, it may present a good opportunity to buy the dip. On the 240-minute chart, the MACD and signal lines have both dropped below the zero line, and the RSI has entered oversold territory.
While this could lead to further accelerated selling, it is also a zone where a rebound from oversold conditions could easily occur. It’s best to avoid chasing the downside and instead focus on buying during pullbacks near strong support zones.
Market volatility is increasing, but this is also a zone where technical rebounds are likely due to excessive declines. While confirmation of a bottoming pattern is needed, in this kind of market, it's safer to focus on one direction rather than trying to trade both ways.
Long positions currently offer a better risk-reward ratio, so it’s advisable to enter at the lower end of the range. Reduce leverage as much as possible and always set stop-loss levels to ensure safe trading in these turbulent conditions.
If you like my analysis, please follow me and give it a boost!
For additional strategies for today, check out my profile. Thank you!

Today analysis for Nasdaq, Oil, and GoldNasdaq
The Nasdaq closed sharply lower due to the aftermath of tariff impositions. Following a significant gap-down, the index broke below the lower Bollinger Band, intensifying selling pressure. Yesterday’s bearish candlestick confirmed a sell signal, leading to an expanded third wave of selling. The index has now reached the previous support zone near 18,500, with additional volatility expected due to today’s Non-Farm Payrolls (NFP) report and Fed Chair Powell’s speech.
On the monthly chart, the Nasdaq is forming a lower shadow around the 20-month moving average. Given the sharp decline, if further selling occurs, oversold conditions may trigger a strong rebound, making it risky to chase shorts at this stage. The 240-minute chart also shows a sell signal, with heavy selling pressure continuing. However, this is a risky zone to enter new short positions, so it's advisable to monitor short-term price movements before making a move.
Regardless of whether you take long or short positions, due to high volatility, make sure to set stop-loss levels and adjust leverage to a manageable risk level.
Additionally, the VIX surged, forming a large bullish candle and reaching its March 11 high. With the VIX in an uptrend and a buy signal appearing, further volatility expansion is likely. However, since it has reached a key resistance zone, a short-term pullback in the VIX could allow for a Nasdaq rebound. For the VIX to break above its previous high, a period of consolidation may be necessary. Given the strong buying momentum on both the weekly and monthly charts, this should be taken into consideration when forming a trading strategy.
Crude Oil
Crude oil plunged following the OPEC meeting, where supply increases became a key issue. While oversupply concerns are a factor, the economic slowdown fears from tariffs have also played a major role in the decline. Previously, $68 was considered a strong support level, but oil collapsed from $72 in a steep decline. The final key support lies around $66.
On the daily chart, the MACD and signal line are converging near the zero line, suggesting that once a new wave begins, it could lead to a strong trend movement. Depending on today's session and Monday’s market, oil could see an aggressive breakout in either direction. Current candlestick patterns indicate that the weekly chart remains bearish, meaning holding long positions over the weekend carries significant risk.
The 240-minute chart also confirms a strong sell signal, with MACD plummeting. Oil may form a temporary sideways range near the $66 support, but if this level breaks, selling pressure could intensify. Ensure you manage stop-loss risks carefully in case of further downside.
Gold
Gold declined, reacting to fluctuations in the U.S. dollar's value. The price failed to hold above $3,200 and dropped below the 5-day moving average. Gold has been in a one-way trend, so a bullish approach remains valid unless it breaks below the 10-day MA. However, it has now entered a range-bound phase, and MACD on the daily chart is nearing the signal line, suggesting potential downside risks. The MACD failed to break its February highs, increasing the likelihood of divergence, which could trigger a strong correction if selling intensifies. With rising market volatility and today's NFP release, further wild swings in gold prices are expected.
The 240-minute chart has shown a sell signal, leading to a sharp decline. However, the price has found support near a key resistance-turned-support zone. Since the MACD and signal line remain above the zero line, gold may continue trading within a range in the short term. On shorter timeframes, candlestick volatility is high, so reducing leverage and widening stop ranges would be a prudent strategy.
During periods of extreme market volatility, technical analysis may become less effective, as market sentiment often overrides chart patterns. As always, trade only within your manageable volatility range. The market is always open, so even if you incur losses, there will always be opportunities to recover. Manage risk wisely, and best of luck with your trades today!
If you like my analysis, please follow me and give it a boost!
For additional strategies for today, check out my profile. Thank you!

Today analysis for Nasdaq, Oil, and GoldNasdaq
The Nasdaq closed higher on the daily chart. However, following the announcement of mutual tariffs after the previous session’s close, the index experienced a significant gap-down. On the daily chart, the MACD has crossed below the signal line, generating a sell signal, though confirmation is still pending. If today's session closes with a bearish candle, we must monitor whether this leads to a third wave of selling, signaling further downside.
Due to the gap-down, the price is now significantly distanced from the 3-day and 5-day moving averages (MAs), making it crucial to observe whether the price rebounds intraday or continues to decline further. With the first support level at 19,000 now breached, the next key support is around 18,500. When considering buy positions, it is essential to manage stop-loss risk carefully.
On the 240-minute chart, a sell signal has appeared but is not yet confirmed. If confirmed, it could trigger a third wave of selling pressure, potentially leading to further declines. Given the increased market volatility, a cautious approach is recommended—reducing leverage and only trading at key price levels to minimize potential losses.
Crude Oil
Crude oil closed higher while maintaining a range-bound movement around $72. On the daily chart, the MACD has moved above the signal line and the zero line, establishing a bullish trend. However, following the mutual tariff announcement, the price gapped down, dropping below $70. The strongest support zone lies around $68, making it crucial to observe whether the MACD adjusts and aligns with the signal line before rebounding from this support level to resume the bullish trend.
On the 240-minute chart, a sell signal has appeared, but with multiple support levels nearby and both MACD and the signal line still above the zero line, the market is likely to attempt rebounds. A buy-the-dip approach remains favorable, but caution is necessary given today’s OPEC meeting, which could lead to increased volatility.
Gold
Gold closed higher, finding support at the 5-day MA. Following the mutual tariff announcement, the price initially gapped up to around 3,200, before pulling back. As previously mentioned, the upward target for this wave is around 3,216, with strong buying momentum continuing. On the daily chart, gold is trading between the 5-day MA and the upper Bollinger Band, maintaining a one-way bullish structure.
A bullish strategy remains favorable unless the daily close falls below the 10-day MA. On the 240-minute chart, the MACD remains above the zero line and previously attempted to break above the signal line but has since pulled back. Since buying momentum is still present, if the price finds support at a key supply zone, another leg higher could occur, potentially triggering a golden cross in the MACD and leading to a third wave of buying pressure.
Short positions should be approached with caution, and given the increased market volatility, risk management is crucial. Whether buying or selling, stop-loss discipline is essential to manage potential risks.
Market volatility has surged since the pre-market session due to Trump’s mutual tariff policies. Volatility is both an opportunity and a risk for traders. Do not let greed lead to losses in a market that doesn’t match your trading style. Adjust position sizes accordingly and only trade within your comfort zone. The market is always open. Do not focus solely on today—take a steady and stable approach to trading.
Wishing you a successful trading day!
If you like my analysis, please follow me and give it a boost!
For additional strategies for today, check out my profile. Thank you!

Today analysis for Nasdaq, Oil, and GoldNasdaq
The Nasdaq closed higher on the daily chart. Although a sell signal briefly appeared in the previous session, the MACD failed to form a bearish crossover with the signal line, instead finding support and rebounding. The index strongly bounced from its low, reaching the 5-day moving average (MA) before closing with an upper wick.
Since the MACD is supporting the signal line and potentially resuming an upward trend, the key level to watch is whether the price can break through the strong resistance at 19,625–19,675. As long as the MACD does not confirm a bearish crossover, it is advisable to trade within the range.
On the 240-minute chart, the index rebounded from the bottom while generating a buy signal. However, with strong resistance around 19,675, if the price pulls back once more, it could either form a double bottom or resume a strong upward move from a single-bottom structure.
Although the MACD has crossed above the signal line (golden cross) on the 240-minute chart, it is still far from the zero line, suggesting that further pullbacks may occur after additional gains. It is important to avoid chasing the price and instead focus on buying dips at key support levels while maintaining a range-trading approach.
Crude Oil
Oil closed flat, facing resistance at $72. On the daily chart, the price broke above the 240-day MA and is now testing resistance from a previous supply zone. It is likely to consolidate within a range while pulling up the short-term moving averages.
The daily MACD has moved above the zero line, lifting the signal line as well. If the price remains in a range-bound consolidation, the signal line will eventually rise above the zero line, further supporting a bullish structure.
Key upcoming events include today’s oil inventory report and tomorrow’s OPEC meeting, which could act as catalysts for either a continuation of the rally or a pullback. Since there is still a gap between the 3-day and 5-day MAs, range trading remains the best approach.
On the 240-minute chart, strong buying momentum continues, but given the heavy supply at previous resistance levels, a period of sideways movement or a pullback is likely.
If a bearish crossover occurs on the 240-minute chart, oil could drop below $70. For now, monitor whether the uptrend can hold, and if it does, consider trading within the range while managing downside risks.
Gold
Gold closed lower after an overshoot to the upside. On the daily chart, the price was in an overextended high position, with a significant gap from the 3-day and 5-day MAs. After a brief rally, selling pressure emerged, leading to a bearish close.
Since gold has yet to properly test the 5-day MA, a pullback to this level remains a possibility. However, the daily MACD is still trending upward, and liquidity remains strong, increasing the likelihood of a one-way rally unless the 10-day MA is broken. Short positions should be approached with caution.
On the 240-minute chart, a bearish crossover has occurred, leading to a pullback from the high. However, since the uptrend remains intact, even if the MACD crosses below the signal line, the fact that it is still above the zero line suggests a potential rebound.
The best strategy is to focus on buying dips at key support levels, as the market is likely to consolidate before resuming a trend move. Be cautious when trading within a range-bound market.
With Friday’s U.S. employment report approaching, market volatility remains elevated. Trump’s tariff policies are increasing concerns about inflation and a potential economic slowdown. The interpretation of upcoming economic data will be crucial in determining market direction.
Risk management remains essential, so trade cautiously and stay prepared.
Wishing you a successful trading day!
If you like my analysis, please follow me and give it a boost!
For additional strategies for today, check out my profile. Thank you!

Today analysis for Nasdaq, Oil, and GoldNasdaq
The Nasdaq closed lower with a gap-down amid growing recession fears. Although it did not reach the 20-month moving average (MA) on the monthly chart, last month’s long bearish candlestick has resulted in a sell signal on the monthly futures chart—the first time in three years since February 2022. From a monthly perspective, the 16,900–17,500 range appears to be a good buying zone, but it is important to monitor whether the index reaches this level within this month’s candle. The 20-month MA is likely to be briefly breached, even if a lower wick forms.
On the weekly chart, the Nasdaq is currently finding short-term support around 19,000, but given the large gap between the 3-week and 5-week MAs, a rebound remains a possibility. On the daily chart, a sell signal has not yet been confirmed. If further declines confirm a bearish crossover, the Nasdaq could enter a third wave of selling, with a target of 17,300. The key question is whether the market experiences another sharp drop.
However, given the significant distance from the 5-day MA, the more likely scenario is sideways movement for a few days, allowing the moving averages to catch up before a potential further decline. In this case, it is advisable to trade within the range but always use stop-losses. The 240-minute chart also shows strong downward movement. While the market is in oversold territory, making short-selling more favorable, there is also the possibility of a range-bound pattern forming on the daily chart. If taking buy positions at the lows, strict stop-loss management is essential.
Crude Oil
Oil closed higher following news of tariffs imposed on Russian oil. The price successfully broke above the key resistance at $70, also surpassing the 240-day MA. On the monthly chart, oil has now entered a range where further upside potential exists, and there is a possibility that the MACD could attempt a bullish crossover with the signal line.
On the daily chart, the MACD has moved above the zero line, pulling the signal line upward. If the price stays above the 240-day MA, it may form a strong trend reversal pattern with accelerated gains. On the 240-minute chart, the MACD remains above the zero line and is crossing above the signal line, indicating continued buying momentum.
Overall, it is best to focus on buying dips, as April’s first trading session could see the price gapping above the 240-day MA. Holding overnight short positions carries risk, so caution is advised.
Gold
Gold closed higher, driven by strong demand for safe-haven assets. On the monthly chart, gold formed a long bullish candlestick. However, given the large gap between the price and the 3-month & 5-month MAs, a pullback remains a possibility. The key question is whether gold will continue rising before a correction or correct first before resuming its uptrend. It is best to monitor the price action closely.
On the daily chart, the MACD is forming a third wave of buying pressure, opening the possibility for a price target around 3,216. Thus, it is advisable to focus on buying dips, while being cautious about chasing highs due to potential volatility. The 240-minute chart indicates that strong buying momentum continues, as gold remains in overbought territory.
Since this is the beginning of a new month, key economic reports—including the ISM Manufacturing PMI and the U.S. Jobs Report—could significantly impact gold’s volatility. For both buy and sell positions, it is essential to set stop-loss levels, as increased volatility is expected.
With Trump’s tariff policies increasing the risk of a global recession, liquidity in global equity markets is drying up, reducing the attractiveness of stocks. The clear contrast between Nasdaq and gold’s performance is likely to persist for some time.
As we enter April’s first trading session, trade cautiously and adapt to market conditions.
Wishing you a successful trading day!
If you like my analysis, please follow me and give it a boost!
For additional strategies for today, check out my profile. Thank you!

Today analysis for Nasdaq, Oil, and GoldNasdaq
The Nasdaq closed sharply lower, forming a long bearish candlestick, as recession fears intensified. The index fell toward the lower Bollinger Band on the daily chart, while the MACD moved closer to the signal line, indicating a correction.
On the weekly chart, the Nasdaq faced resistance slightly above the 5-week MA, forming an upper wick and closing lower. The MACD is falling steeply, and the signal line is also in a downtrend, suggesting the potential for an overshooting move downward before forming a bottom. From a daily perspective, key support zones to watch are around 19,000 (first level) and 18,500 (second level). The MACD has not yet crossed below the signal line, but if a bearish crossover (death cross) occurs, a strong third wave of selling pressure could emerge. Therefore, caution is advised for long positions. However, since the MACD has not yet confirmed a bearish crossover, there is also the possibility of a rebound off the signal line. It is crucial to wait for a confirmed trend reversal before taking long positions.
On the 240-minute chart, strong sell signals have emerged, leading to a steep decline. The current price action resembles the movement seen on February 21, but since the bottom is not yet clear, it is best to adopt a conservative approach. For short positions, the 3-day moving average can be used as a reference level. For long positions, the lower Bollinger Band may provide a short-term buying opportunity. As today marks the last trading day of the month, watch closely to see if the Nasdaq reaches the 20-month MA or ends the month with a lower wick.
Crude Oil
Oil closed lower, facing resistance at $70. It has fallen back below the 5-day MA, trapping the price within a range-bound structure. On the weekly chart, oil was rejected at the 10-week MA, and since the MACD has not yet formed a bullish crossover, there is a chance that oil could retest its previous double-bottom level. A consolidation phase between the 5-week and 10-week MAs appears likely.
On the daily chart, as the price corrected, the MACD began converging with the signal line. If oil retraces to around $68, a short-term buying opportunity may arise. For oil to resume its uptrend, it needs to pull back toward $68, rebound, and break above $70 with strong momentum. However, this move would likely require a global catalyst. On the 240-minute chart, both the MACD and signal line remain above the zero line, suggesting a higher probability of a rebound and a golden cross formation. Overall, the best approach is to focus on dip-buying opportunities during this phase.
Gold
Gold closed higher, breaking to a new all-time high on the daily chart. Last week, there was a possibility of a pullback toward the 5-week MA, but the MACD has turned upward, surpassing its previous high, reducing the likelihood of a bearish divergence and increasing the probability of further upside. However, since gold has not yet tested the 5-week MA, a short-term correction remains a possibility. On the daily chart, buying opportunities were available at the 3-day MA following a strong bullish candle. A pullback to the 5-day MA within the next few days remains possible, and if this happens, it could present another dip-buying opportunity. Based on wave analysis, gold could target around 3,216. To confirm this upside scenario, the daily chart must show stronger bullish momentum, eliminating the risk of MACD divergence.
On the 240-minute chart, gold has been experiencing strong upward momentum, making it a buy-on-dips market. However, for a more comfortable long position, the MACD needs to exceed its previous peak. Overall, a long-only strategy remains preferable. For short positions, it is difficult to pinpoint the exact peak, so strict stop-loss management is essential. This week, key economic events include the ISM Manufacturing & Services PMIs and Friday's U.S. jobs report, which could increase gold's volatility. Stay cautious.
Today marks the final trading session of March. Tariff-related news and gold’s record highs indicate rising market volatility. Stay adaptive to the market’s movements and trade safely as we close the monthly candle.
Wishing you a successful trading day!
If you like my analysis, please follow me and give it a boost!
For additional strategies for today, check out my profile. Thank you!

Today analysis for Nasdaq, Oil, and GoldNasdaq
The Nasdaq closed lower, facing resistance at the 240-day moving average on the daily chart. With a significant gap between the price and the 5-day moving average, a pullback toward the 5-day MA was anticipated. The index did find support at the 5-day MA, closing with a lower wick. The key question now is whether the current correction wave will fill the gap created on Monday, as it faced resistance at the 240-day line. If you’re looking to buy on dips, it’s best to focus on the gap area as a potential support zone. The MACD remains in a golden cross, and with a noticeable spread from the signal line, the market is likely to stay range-bound unless a bearish crossover occurs.
On the 240-minute chart, a bearish crossover (death cross) has formed, suggesting the potential for further downside. However, the price is approaching a strong support zone where buying interest previously emerged. Thus, buying on dips in lower zones may be favorable. In the short term, both the MACD and the signal line remain above the zero line, indicating a possible short-term rebound. Be cautious with chasing short positions and monitor lower time frames.
Also, don’t forget: Today’s GDP release may influence market direction.
Crude Oil
Oil closed higher, reaching $70 on the daily chart. Since the $70–71 range is a major resistance zone, it’s likely the trend may consolidate in this area. The daily MACD is rising sharply, and buying pressure appears strong and one-sided. Despite the resistance at $70–71, if oil gaps up over the weekend, there’s a chance this resistance could be broken by a gap-up move on Monday. Keep an open mind to this possibility, but also be cautious over the weekend (over-the-weekend risk).
On the 240-minute chart, the MACD is bouncing off the signal line, with strong renewed buying pressure. However, if oil fails to break higher, a MACD divergence could develop, so avoid chasing longs at elevated levels. Overall, it’s safer to treat the $71 level as the upper boundary of a range, favoring short-term selling strategies. Watch the lower timeframes for signs of trend reversal.
Gold
Gold ended the day flat within a narrow range, forming a small consolidation box ahead of today’s GDP release and tomorrow’s PCE data. The daily MACD is converging with the signal line, suggesting we are approaching a turning point — either a new leg up or a bearish crossover. Both bullish and bearish scenarios remain open, so it’s important to monitor how the market reacts to upcoming data. If gold fails to push higher, a bearish divergence may form, opening the door to a pullback toward the 5-week MA on the weekly chart.
On the 240-minute chart, both MACD and the signal line are hovering near the zero line, indicating sideways movement. Since the signal line remains above zero, the buy side still holds a slight edge, but confirmation via a strong bullish or bearish candle is needed to establish a trend. Any MACD signal triggered at the zero line could lead to a larger directional move, so keep that in mind. Until data is released, continue range-bound trading, and avoid premature long or short positions, as today’s trend may remain undecided.
March is coming to an end. Make sure to keep a close eye on today and tomorrow's data releases and aim to close the month with solid results.
Wishing you a successful trading day!
If you like my analysis, please follow me and give it a boost!
For additional strategies for today, check out my profile. Thank you!

Today analysis for Nasdaq, Oil, and GoldNasdaq
The Nasdaq closed higher, forming a gap up on the daily chart. It showed a strong, one-directional rebound up to the 5-week moving average on the weekly chart.
Since the 5-week MA overlaps with the 60-week MA, it's unlikely to break through easily without a short-term correction.
On the daily chart, the MACD has formed a golden cross, meaning that even if a pullback occurs, the strategy should remain buy-on-dip oriented.
There is still an open gap down to 19,960, which could be filled at any time—so it's important to consider the possibility of a retest of that level. If the gap is filled, that area could be a good support zone to buy from.
On the 240-minute chart, strong buying momentum entered around the zero line, confirming a breakout after basing in a range. Therefore, buying on pullbacks remains the preferred approach in this structure.
Crude Oil
Crude oil continued its upward move, closing higher on the daily chart.
With strong support around the $68 level, the market could potentially rise toward the $70 zone, and possibly test resistance between $70–$71, which is a key area to watch closely.
Overall, traders should continue to buy on dips, but be cautious with chasing long positions above $70. If taking short positions, they should be managed with tight stop-losses.
On the 240-minute chart, oil appears to be in the midst of a third wave rally, so any short positions should be considered above $70, while buying pullbacks remains valid.
Current Middle East tensions and U.S. sanctions on Venezuelan oil are contributing to a supply risk premium in oil prices.
Since the market is recovering from the lows and showing a positive technical setup, short trades should be managed carefully with proper risk control.
Gold
Gold closed lower, remaining within its range-bound structure. On the daily chart, gold is currently trading between the 3-day and 5-day MAs above, and the 10-day MA below, forming a narrow consolidation zone. This makes sell-at-highs and buy-at-lows strategies effective.
Since there's room for a pullback to the 5-week MA on the weekly chart, chasing longs is not advised. If the MACD crosses below the signal line, this could create a bearish divergence, leading to potential sharp downside, so caution is warranted.
On the 240-minute chart, the MACD is failing to break above the signal line and continues to decline. However, since the signal line remains above the zero line, a rebound attempt is likely, even if the MACD dips below zero.
Given the current slope and distance, it's unlikely that a golden cross will form soon. Also, traders should keep in mind that major economic data such as GDP and PCE reports are scheduled later this week, which could influence market direction.
If you can understand the daily chart structure, you can better anticipate intraday high/low ranges and potential wave patterns. Make it a habit to perform thorough daily chart analysis each day, and prepare a trading scenario that suits the market’s behavior. As always, questions are welcome.
Wishing you a successful trading day!
If you like my analysis, please follow me and give it a boost!
For additional strategies for today, check out my profile. Thank you!
Weekly and Monday analysis for Nasdaq, Oil, and GoldNasdaq
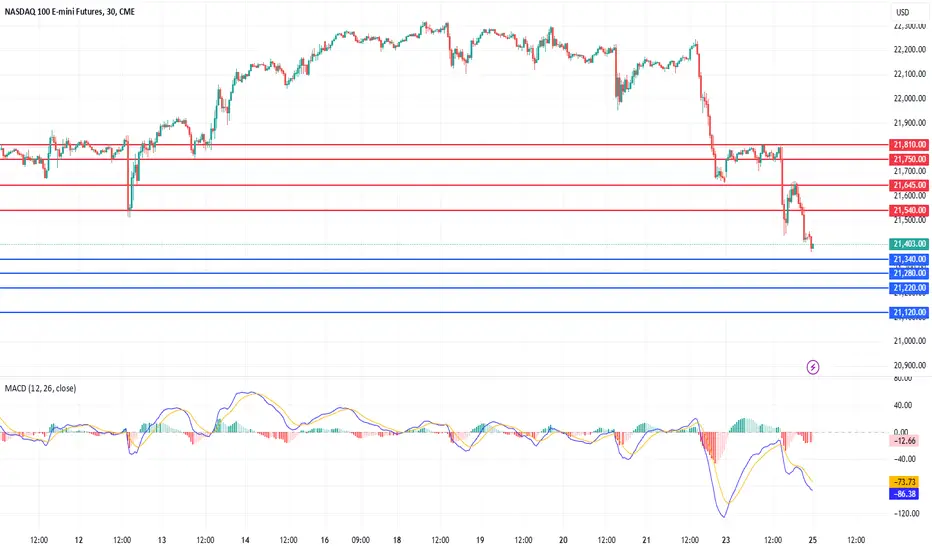
The Nasdaq closed higher, forming a long lower wick as it rebounded. On continuous futures, the index bounced off the 60-week MA, while the daily chart shows a recovery after briefly dropping below the 240-day MA. Looking at the weekly chart, two weeks ago, a large bearish candle decisively broke below a key range, and last week, the Nasdaq failed to break above the 3-week MA, leading to further downside. This week, however, a rebound toward the 5-week MA near 21,050 remains possible.
On the daily chart, the Nasdaq successfully found support near 19,800, forming a potential range-bound structure. Although a technical target exists at the 60-day MA near 21,500, the downtrend remains strong, meaning that a full recovery may take time. Instead of an immediate rally, the Nasdaq may consolidate around the 240-day MA, making a range-trading strategy more effective.
On the 240-minute chart, the Nasdaq formed a bullish divergence, triggered a golden cross, and started to rebound. As long as price continues to base at the lows, further buying attempts may emerge, making chasing short positions risky. This week, traders should monitor Wednesday’s CPI report and Thursday’s PPI report, as both could increase market volatility.
Crude Oil
Crude oil closed higher, supported by potential sanctions on Russia. On the weekly chart, oil dropped to the 240-week MA before rebounding, but last week’s bearish close triggered a sell signal. Since this sell signal occurred near the zero line, further downside remains possible, making chasing long positions risky. A key upside level to watch is the 3-week MA at $68, while support is expected around the $66–67 range, where a short-term double-bottom formation could develop.
On the daily chart, if oil continues to rebound, traders should watch for resistance at $68, while stopping out below the $65 previous low remains essential. On the 240-minute chart, the MACD has formed a golden cross, with momentum gradually shifting higher. However, since the gap between the MACD and the zero line remains large, selling pressure could reemerge on rallies. Traders should focus on buying dips at strong support levels while keeping strict stop-loss management in place.
Gold
Gold closed lower, remaining within a range-bound market structure. The Non-Farm Payroll (NFP) report triggered significant volatility, but the daily MACD is now turning downward, increasing the risk of additional selling pressure.
On the weekly chart, gold is forming a long-term consolidation range. If this week’s candle closes lower, the weekly MACD may form a bearish crossover, increasing the likelihood of a negative divergence pattern. This makes chasing long positions riskier.
On the daily chart, despite short-term weakness, the MACD and signal line remain far from the zero line, meaning that intermittent rebound attempts are still possible. For now, the lower Bollinger Band serves as key support, reinforcing a range-bound strategy. On the 240-minute chart, $2,940 has become a strong resistance level, and a sell signal has been triggered. For now, traders should focus on selling into rallies while looking for buying opportunities at lower levels. If gold breaks above $2,940, a third wave of buying momentum could emerge, making it essential to adapt to market conditions dynamically. Gold is also likely to react to Wednesday’s CPI and Thursday’s PPI reports, increasing potential volatility.
U.S. market volatility is rising sharply, as seen in the VIX index, which surged above 22 last week. Using technical tools like VIX analysis, moving averages, and MACD strategies can help improve market navigation. Stay disciplined, manage risk carefully, and have a successful trading week! 🚀
If you like detailed this analysis and today's strategy, please follow me and give it a boost!

Safe-Haven Demand Lifts Gold Amid US Tariff UncertaintyGold rose above $2,920 per ounce, nearing record highs, as a weaker dollar and trade uncertainty drove safe-haven demand. Trump granted US automakers a one-month exemption from 25% Canada-Mexico tariffs and hinted at more changes. A US official suggested lifting the 10% tariff on Canadian energy if trade conditions are met. Meanwhile, China filed a revised WTO complaint in response to new US tariffs. Investors await the non-farm payrolls report for Fed policy signals.
Key resistance stands at $2,923, with further levels at $2,955 and $3,000. Support is at $2,860, followed by $2,830 and $2,790.

Today analysis for Nasdaq, Oil, and GoldNasdaq
The Nasdaq closed lower as market volatility increased due to tariff concerns. Although the index dropped below the 240-day moving average, it formed a lower wick, indicating an attempt to establish a short-term bottom. On continuous futures, the 240-day MA is slightly below 20,000, meaning that the 20,100–20,000 zone is a key support area where a technical rebound is likely following the recent sharp decline. If the market falls into this zone, it could present a swing buying opportunity. Since the daily MACD and signal line are dropping steeply, a sideways consolidation period may be necessary to reduce their angle and separation before further directional movement.
Given that the Nasdaq rebounded strongly after forming a lower wick yesterday, a pullback in pre-market trading could provide a buy-the-dip opportunity. Additionally, potential bullish catalysts include today’s ADP Non-Farm Employment data and Friday’s Non-Farm Payroll report.
On the 240-minute chart, the index is forming a bullish divergence and attempting a golden cross, reinforcing the buy-the-dip strategy at current levels. Therefore, chasing shorts is not advisable, as the Nasdaq has entered a more attractive buying zone. A range-trading approach remains effective, with a preference for buying near support.
Crude Oil
Crude oil closed lower, finding support near previous demand zones. Despite the continued downtrend, the $66–67 range remains a strong support area, making it a potential rebound zone for technical buyers. However, on the daily chart, the MACD and signal line are sloping downward sharply, meaning that selling pressure could intensify further. Long positions should be initiated as close to the lower support zone as possible.
On the 240-minute chart, the MACD has formed another bearish crossover, confirming strong selling momentum. However, when compared to the previous MACD level near $68.50, price has declined further, but the MACD has not dropped as low, suggesting a potential bullish divergence. Since this zone has historically acted as strong support, a buy-the-dip strategy remains preferable, but traders should remain cautious of today’s Crude Oil Inventory report, which could lead to increased volatility.
Gold
Gold closed higher, successfully rebounding from support. Yesterday, gold reached the previously projected target of 2,925, aligning with the 240-day moving average characteristics.
If gold continues higher, the 2,940 level will act as resistance, as this is a previous supply zone on the daily chart. Therefore, further upside should be monitored carefully before making new decisions. Since the daily MACD and signal line remain widely separated, this is not an ideal condition for chasing long positions. Even if gold extends its rally, a pullback is likely, making buying dips a safer approach.
On the 240-minute chart, the MACD formed a golden cross, leading to a sharp rally. As expected, price reached the 60-day MA following the 240-day MA bounce. However, while the MACD has moved above zero, the signal line is still below zero, meaning that another corrective phase could occur before further upside. Additionally, there is a possibility that gold could revisit the 2,850 support zone to form a double-bottom structure, making buying dips a better strategy than chasing breakouts. Overall, a range-trading strategy—buying low and selling high—remains effective, and today’s ADP Non-Farm Employment data could introduce market volatility.
As market conditions shift, risk management remains crucial. Stay disciplined, adapt to volatility, and trade with confidence. Wishing you a successful trading day! 🚀
If you like my analysis, please follow me and give it a boost!
For additional strategies for today, check out my profile. Thank you!
Today analysis for Nasdaq, Oil, and GoldNasdaq
The Nasdaq closed sharply lower, rejecting resistance at the lower boundary of its previous range and dropping to the 240-day moving average. Testing the 240-day MA was an expected technical move, and after facing resistance at the 120-day MA, the index retested the 20,300–20,500 zone. This price action has formed the head of a head-and-shoulders pattern, making it crucial to watch for potential rebound attempts. However, since both the MACD and signal line have moved below the zero line, the market remains in a confirmed downtrend, making selling into rallies the preferred strategy.
As mentioned previously, if the Nasdaq finds support near the 240-day MA, a technical rebound toward the 60-day MA remains possible, as per moving average behavior. On the 240-minute chart, the index is holding support between 20,300–20,500 and still maintaining a golden cross. If the MACD avoids a bearish crossover with the signal line, the likelihood of a rebound increases, making buying near support a reasonable approach. However, the previous range low near 21,000–21,100 will likely act as strong resistance, making selling into rallies favorable. While no major economic reports are scheduled today, market volatility could increase due to comments from President Trump, so traders should maintain strict risk management.
Crude Oil
Crude oil closed lower following news that OPEC+ plans to increase production. On the daily chart, both the MACD and signal line are sloping downward, confirming a gradual downtrend. However, the $66–67 zone remains a strong support level, while the $70.50 level is the key resistance to watch. For now, trading within the range is the most effective strategy. If oil fails to stage a recovery this week, the weekly chart could confirm a sell signal, reinforcing further downside risk.
On the 240-minute chart, the MACD has formed another bearish crossover, suggesting that selling pressure is continuing. Instead of chasing shorts, traders should wait for a pullback to support near $66–67 and consider buying on dips. Given that market flows remain mixed, oil is likely to trade sideways, making range-bound trading the most effective approach for now.
Gold
Gold closed higher, finding support near previous highs. On the daily chart, the index rebounded to the 5-day moving average, and since both the MACD and signal line remain above zero, buying pressure remains intact. However, given the wide gap between the MACD and the signal line, even if gold continues higher, it may face another pullback, making chasing long positions risky. On the weekly chart, the bullish trend remains intact, but since gold is now approaching the 5-week moving average, breaking above resistance may take time.
On the 240-minute chart, a strong rebound emerged from the previous resistance zone, which aligns with the 240-day MA. The MACD has also formed a golden cross, meaning that if the uptrend continues, price targets could extend toward the 60-period MA on the 240-minute chart, potentially reaching the 2,925 area. However, since this initial move is a single-bottom formation, the market could attempt to form a double-bottom before continuing higher, making buying at lower levels more favorable. Gold could also enter a consolidation phase ahead of Friday’s Non-Farm Payroll (NFP) report, so traders should anticipate range-bound price action.
Risk management remains key, and I sincerely hope that March brings strong trading opportunities for all of you. Wishing you a successful trading day!
If you like my analysis, please follow me and give it a boost!
For additional strategies for today, check out my profile. Thank you!

Monthly, Weekly and Monday analysis for Nasdaq, Oil, and GoldNasdaq
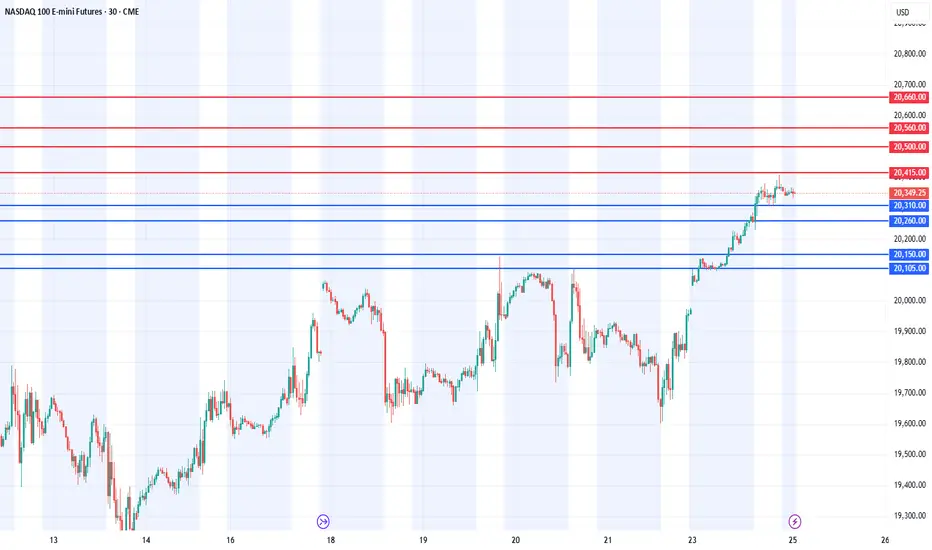
The Nasdaq closed higher, finding support at the lower Bollinger Band on the weekly chart. Due to the sharp decline last week, the 20,500 to 20,300 range was a technical rebound zone.
On the monthly chart, February closed with a bearish candle, bringing the index below the 5-day moving average and forming a range with the 10-day MA. For March, the 3-day and 5-day moving averages will act as resistance, while the 10-day MA serves as support. Since the monthly MACD is still above the signal line, even if corrections occur this month, rebound potential remains, meaning traders should be cautious about chasing shorts aggressively.
On the weekly chart, the Nasdaq fell below the 20-week MA, accelerating the sell-off. The MACD continues to slope downward, keeping further downside potential open, but since the signal line is still above zero, the index may consolidate between the 3-week and 5-week moving averages, making a range-bound strategy effective this week.
On the daily chart, both MACD and the signal line have dropped below zero, confirming a bearish market structure. The 21,000 level was broken decisively with a large bearish candle, meaning that if price struggles to reclaim this level, further downside toward the 240-day moving average is possible. If the Nasdaq falls to the 240-day MA, traders should prepare for a potential technical bounce, as historically, this level has provided support. Reviewing moving average dynamics could be helpful for understanding this scenario.
On the 240-minute chart, Friday’s low produced a strong rebound, making the MACD's potential golden cross a key signal to watch. As long as the recent lows hold, buying opportunities may exist, but since the signal line remains far above zero, selling pressure may persist on any rallies. Traders should avoid chasing long positions and focus on range trading. This week, traders should keep an eye on China’s National People's Congress (NPC) on Tuesday and the U.S. Employment Report on Friday, as both events could increase market volatility later in the week.
Crude Oil
Crude oil closed lower within a narrow range, continuing its sideways movement. On the monthly chart, February closed with a bearish candle, causing the MACD to turn downward while still maintaining a range-bound structure. Although the MACD and signal line remain above zero, buyers are still attempting to hold support within this range. For now, oil should be traded as a large range-bound market.
On the weekly chart, last week’s doji candle suggests indecision, and this week, the MACD has crossed below the signal line, triggering a sell signal. However, since a weekly close is needed to confirm this, the possibility of a trend reversal remains open. If oil continues lower this week, the sell signal will be fully confirmed, but if price rebounds, last week’s doji candle could mark a reversal point. Key bullish catalysts include Trump’s potential tariffs on Canada and Mexico, as well as the possibility of stricter oil sanctions on Venezuela. Meanwhile, bearish factors include economic slowdown fears reducing oil demand.
On the daily chart, breaking above $70 remains the key bullish trigger, but since the MACD has yet to form a golden cross, confirming an end to the downtrend is premature. On the 240-minute chart, the MACD has formed a golden cross, indicating a potential recovery after a pullback. For now, traders should buy dips cautiously, but breaking above $70 remains the key factor for further upside confirmation.
Gold
Gold closed sharply lower, forming a large bearish candle. On the daily chart, gold has fallen from previous highs to the lower Bollinger Band, meaning that additional downside (overshooting below support) remains possible.
On the monthly chart, gold formed a doji candle, indicating uncertainty. If gold found support at the 3-day MA last month, this month, traders should watch for support at the 5-day MA, as it could provide a buying opportunity on pullbacks.
On the weekly chart, gold has fallen to the 5-week MA, meaning that it has entered a range-bound structure. Since the lower support levels are still open, traders should avoid chasing long positions at highs and focus on buying lower. The U.S. Employment Report is due on Friday, which could increase volatility for gold.
On the daily chart, while the MACD is declining, the signal line remains well above zero, meaning that even if prices fall, rebound attempts are likely. On the 240-minute chart, further downside toward the 240-day moving average remains possible, but traders should watch for bottoming signals and potential support. If the MACD forms a golden cross, a strong rebound could follow, so monitoring short-term momentum shifts will be key.
February marked a transition to a range-bound market after an extended uptrend, suggesting that March could be a period of consolidation or further downside extension. Geopolitical risks have increased since Trump took office, and market volatility is rising due to key global events. Traders should focus on risk management and avoid overexposure. Wishing you a successful start to March! 🚀
If you like detailed this analysis and today's strategy, please follow me and give it a boost!

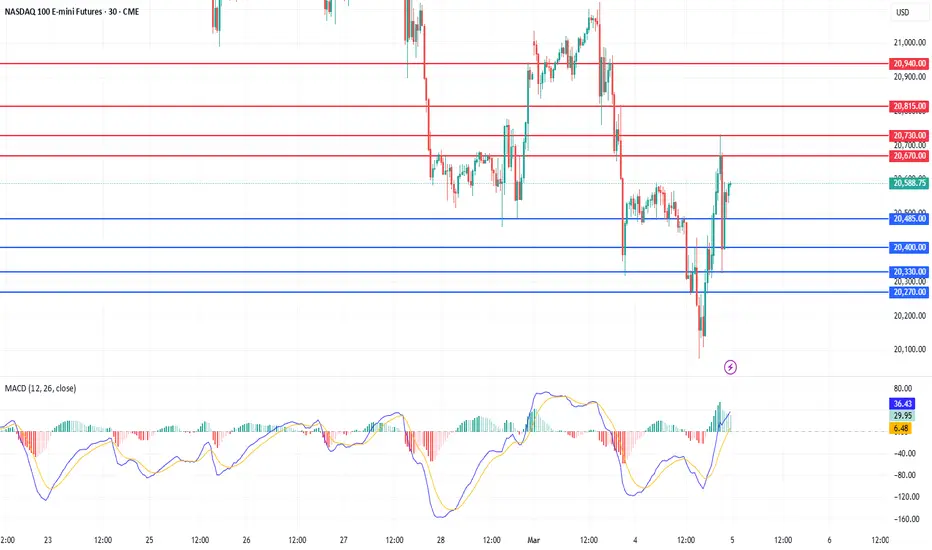
Today analysis for Nasdaq, Oil, and GoldNasdaq
The Nasdaq closed lower, continuing its selling pressure. The index quickly dropped to the lower boundary of a large range, touching the 120-day moving average. The daily MACD has formed a bearish crossover with the signal line, confirming the downtrend, and the index has now reached a potential support zone near previous lows. Yesterday provided a short opportunity at the 5-day moving average, and since there was no meaningful rebound, the gap between price and the 5-day MA has widened significantly. This suggests that a short-term technical bounce could occur based on intraday movements.
However, given the strong selling momentum on the daily chart, even if the market consolidates for a few days, further downside remains likely. If considering long positions, strict stop-loss management is essential. On the 240-minute chart, selling pressure continues to dominate, with both the MACD and signal line dropping sharply below the zero line. Comparing this to past price action near 20,763, the current MACD decline is even steeper, meaning that even if a short-term bounce occurs, the MACD is unlikely to recover back above zero easily. Overall, selling into rallies remains the preferred strategy, but traders should watch for intraday bottoming signals, as a bounce toward the 5-day MA is possible.
Crude Oil
Crude oil closed lower, weighed down by concerns over slowing consumer demand. On the daily chart, the sell signal remained intact, and the break below $70 has now confirmed a potential breakdown. Since $70 had been a key support/resistance level, the break below it suggests further downside risk. Today, a shorting opportunity may arise at the 3-day moving average, in line with technical retracement principles. However, the $66–67 range remains a strong support zone, so traders should monitor whether selling pressure is strong enough to push prices below this area. Since the MACD is turning sharply downward, and price action is forming a large bearish candle, the best strategy remains shorting into rallies near the 3-day MA.
On the 240-minute chart, a third bearish wave has developed, leading to an accelerated decline. Aside from potential buying at key support levels on the daily chart, selling into rallies remains the most favorable approach. Given that inventory data will be released today, traders should be cautious of increased volatility.
Gold
Gold closed sharply lower, forming a large bearish candle as the Consumer Confidence Index fell. Yesterday, gold was at a crossroads between a buy and sell signal, and with this bearish breakout, the sell signal is now confirmed. For now, gold is likely to trade within a broad range, as the daily MACD and signal line remain widely separated from the zero line. This suggests that while further downside is possible, periodic rebounds should also be expected.
Since gold has now fallen below the 10-day moving average and reached the 20-day MA, traders should treat the 3-day, 5-day, and 10-day MAs as key resistance levels, while the 20-day, 30-day, and 60-day MAs serve as support levels. On the 240-minute chart, the MACD has dropped below zero, with the signal line following downward. This reinforces a range-bound trading strategy, focusing on buying at major support levels while keeping in mind potential rebounds.
By analyzing the daily candles, traders can identify potential future scenarios for Nasdaq, oil, and gold. This is why daily and intraday technical analysis is essential. Additionally, NVIDIA’s earnings report will be released tonight, which could introduce further market volatility. Stay disciplined, manage risk carefully, and have a successful trading day!
If you like my analysis, please follow me and give it a boost!
For additional strategies for today, check out my profile. Thank you!

Today analysis for Nasdaq, Oil, and GoldNasdaq
The Nasdaq closed lower following news that Microsoft is reducing its data center leasing. This week, the weekly chart suggests strong selling pressure, meaning long positions should be approached with caution.
On the daily chart, yesterday’s bearish candle confirmed the MACD sell signal, though the signal line remains above the zero line. In a broader context, a potential bounce could occur near key technical levels, including the lower Bollinger Band, 120-day moving average, and previous resistance zones.
Two days ago, a large bearish candle formed, and yesterday’s price action provided an opportunity to sell at the 3-day moving average. However, the market failed to test the 3-day MA during pre-market, leading to a false impression that the daily close was rejected at resistance. This illustrates how a daily close can sometimes be misleading, reinforcing the need to plan for alternative scenarios.
Since selling was executed at the 3-day MA yesterday, today’s key resistance level shifts to the 5-day moving average. Given the wide gap between price and the 5-day MA, a short-term rebound toward this level is possible.
On the 240-minute chart, both the MACD and signal line have moved below the zero line, confirming continued selling pressure. However, since the Nasdaq has now entered a key support zone from a previous range, a short-term bounce toward the 5-day MA is possible. Traders should be cautious with short positions and focus on range-bound strategies rather than chasing downside momentum.
Crude Oil
Crude oil gapped down but managed to close higher. Despite the ongoing MACD sell signal on the daily chart, oil held above the key $70 support level.
This week’s weekly close is critical—if oil can end the week with a bullish candle, it could set the stage for a potential reversal. Holding above $70 remains the key technical factor, as a breakdown below this level would signal further downside.
On the daily chart, if the market fails to extend lower and instead rebounds, a MACD double-bottom pattern could develop, reinforcing potential upside momentum. However, since market flows remain mixed, it is best to treat oil as range-bound until a decisive break occurs.
On the 240-minute chart, both the MACD and signal line are below the zero line, but price action is attempting a temporary rebound. While selling into rallies remains the preferred approach, traders should be cautious of event-driven volatility, as news developments could trigger sudden moves.
The $70 level remains the key downside level to monitor—if it breaks, selling pressure could intensify. Risk management is crucial when taking long positions.
Gold
Gold briefly made new highs before closing flat within its range. On the daily chart, the buy signal remains intact, but today’s session will be crucial in determining whether gold can sustain its momentum or enter a consolidation phase.
The key factor to watch is whether gold finds support at the signal line and continues higher or if a bearish crossover forms, leading to a range-bound correction.
On the 240-minute chart, a bullish MACD crossover has occurred, but for the uptrend to be confirmed, a strong breakout candle is needed. Without a significant bullish move, gold risks forming a bearish divergence, meaning that even if price breaks to new highs, the MACD may fail to confirm the move.
Since market flows remain mixed, a range-trading approach remains most effective, with a focus on buying at strong support levels and avoiding breakout trades. Traders should remain flexible and manage risk carefully, as both upside and downside scenarios remain open.
Looking at VIX futures, a strong buy signal has emerged at the zero level. Historically, VIX buy signals near zero tend to generate large price swings, suggesting that Nasdaq volatility may increase significantly. This increases the likelihood of a sharp correction, making risk management a top priority.
Stay disciplined, manage risk carefully, and wishing you a successful trading day! 🚀
If you like my analysis, please follow me and give it a boost!
For additional strategies for today, check out my profile. Thank you!