AVAX (Avalanche): Head shoulders detectedAVAX (Avalanche): Head shoulders detected
R.O.C in negative territory!
a reduction of 26 euros is possible.
Monitor the PRZ zone for a potential rebound
Avalanche

AVAX: Channel DownTrade setup : After getting rejected at $50 resistance, price has been pulling back, forming a Channel Down pattern. It appears on the brink of a breakout but it’s too early to tell. We wait for confirmation, if price can break above $35 key level.
Pattern : Price is trading in a Channel Down pattern. With emerging patterns, traders who believe the price is likely to remain within its channel can initiate trades when the price fluctuates within its channel trendlines. With complete patterns (i.e. a breakout) – initiate a trade when the price breaks through the channel’s trendlines, either on the upper or lower side. When this happens, the price can move rapidly in the direction of that breakout.
Trend : Neutral on Short- and Medium-Term basis and Uptrend on Long-Term basis.
Momentum is Mixed as MACD Line is below MACD Signal Line (Bearish) but RSI ~ 50 (Neutral). MACD Histogram bars are rising, which suggests that momentum could be nearing another upswing.
Support and Resistance : Nearest Support Zone is $25, then $19. The nearest Resistance Zone is $35 (previous support), then $50.

AVAX: Channel DownTrade setup : After getting rejected at $50 resistance, price has been pulling back, forming a Channel Down pattern. Notice that the price is also nearing oversold levels (RSI ~ 30) just as it approaches $25 support. That’s also 78.60% Fibonacci Retracement level (potential support) of $25.70. Hence, near term, we could see price bounce up to $30.
Pattern : Price is trading in a Channel Down pattern. With emerging patterns, traders who believe the price is likely to remain within its channel can initiate trades when the price fluctuates within its channel trendlines. With complete patterns (i.e. a breakout) – initiate a trade when the price breaks through the channel’s trendlines, either on the upper or lower side. When this happens, the price can move rapidly in the direction of that breakout.
Trend : Downtrend on Short-Term basis, Neutral on Medium-Term basis and Uptrend on Long-Term basis.
Momentum is Bearish (MACD Line is below MACD Signal Line, and RSI is below 45).
Support and Resistance : Nearest Support Zone is $25, then $19. The nearest Resistance Zone is $35 (previous support), then $50.

AVAX: Thoughts and Analysis, potential low discussion.
Today's focus: AVAX
Pattern – 50% Fibbo, HL low analysis.
Support – 29.22
Resistance – 33
Hi, and thanks for checking out today's update.
Today, we are taking a look at AVAX (Avalanche) on the daily chart. Looking at price with a Fibonacci retracement tool on the chart, we can see that price lines up at the 50% point. This point also lines up with a previous high. We discuss the significance of the 50% Fib point and when price lines up with previous highs in today's update.
We have also run over what we are looking for to start calling a confirmed low and continuation. Signs are building, but buyers still have some work to do.
Good trading.

back to breakeven(AVAX)📊Analysis by AhmadArz:
🔗"Uncover new opportunities in the world of cryptocurrencies with AhmadArz.
💡Join us on TradingView and expand your investment knowledge with our five years of experience in financial markets."
🚀Please boost and💬 comment to share your thoughts with us!

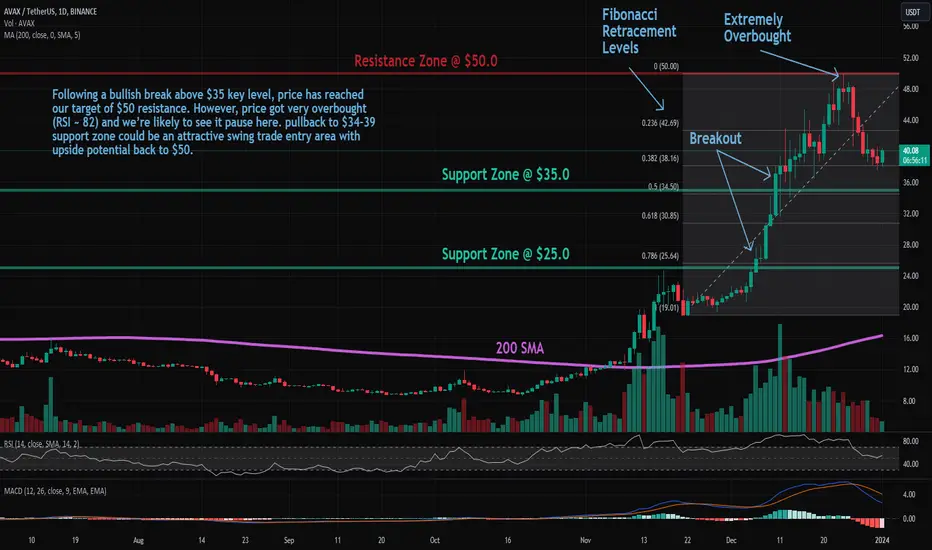
AVAX: Pullback in UptrendTrade setup : Following a bullish break above $35 key level, price reached our target of $50 resistance. However, price got very overbought (RSI ~ 82) and price has pulled back on some profit taking. The nearest horizontal support is $35 while the nearest Fibonacci Retracement levels (possible support) are $38 (38.20%), $34 (50%), and $31 (61.80%). Hence, pullback to $34-39 support zone could be an attractive swing trade entry area with upside potential back to $50. Stop Loss (SL) at $32 (just below prior swing low).
Trend : Downtrend on Short-Term basis and Uptrend on Medium- and Long-Term basis.
Momentum is Mixed as MACD Line is below MACD Signal Line (Bearish) but RSI ~ 50 (Neutral). MACD Histogram bars are rising, which suggests that momentum could be nearing another upswing.
Support and Resistance : Nearest Support Zone is $35, then $25. The nearest Resistance Zone is $50.

AVAX JUST A LOOKING FOR SOMETHING :)Hi guys :) its been a while :)
Here we see an analogy in the Avax harmonic table that we have not looked at for a long time. it may be very simple data for someone. But since i think 2024 will be the year of "Real World Assets", i think the chart will work positively. it is not recommended to invest based on this study. Do your own technical and fundamental analysis without getting caught up in the manipulations on social media.
Have nice year :)

AVAX: Pullback in UptrendTrade setup : Following a bullish break above $35 key level, price reached our target of $50 resistance. However, price got very overbought (RSI ~ 82) and price has pulled back on some profit taking. The nearest horizontal support is $35 while the nearest Fibonacci Retracement levels (possible support) are $38 (38.20%), $34 (50%), and $31 (61.80%). Hence, pullback to $34-39 support zone could be an attractive swing trade entry area with upside potential back to $50. Stop Loss (SL) at $32 (just below prior swing low).
Trend : Uptrend across all time horizons (Short- Medium- and Long-Term).
Momentum is Mixed as MACD Line is below MACD Signal Line (Bearish) but RSI ~ 50 (Neutral). MACD Histogram bars are rising, which suggests that momentum could be nearing another upswing.
Support and Resistance : Nearest Support Zone is $35, then $25. The nearest Resistance Zone is $50.

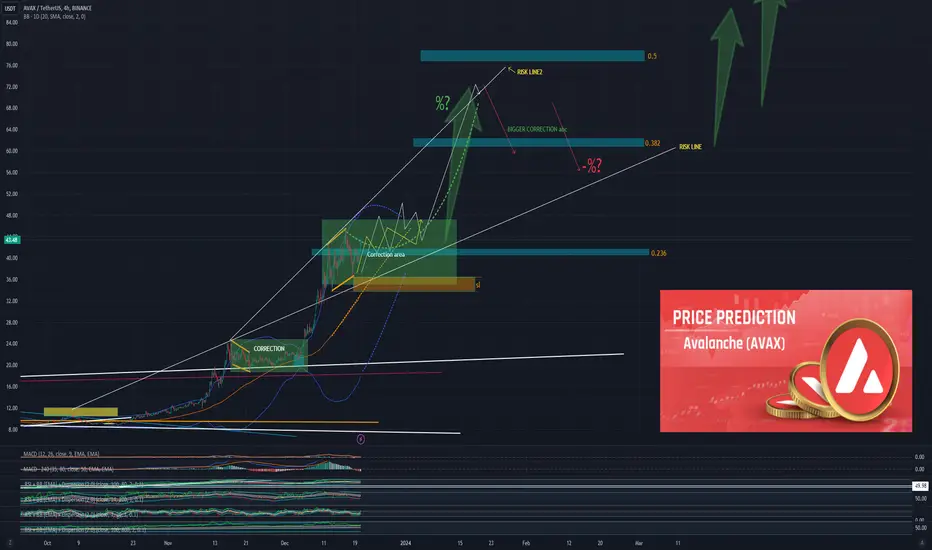
Avalanche PRICE PREDICTION *AVAX*Avax has been surprisingly strong and continues to do so with the latest strong wave.
It is likely to break above the $60 level with the last wave.
60 is the minimum and it is possible that it will be higher in reality, but at the moment no one knows what the real level is
After that, a bigger correction to make new higher highs.
Given the overall state of the crypto market, this is a possible reality
Don't forget to support the analysis if you agree.
MoralDisciple
AVAX/USDT Break the descending channel, Ready for continue up??💎 AVAX's market behavior has recently displayed remarkable dynamism. Currently, AVAX has made a notable breakout from its descending channel pattern and is in the midst of a retesting phase at a pivotal support level. This phase is crucial for AVAX to validate its breakout and continue its ascent towards a significant resistance target.
💎 However, if AVAX struggles during the retesting phase at the support level, exhibiting signs of failure or breakdown, it may indicate a false breakout. This scenario could potentially lead AVAX to revisit the demand area around 31.3, a critical juncture for determining its future trajectory.
💎 Historically, AVAX has demonstrated a strong rebound when reaching the demand zone, suggesting a similar potential response in the current context.
💎 Nonetheless, a lackluster reaction or inability to hold the demand zone could signal bearish trends, possibly leading to a breakdown of this area. Should this occur, AVAX's next directional move could be towards the Bullish OB area, marking a key area for future market movements.

AVAX may bounce backAVAX has returned to its previous trend and could start a new move from here. The positive atmosphere that may occur with the ETF news may start a new rally. Can be entered with spot or low leverage.

AVAX: Pullback in UptrendTrade setup : Following a bullish break above $35 key level, price reached our target of $50 resistance. However, price got very overbought (RSI ~ 82) and price has pulled back on some profit taking. The nearest horizontal support is $35 while the nearest Fibonacci Retracement levels (possible support) are $38 (38.20%), $34 (50%), and $31 (61.80%). Hence, pullback to $34-39 support zone could be an attractive swing trade entry area with upside potential back to $50. Stop Loss (SL) at $32 (just below prior swing low).
Trend : Neutral on Short-Term basis and Uptrend on Medium- and Long-Term basis.
Momentum is Bearish (MACD Line is below MACD Signal Line, and RSI is below 45).
Support and Resistance : Nearest Support Zone is $35, which it broke, then $25. The nearest Resistance Zone is $50.

In trend-bear (AVAX)📊Analysis by AhmadArz:
Next break renge
🔍Entry: 33.416
🛑Stop Loss: 34.504
🎯Take Profit: 32.346
🔗"Uncover new opportunities in the world of cryptocurrencies with AhmadArz.
💡Join us on TradingView and expand your investment knowledge with our five years of experience in financial markets."
🚀Please boost and💬 comment to share your thoughts with us!

AVAX: Pullback in UptrendTrade setup : Following a bullish break above $35 key level, price reached our target of $50 resistance. However, price got very overbought (RSI ~ 82) and price has pulled back on some profit taking. The nearest horizontal support is $35 while the nearest Fibonacci Retracement levels (possible support) are $38 (38.20%), $34 (50%), and $31 (61.80%). Hence, pullback to $34-39 support zone could be an attractive swing trade entry area with upside potential back to $50. Stop Loss (SL) at $32 (just below prior swing low).
Trend : Neutral on Short-Term basis and Uptrend on Medium- and Long-Term basis.
Momentum is Mixed as MACD Line is below MACD Signal Line (Bearish) but RSI ~ 50 (Neutral).
Support and Resistance : Nearest Support Zone is $35 (previous resistance), then $25. The nearest Resistance Zone is $50.

AVAX potential downside to $35My MACD-VWAP indicator signaling potential downside for AVAX to $35 in the coming weeks. My next buy the dip zones are 35 dollars and if we break that with volume, the next downside target is 28 dollars. While in the long run I'm bullish on AVAX, in the near term we may pull back to 28-35 zone that is health for continuation of the longer term bullish structure.
For a limited time I will give free access to my indicator that has been catching winning trades. DM me to request access.
Read the rules of the the trading system below.

AVAX: Pullback in UptrendTrade setup : Following a bullish break above $35 key level, price has reached our target of $50 resistance. However, price got very overbought (RSI ~ 82) and we’re seeing some profit taking. Now we wait for the right entry area (support). How far could it pull back? The nearest horizontal support is $35 and the nearest Fibonacci Retracement levels (possible support) are $38 (38.20%), $34 (50%), and $31 (61.80%). Hence, pullback to $34-39 support zone could be an attractive swing trade entry area with upside potential back to $50.
Trend : Uptrend across all time horizons (Short- Medium- and Long-Term).
Momentum is Mixed as MACD Line is below MACD Signal Line (Bearish) but RSI ~ 50 (Neutral).
Support and Resistance : Nearest Support Zone is $35 (previous resistance), then $25. The nearest Resistance Zone is $50.
latest movement..? (AVAX)❤️❤️Thanks for boosting 🚀 and supporting us!
📈when in bull-trend we can trade in bull-trend in small correction ___ with distance measuremove last movement for reverse trend.
🔗 For more communication with us, In the footnote and send a message in TradingView.
👨🎓 Experience and Education: Our trading team has five years of experience in financial markets, especially cryptocurrencies.

Candle of breaked(AAVE)❤️❤️Thanks for boosting 🚀 and supporting us!
📈When I am in a reng and that reng is broken with a powerful candle, I can decide to follow the same process from the broken side, and AAVE has exactly the same conditions.
📊 (Entry) : 119.57
🔴 Stop Loss : 111.34
🎯 Take Profit : 125-131-138-144
🔗 For more communication with us, In the footnote and send a message in TradingView.
👨🎓 Experience and Education: Our trading team has five years of experience in financial markets, especially cryptocurrencies.

AVAX: Pullback in UptrendTrade setup : Following a bullish break above $35 key level, price has reached our target of $50 resistance. However, price got very overbought (RSI ~ 82) and we’re seeing some profit taking. Now we wait for the right entry area (support). How far could it pull back? The nearest horizontal support is $35 and the nearest Fibonacci Retracement levels (possible support) are $38 (38.20%), $34 (50%), and $31 (61.80%). Hence, pullback to $34-38 support zone could be an attractive swing trade entry area with upside potential back to $50.
Trend : Uptrend across all time horizons (Short- Medium- and Long-Term).
Momentum is Mixed as MACD Line is below MACD Signal Line (Bearish) but RSI > 55 (Bullish).
Support and Resistance : Nearest Support Zone is $35 (previous resistance), then $25. The nearest Resistance Zone is $50.

AVAX: Overbought at ResistanceTrade setup : Following a bullish break above $35 key level, price has reached out target of $50 resistance. However, price got very overbought (RSI ~ 82) and we’re likely to see it pause here on some profit taking.
Trend : Uptrend across all time horizons (Short- Medium- and Long-Term).
Momentum is Bullish but extremely overbought. (MACD Line is above MACD Signal Line). RSI is bullish (> 55) but extremely overbought (> 80) which could imply that price could briefly pause or pull back if it reaches Resistance.
Support and Resistance : Nearest Support Zone is $35 (previous resistance), then $25. The nearest Resistance Zone is $50.

AVAXUSDT - LONG Setup!!AVAXUSDT (1D Chart) Technical analysis
AVAXUSDT (1D Chart) Currently trading at $11.3
Buy level: Above $11.2
Stop loss: Below $9.5
TP1: $12.5
TP2: $15
TP3: $18
TP4: $22
Max Leverage 2x
Always keep Stop loss
Follow Our Tradingview Account for More Technical Analysis Updates, | Like, Share and Comment Your thoughts

AVAX: Resistance BreakoutTrade setup : Bullish break above $35 key level signaled continuation of uptrend. However, price got very overbought (RSI ~ 90) and we’re likely to see it pause here on some profit taking. Nearest horizontal support zone is at $35 while the nearest Fibonacci Retracement levels (possible support) are $39 (23.60%) and $35 (38.20%). Hence, it appears that $35-$36 could be an attractive swing trade entry area in Uptrend, with upside potential to $50 thereafter.
Trend : Uptrend across all time horizons (Short- Medium- and Long-Term).
Momentum is Bullish but inflecting. MACD Line is above MACD Signal Line and RSI is above 55 but momentum may have peaked since MACD Histogram bars are declining, which suggests that momentum is weakening.
Support and Resistance : Nearest Support Zone is $35 (previous resistance), then $25. The nearest Resistance Zone is $50.

Avalanche ($AVAX) Surges 400% in Two MonthsAvalanche (AVAX) outperforms majority of large-caps, jumps to pre-LUNA-collapse levels.
After a marvelous 30% upsurge last week, AVAX replaced Dogecoin (DOGE) as the ninth largest cryptocurrency asset.
Its upsurge is driven by a combination of long-term and short-term catalysts as AVAX outperforms almost all large-cap altcoins.
Avalanche (AVAX) price rally expands The price of Avalanche (AVAX), the core native asset of the eponymous blockchain network, set a new local high at $44 on major spot exchanges today, Dec. 16, 2023. Last time AVAX was so expensive on May 8, 2022, before the ecosystem of Terra/Luna collapsed. As such, today marks an 83-week high for the AVAX price.
Last week, AVAX became the fastest-growing altcoin in the top 20 of the largest assets; in the top 30 of CoinMarketCap it was only surpassed by Internet Computer (ICP). In the last 24 hours, $4.88 million of AVAX positions, mostly shorts, were liquidated. The largest single liquidation was registered on OKX in an AVAX-USDT short and exceeded $128,000 in equivalent.
In the last two months, the total value locked (TVL) in Avalanche-based decentralized finance (DeFi) protocols almost doubled: It soared from $487 million to $949 million. Benqi, Trader Joe, Aave and GMX are the largest and fastest-growing DeFis in the ecosystem.
